The same plot in 14 other libraries — JavaScript: Chart.js, D3.js, Apache ECharts, Highcharts; Python: Altair, Bokeh, lets-plot, Matplotlib, Plotly, plotnine, Pygal, Seaborn; R: ggplot2; Julia: Makie.jl. Compare all 15 side by side: Volcano Plot for Statistical Significance in Python, R, Julia and JavaScript.
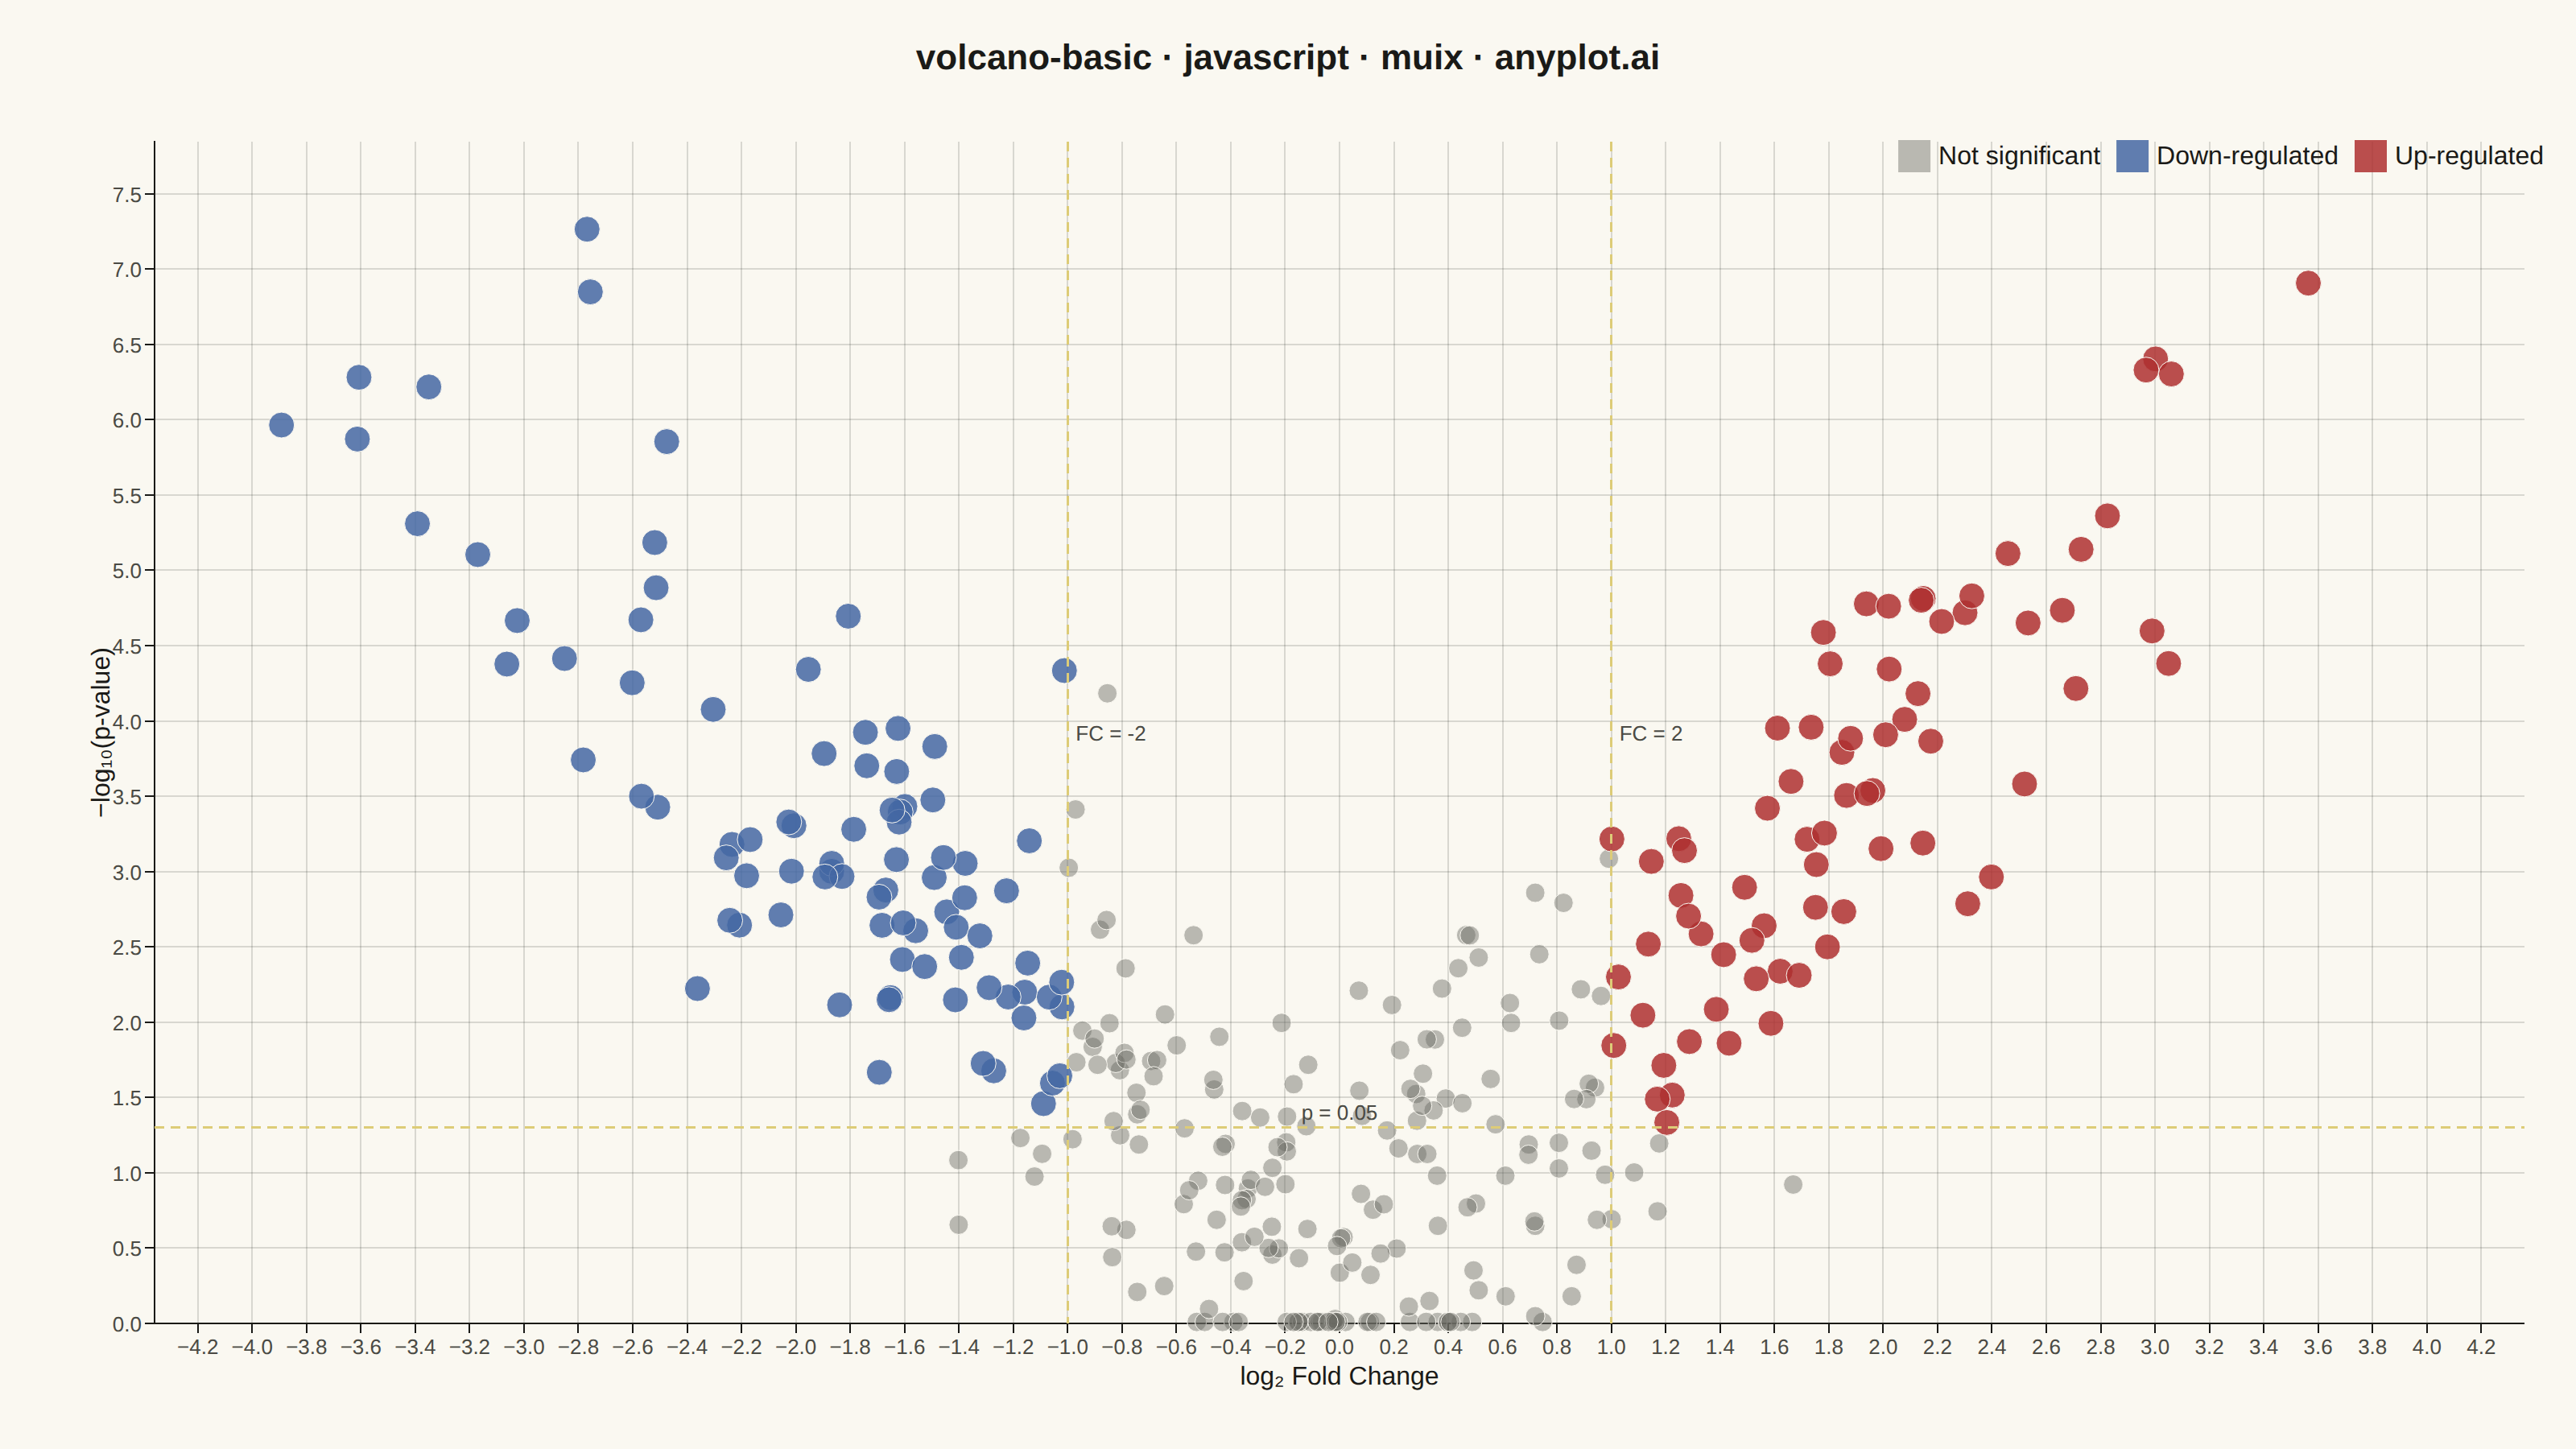
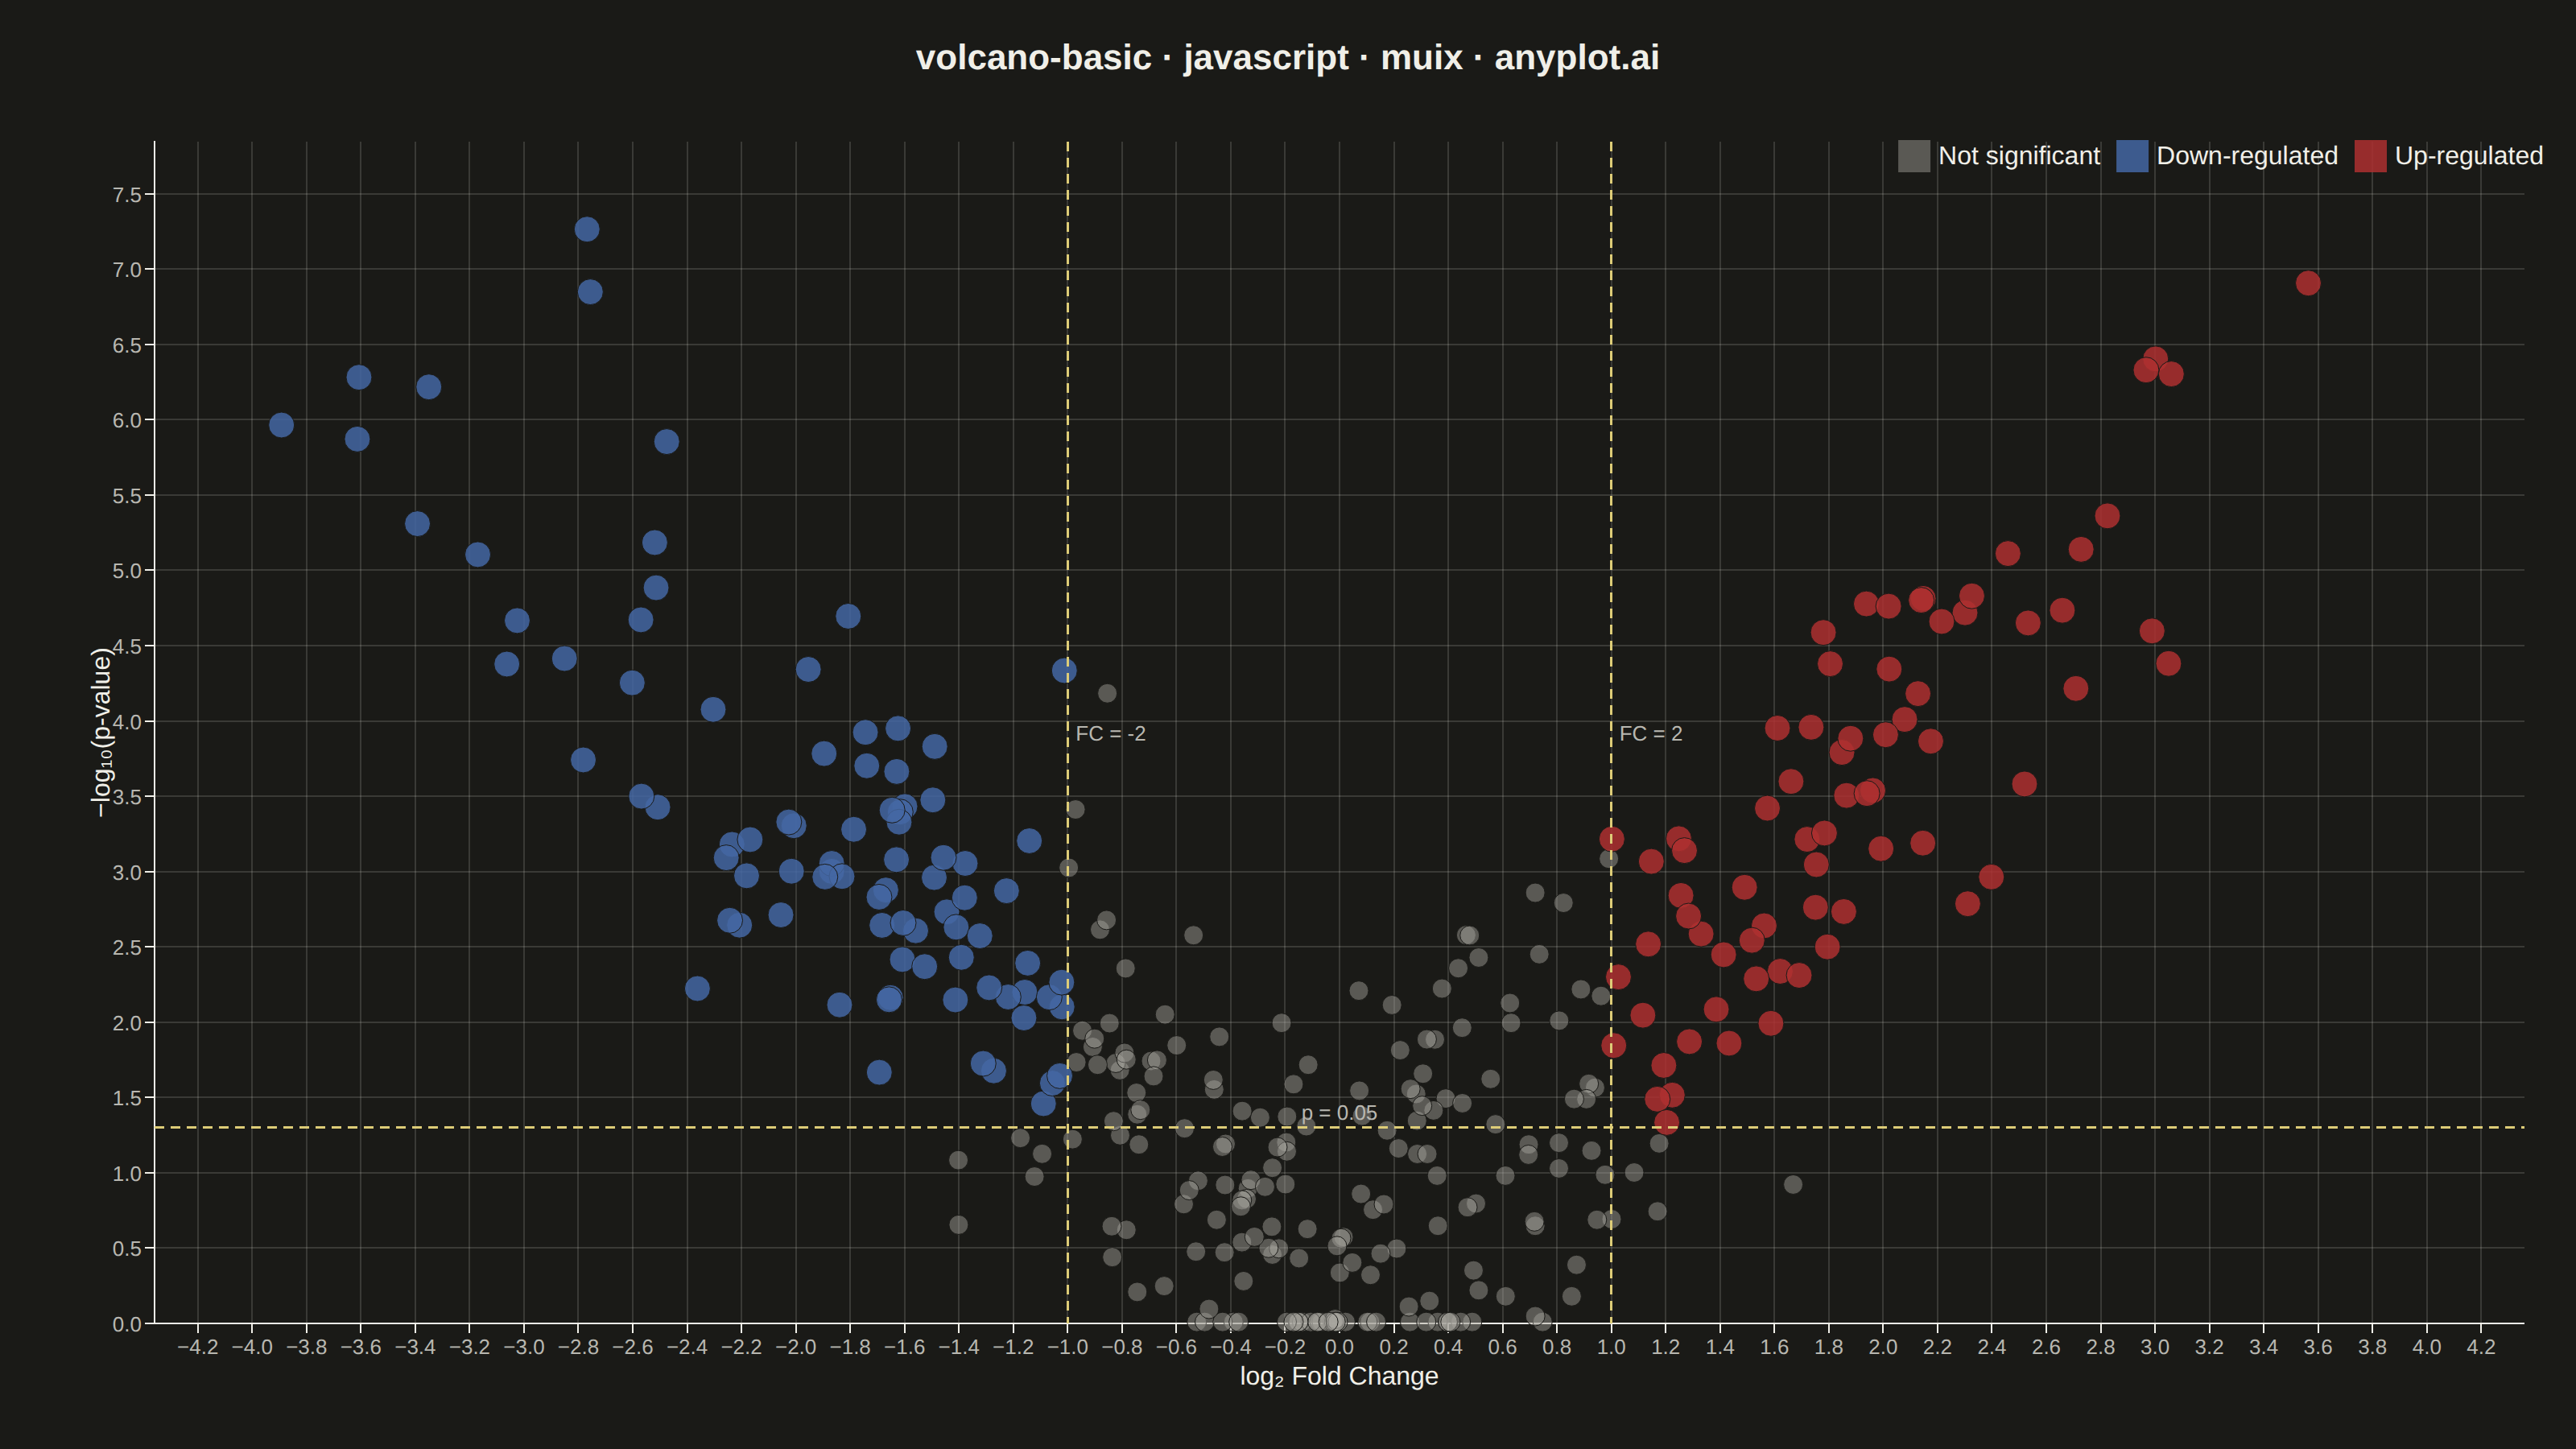
A volcano plot displays statistical significance (-log10 p-value) on the y-axis versus effect size (log2 fold change) on the x-axis. Points are typically color-coded to highlight features that are both statistically significant and have large effect sizes. This visualization is essential for quickly identifying the most important changes in differential expression, proteomics, and genomics studies.
// anyplot.ai
// volcano-basic: Volcano Plot for Statistical Significance
// Library: muix 7.29.1 | JavaScript 22.23.2
// Quality: 89/100 | Created: 2026-09-09
import { ScatterChart } from "@mui/x-charts/ScatterChart";
import { ChartsReferenceLine } from "@mui/x-charts/ChartsReferenceLine";

const t = window.ANYPLOT_TOKENS;
const { width, height } = window.ANYPLOT_SIZE;

// --- Data (in-memory, deterministic) ----------------------------------------
// RNA-seq differential expression: treatment vs. control across 350 genes.
// Genes with a larger effect size tend to carry stronger evidence (typical
// volcano funnel), with enough noise that the significance thresholds still
// have to do real classification work.
let seed = 42;
const nextRandom = () => {
  seed = (Math.imul(seed, 1103515245) + 12345) & 0x7fffffff;
  return seed / 0x7fffffff;
};
const nextGaussian = () => {
  const u1 = Math.max(nextRandom(), 1e-9);
  const u2 = nextRandom();
  return Math.sqrt(-2 * Math.log(u1)) * Math.cos(2 * Math.PI * u2);
};

const P_THRESHOLD = 1.3; // -log10(0.05)
const FC_THRESHOLD = 1; // 2-fold change

const GENE_COUNT = 350;
const genes = [];
for (let i = 0; i < GENE_COUNT; i += 1) {
  const log2FoldChange = nextGaussian() * 1.4;
  const noise = nextGaussian() * 0.8;
  const negLog10Pvalue = Math.max(
    0.01,
    Math.abs(log2FoldChange) * 1.6 + noise + nextRandom() * 0.6,
  );
  genes.push({
    id: i,
    x: Number(log2FoldChange.toFixed(3)),
    y: Number(negLog10Pvalue.toFixed(3)),
  });
}

const nonSignificant = [];
const upRegulated = [];
const downRegulated = [];
genes.forEach((gene) => {
  const isSignificant = gene.y > P_THRESHOLD && Math.abs(gene.x) > FC_THRESHOLD;
  if (!isSignificant) nonSignificant.push(gene);
  else if (gene.x > 0) upRegulated.push(gene);
  else downRegulated.push(gene);
});

const xAbsMax = Math.max(...genes.map((g) => Math.abs(g.x)));
const xPad = xAbsMax * 0.12;
const yMax = Math.max(...genes.map((g) => g.y));

// Significance colors follow the domain convention the spec calls out
// (up-regulated red, down-regulated blue, non-significant muted gray) rather
// than the default ordinal Imprint order — see "Semantic exception" in
// default-style-guide.md.
const withAlpha = (hex, alpha) => {
  const n = parseInt(hex.slice(1), 16);
  const r = (n >> 16) & 255;
  const g = (n >> 8) & 255;
  const b = n & 255;
  return `rgba(${r}, ${g}, ${b}, ${alpha})`;
};
const UP_COLOR = t.palette[4]; // matte red — semantic anchor for up-regulated
const DOWN_COLOR = t.palette[2]; // blue — semantic anchor for down-regulated
const MUTED = t.theme === "light" ? "#6B6A63" : "#A8A79F"; // theme-adaptive muted anchor
const NON_SIG_COLOR = withAlpha(MUTED, 0.45);
const THRESHOLD_COLOR = t.amber; // warning/caution anchor for the cutoff lines

// --- Title (fontsize scales with title length, see plot-generator.md) -------
const TITLE = "volcano-basic · javascript · muix · anyplot.ai";
const TITLE_FONTSIZE = Math.round(
  22 * (TITLE.length > 67 ? 67 / TITLE.length : 1),
);
const TITLE_H = 72;

const MARKER_SX = { "& circle": { stroke: t.pageBg, strokeWidth: 0.5 } };

// --- Chart (default-exported component — the harness mounts it) -------------
export default function Chart() {
  return (
    <div style={{ width, height, display: "flex", flexDirection: "column" }}>
      <div
        style={{
          height: TITLE_H,
          display: "flex",
          alignItems: "center",
          justifyContent: "center",
          fontSize: TITLE_FONTSIZE,
          fontWeight: 600,
          color: t.ink,
          fontFamily: "Roboto, Helvetica, Arial, sans-serif",
        }}
      >
        {TITLE}
      </div>
      <ScatterChart
        width={width}
        height={height - TITLE_H}
        skipAnimation
        grid={{ horizontal: true, vertical: true }}
        margin={{ left: 96, right: 32, top: 16, bottom: 78 }}
        slotProps={{
          legend: { position: { vertical: "top", horizontal: "right" } },
        }}
        xAxis={[
          {
            min: -(xAbsMax + xPad),
            max: xAbsMax + xPad,
            label: "log₂ Fold Change",
            labelStyle: { fontSize: 16, fill: t.ink },
            tickLabelStyle: { fontSize: 13, fill: t.inkSoft },
          },
        ]}
        yAxis={[
          {
            min: 0,
            max: yMax * 1.08,
            label: "−log₁₀(p-value)",
            labelStyle: { fontSize: 16, fill: t.ink },
            tickLabelStyle: { fontSize: 13, fill: t.inkSoft },
          },
        ]}
        series={[
          {
            id: "non-sig",
            label: "Not significant",
            data: nonSignificant,
            markerSize: 6,
            color: NON_SIG_COLOR,
          },
          {
            id: "down",
            label: "Down-regulated",
            data: downRegulated,
            markerSize: 8,
            color: withAlpha(DOWN_COLOR, 0.85),
          },
          {
            id: "up",
            label: "Up-regulated",
            data: upRegulated,
            markerSize: 8,
            color: withAlpha(UP_COLOR, 0.85),
          },
        ]}
        sx={MARKER_SX}
      >
        <ChartsReferenceLine
          y={P_THRESHOLD}
          label="p = 0.05"
          labelStyle={{ fontSize: 13, fill: t.inkSoft }}
          lineStyle={{
            stroke: THRESHOLD_COLOR,
            strokeDasharray: "6 4",
            strokeWidth: 1.5,
          }}
        />
        <ChartsReferenceLine
          x={FC_THRESHOLD}
          label="FC = 2"
          labelStyle={{ fontSize: 13, fill: t.inkSoft }}
          lineStyle={{
            stroke: THRESHOLD_COLOR,
            strokeDasharray: "6 4",
            strokeWidth: 1.5,
          }}
        />
        <ChartsReferenceLine
          x={-FC_THRESHOLD}
          label="FC = -2"
          labelStyle={{ fontSize: 13, fill: t.inkSoft }}
          lineStyle={{
            stroke: THRESHOLD_COLOR,
            strokeDasharray: "6 4",
            strokeWidth: 1.5,
          }}
        />
      </ScatterChart>
    </div>
  );
}
Runnable source as JSON, for any HTTP client: https://api.anyplot.ai/specs/volcano-basic/muix/code. Any spec id and library id listed in llms-full.txt fit the same URL shape; every URL below is complete and callable.
{
  "spec_id": "volcano-basic",
  "language": "javascript",
  "library": "muix",
  "page": "https://anyplot.ai/volcano-basic/javascript/muix",
  "hub": "https://anyplot.ai/volcano-basic",
  "code_json": "https://api.anyplot.ai/specs/volcano-basic/muix/code",
  "spec_json": "https://api.anyplot.ai/specs/volcano-basic",
  "render_light_png": "https://storage.googleapis.com/anyplot-images/plots/volcano-basic/javascript/muix/plot-light.png",
  "render_dark_png": "https://storage.googleapis.com/anyplot-images/plots/volcano-basic/javascript/muix/plot-dark.png",
  "interactive_light_html": "https://storage.googleapis.com/anyplot-images/plots/volcano-basic/javascript/muix/plot-light.html",
  "interactive_dark_html": "https://storage.googleapis.com/anyplot-images/plots/volcano-basic/javascript/muix/plot-dark.html",
  "quality_score": 89.0,
  "license": "MIT",
  "guide": "https://anyplot.ai/llms.txt"
}
Part of Volcano Plot for Statistical Significance on anyplot.ai.