The same plot in 14 other libraries — Python: Altair, Bokeh, lets-plot, Matplotlib, Plotly, plotnine, Pygal, Seaborn; Julia: Makie.jl; JavaScript: Chart.js, D3.js, Apache ECharts, Highcharts, MUI X Charts. Compare all 15 side by side: Volcano Plot for Statistical Significance in Python, R, Julia and JavaScript.
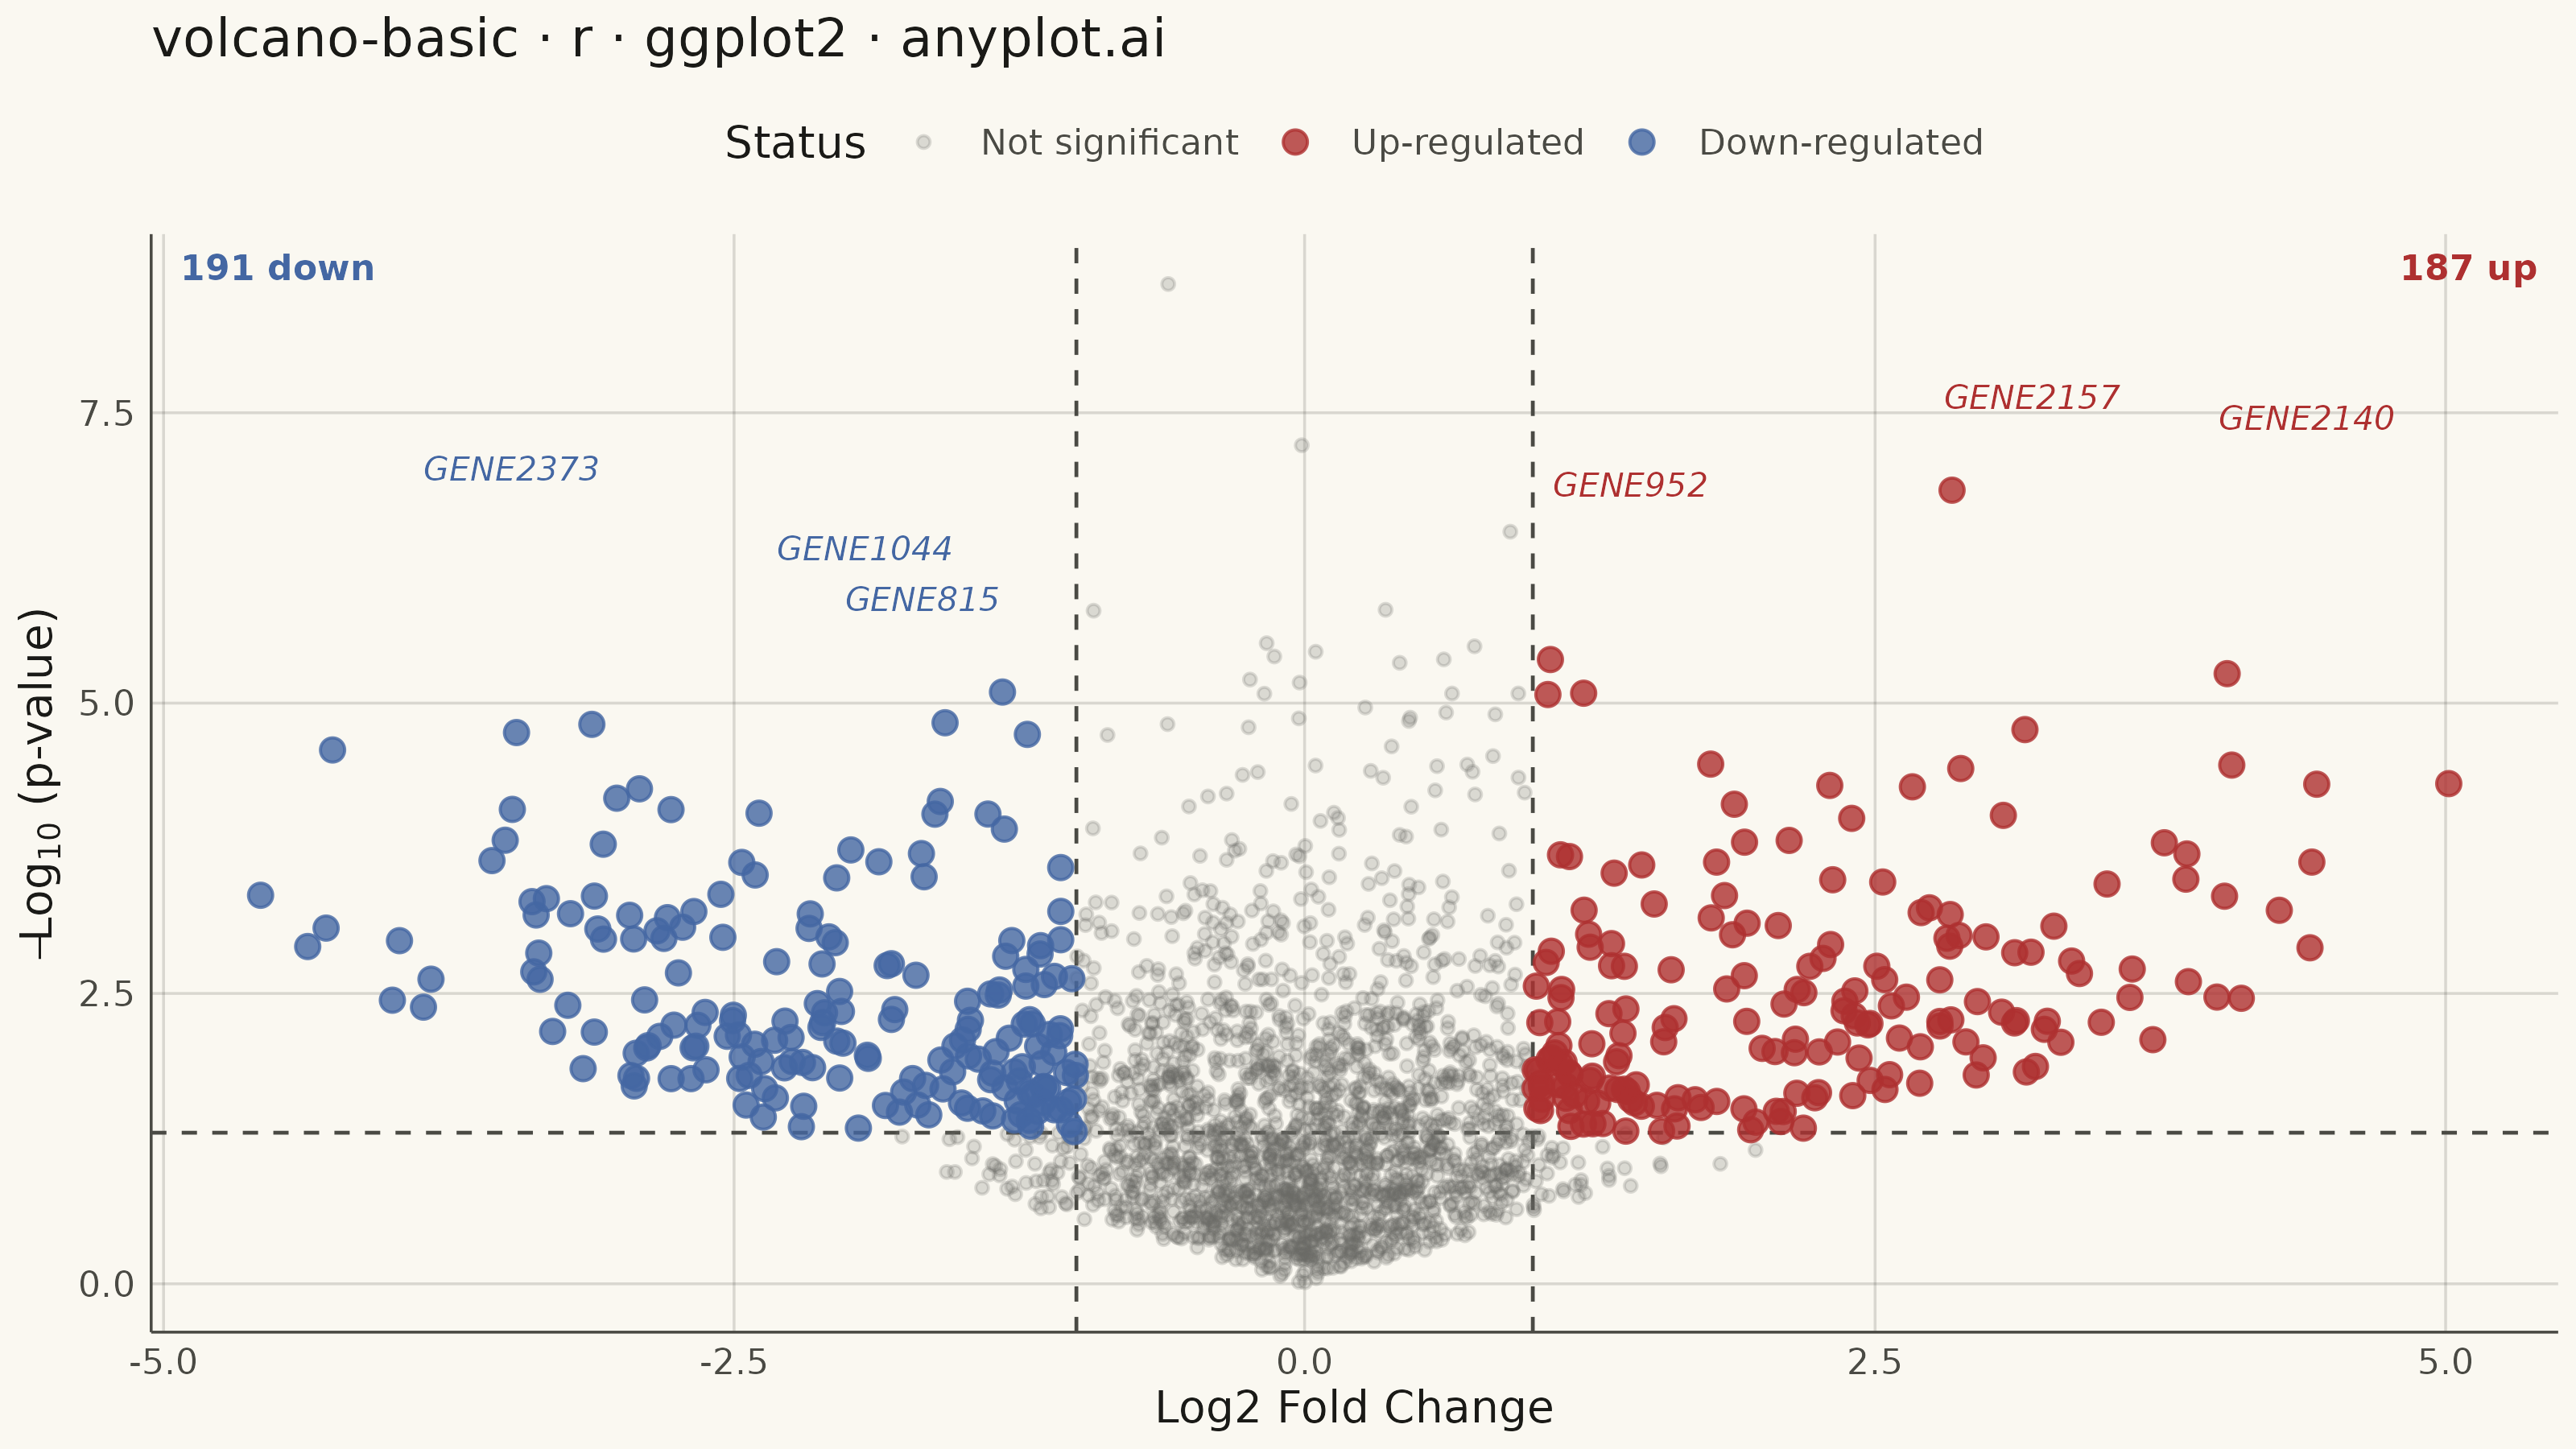
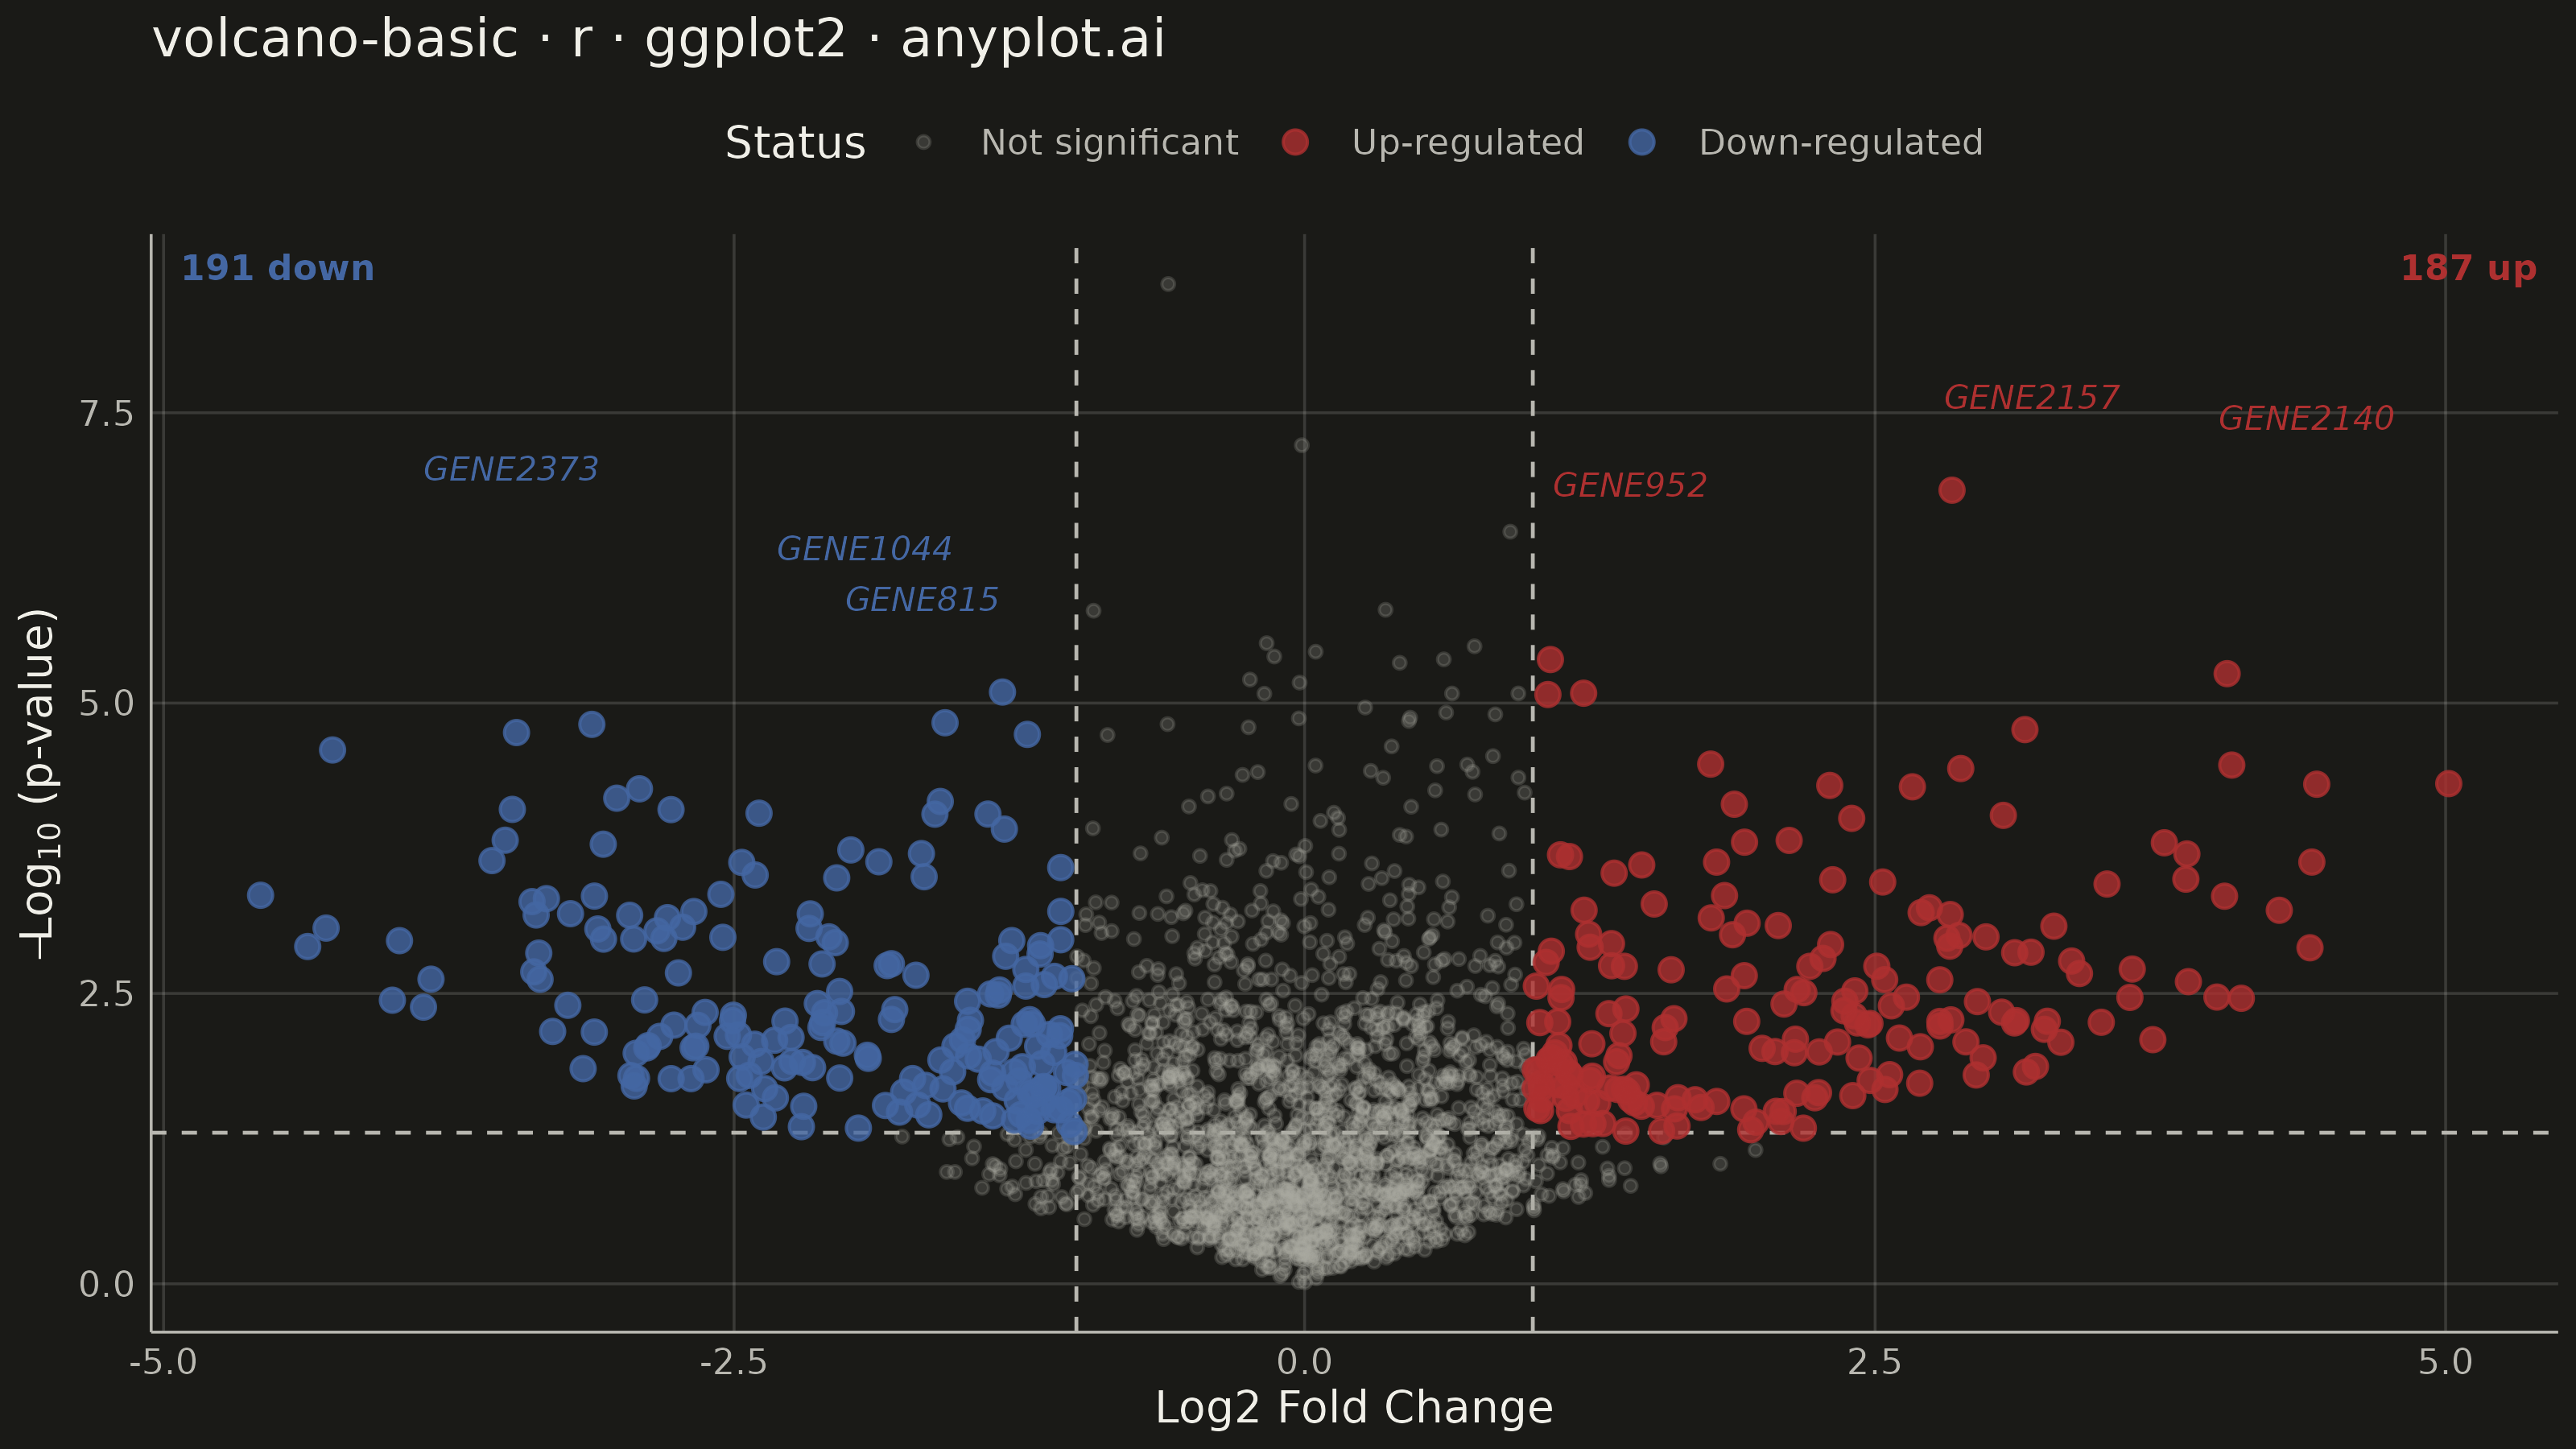
A volcano plot displays statistical significance (-log10 p-value) on the y-axis versus effect size (log2 fold change) on the x-axis. Points are typically color-coded to highlight features that are both statistically significant and have large effect sizes. This visualization is essential for quickly identifying the most important changes in differential expression, proteomics, and genomics studies.
#' anyplot.ai
#' volcano-basic: Volcano Plot for Statistical Significance
#' Library: ggplot2 3.5.1 | R 4.4.1
#' Quality: 89/100 | Created: 2026-09-09

library(ggplot2)
library(dplyr)
library(ragg)
library(scales)

set.seed(42)

# --- Theme tokens -----------------------------------------------------------
THEME       <- Sys.getenv("ANYPLOT_THEME", "light")
PAGE_BG     <- if (THEME == "light") "#FAF8F1" else "#1A1A17"
INK         <- if (THEME == "light") "#1A1A17" else "#F0EFE8"
INK_SOFT    <- if (THEME == "light") "#4A4A44" else "#B8B7B0"
INK_MUTED   <- if (THEME == "light") "#6B6A63" else "#A8A79F"
IMPRINT_UP   <- "#AE3030"  # Imprint semantic anchor for bad/loss/error — up-regulated
IMPRINT_DOWN <- "#4467A3"  # Imprint blue — down-regulated
IMPRINT_NS   <- INK_MUTED  # Imprint muted anchor — not significant

# --- Data ---------------------------------------------------------------
# Simulated differential gene expression results (RNA-seq treatment vs control)
n_genes <- 2400

log2_fold_change <- c(
  rnorm(n_genes * 0.88, mean = 0, sd = 0.6),
  rnorm(n_genes * 0.06, mean = 2.4, sd = 0.9),
  rnorm(n_genes * 0.06, mean = -2.4, sd = 0.9)
)
n_total <- length(log2_fold_change)

neg_log10_pvalue <- pmax(
  0,
  0.55 * abs(log2_fold_change) + rgamma(n_total, shape = 1.6, rate = 1.4)
)

genes <- data.frame(
  gene             = paste0("GENE", seq_len(n_total)),
  log2_fold_change = log2_fold_change,
  neg_log10_pvalue = neg_log10_pvalue
)

fc_cutoff <- 1
sig_cutoff <- -log10(0.05)

genes <- genes %>%
  mutate(
    status = case_when(
      neg_log10_pvalue >= sig_cutoff & log2_fold_change >= fc_cutoff  ~ "Up-regulated",
      neg_log10_pvalue >= sig_cutoff & log2_fold_change <= -fc_cutoff ~ "Down-regulated",
      TRUE                                                            ~ "Not significant"
    ),
    status = factor(status, levels = c("Not significant", "Up-regulated", "Down-regulated"))
  )

# --- Plot -----------------------------------------------------------------
title_text <- "volcano-basic · r · ggplot2 · anyplot.ai"

# ggrepel is not installed in the CI R environment (see .github/actions/setup-r),
# so the top-hit gene labels below use a manual rank-based x/y nudge fan-out
# instead of geom_text_repel() collision avoidance.
top_labels <- genes %>%
  filter(status != "Not significant") %>%
  group_by(status) %>%
  slice_max(order_by = neg_log10_pvalue, n = 3) %>%
  arrange(status, desc(neg_log10_pvalue)) %>%
  mutate(
    rank_in_group = row_number(),
    label_x = log2_fold_change + if_else(log2_fold_change > 0, 0.35, -0.35),
    label_y = neg_log10_pvalue + 0.7 * rank_in_group
  ) %>%
  ungroup()

n_up   <- sum(genes$status == "Up-regulated")
n_down <- sum(genes$status == "Down-regulated")

p <- ggplot(genes, aes(x = log2_fold_change, y = neg_log10_pvalue, color = status)) +
  geom_vline(xintercept = c(-fc_cutoff, fc_cutoff), color = INK_SOFT,
             linewidth = 0.4, linetype = "dashed") +
  geom_hline(yintercept = sig_cutoff, color = INK_SOFT,
             linewidth = 0.4, linetype = "dashed") +
  geom_point(data = filter(genes, status == "Not significant"),
             size = 1.0, alpha = 0.22) +
  geom_point(data = filter(genes, status != "Not significant"),
             size = 2.2, alpha = 0.8) +
  geom_text(
    data = top_labels,
    aes(label = gene, x = label_x, y = label_y),
    hjust = 0.5,
    vjust = 0,
    size = 2.6,
    fontface = "italic",
    show.legend = FALSE
  ) +
  annotate("text", x = Inf, y = Inf, label = paste0(n_up, " up"),
           hjust = 1.15, vjust = 1.8, size = 2.8, fontface = "bold",
           color = IMPRINT_UP) +
  annotate("text", x = -Inf, y = Inf, label = paste0(n_down, " down"),
           hjust = -0.15, vjust = 1.8, size = 2.8, fontface = "bold",
           color = IMPRINT_DOWN) +
  scale_color_manual(
    values = c(
      "Not significant" = IMPRINT_NS,
      "Up-regulated"     = IMPRINT_UP,
      "Down-regulated"   = IMPRINT_DOWN
    ),
    name = "Status"
  ) +
  labs(
    title = title_text,
    x = "Log2 Fold Change",
    y = expression(-Log[10] * " (p-value)")
  ) +
  theme_minimal(base_size = 8) +
  theme(
    plot.background   = element_rect(fill = PAGE_BG, color = PAGE_BG),
    panel.background  = element_rect(fill = PAGE_BG, color = NA),
    panel.grid.major  = element_line(color = alpha(INK, 0.15), linewidth = 0.3),
    panel.grid.minor  = element_blank(),
    axis.title        = element_text(color = INK, size = 10),
    axis.text         = element_text(color = INK_SOFT, size = 8),
    axis.ticks        = element_blank(),
    axis.line         = element_line(color = INK_SOFT, linewidth = 0.3),
    plot.title        = element_text(color = INK, size = 12),
    legend.position   = "top",
    legend.text       = element_text(color = INK_SOFT, size = 8),
    legend.title      = element_text(color = INK, size = 10),
    legend.background = element_blank(),
    legend.key        = element_blank()
  )

# --- Save -------------------------------------------------------------------
ggsave(
  filename = sprintf("plot-%s.png", THEME),
  plot     = p,
  device   = ragg::agg_png,
  width    = 8,
  height   = 4.5,
  units    = "in",
  dpi      = 400
)
Runnable source as JSON, for any HTTP client: https://api.anyplot.ai/specs/volcano-basic/ggplot2/code. Any spec id and library id listed in llms-full.txt fit the same URL shape; every URL below is complete and callable.
{
  "spec_id": "volcano-basic",
  "language": "r",
  "library": "ggplot2",
  "page": "https://anyplot.ai/volcano-basic/r/ggplot2",
  "hub": "https://anyplot.ai/volcano-basic",
  "code_json": "https://api.anyplot.ai/specs/volcano-basic/ggplot2/code",
  "spec_json": "https://api.anyplot.ai/specs/volcano-basic",
  "render_light_png": "https://storage.googleapis.com/anyplot-images/plots/volcano-basic/r/ggplot2/plot-light.png",
  "render_dark_png": "https://storage.googleapis.com/anyplot-images/plots/volcano-basic/r/ggplot2/plot-dark.png",
  "quality_score": 89.0,
  "license": "MIT",
  "guide": "https://anyplot.ai/llms.txt"
}
Part of Volcano Plot for Statistical Significance on anyplot.ai.