The same plot in 14 other libraries — JavaScript: D3.js, Apache ECharts, Highcharts, MUI X Charts; Python: Altair, Bokeh, lets-plot, Matplotlib, Plotly, plotnine, Pygal, Seaborn; R: ggplot2; Julia: Makie.jl. Compare all 15 side by side: Basic Waffle Chart in Python, R, Julia and JavaScript.
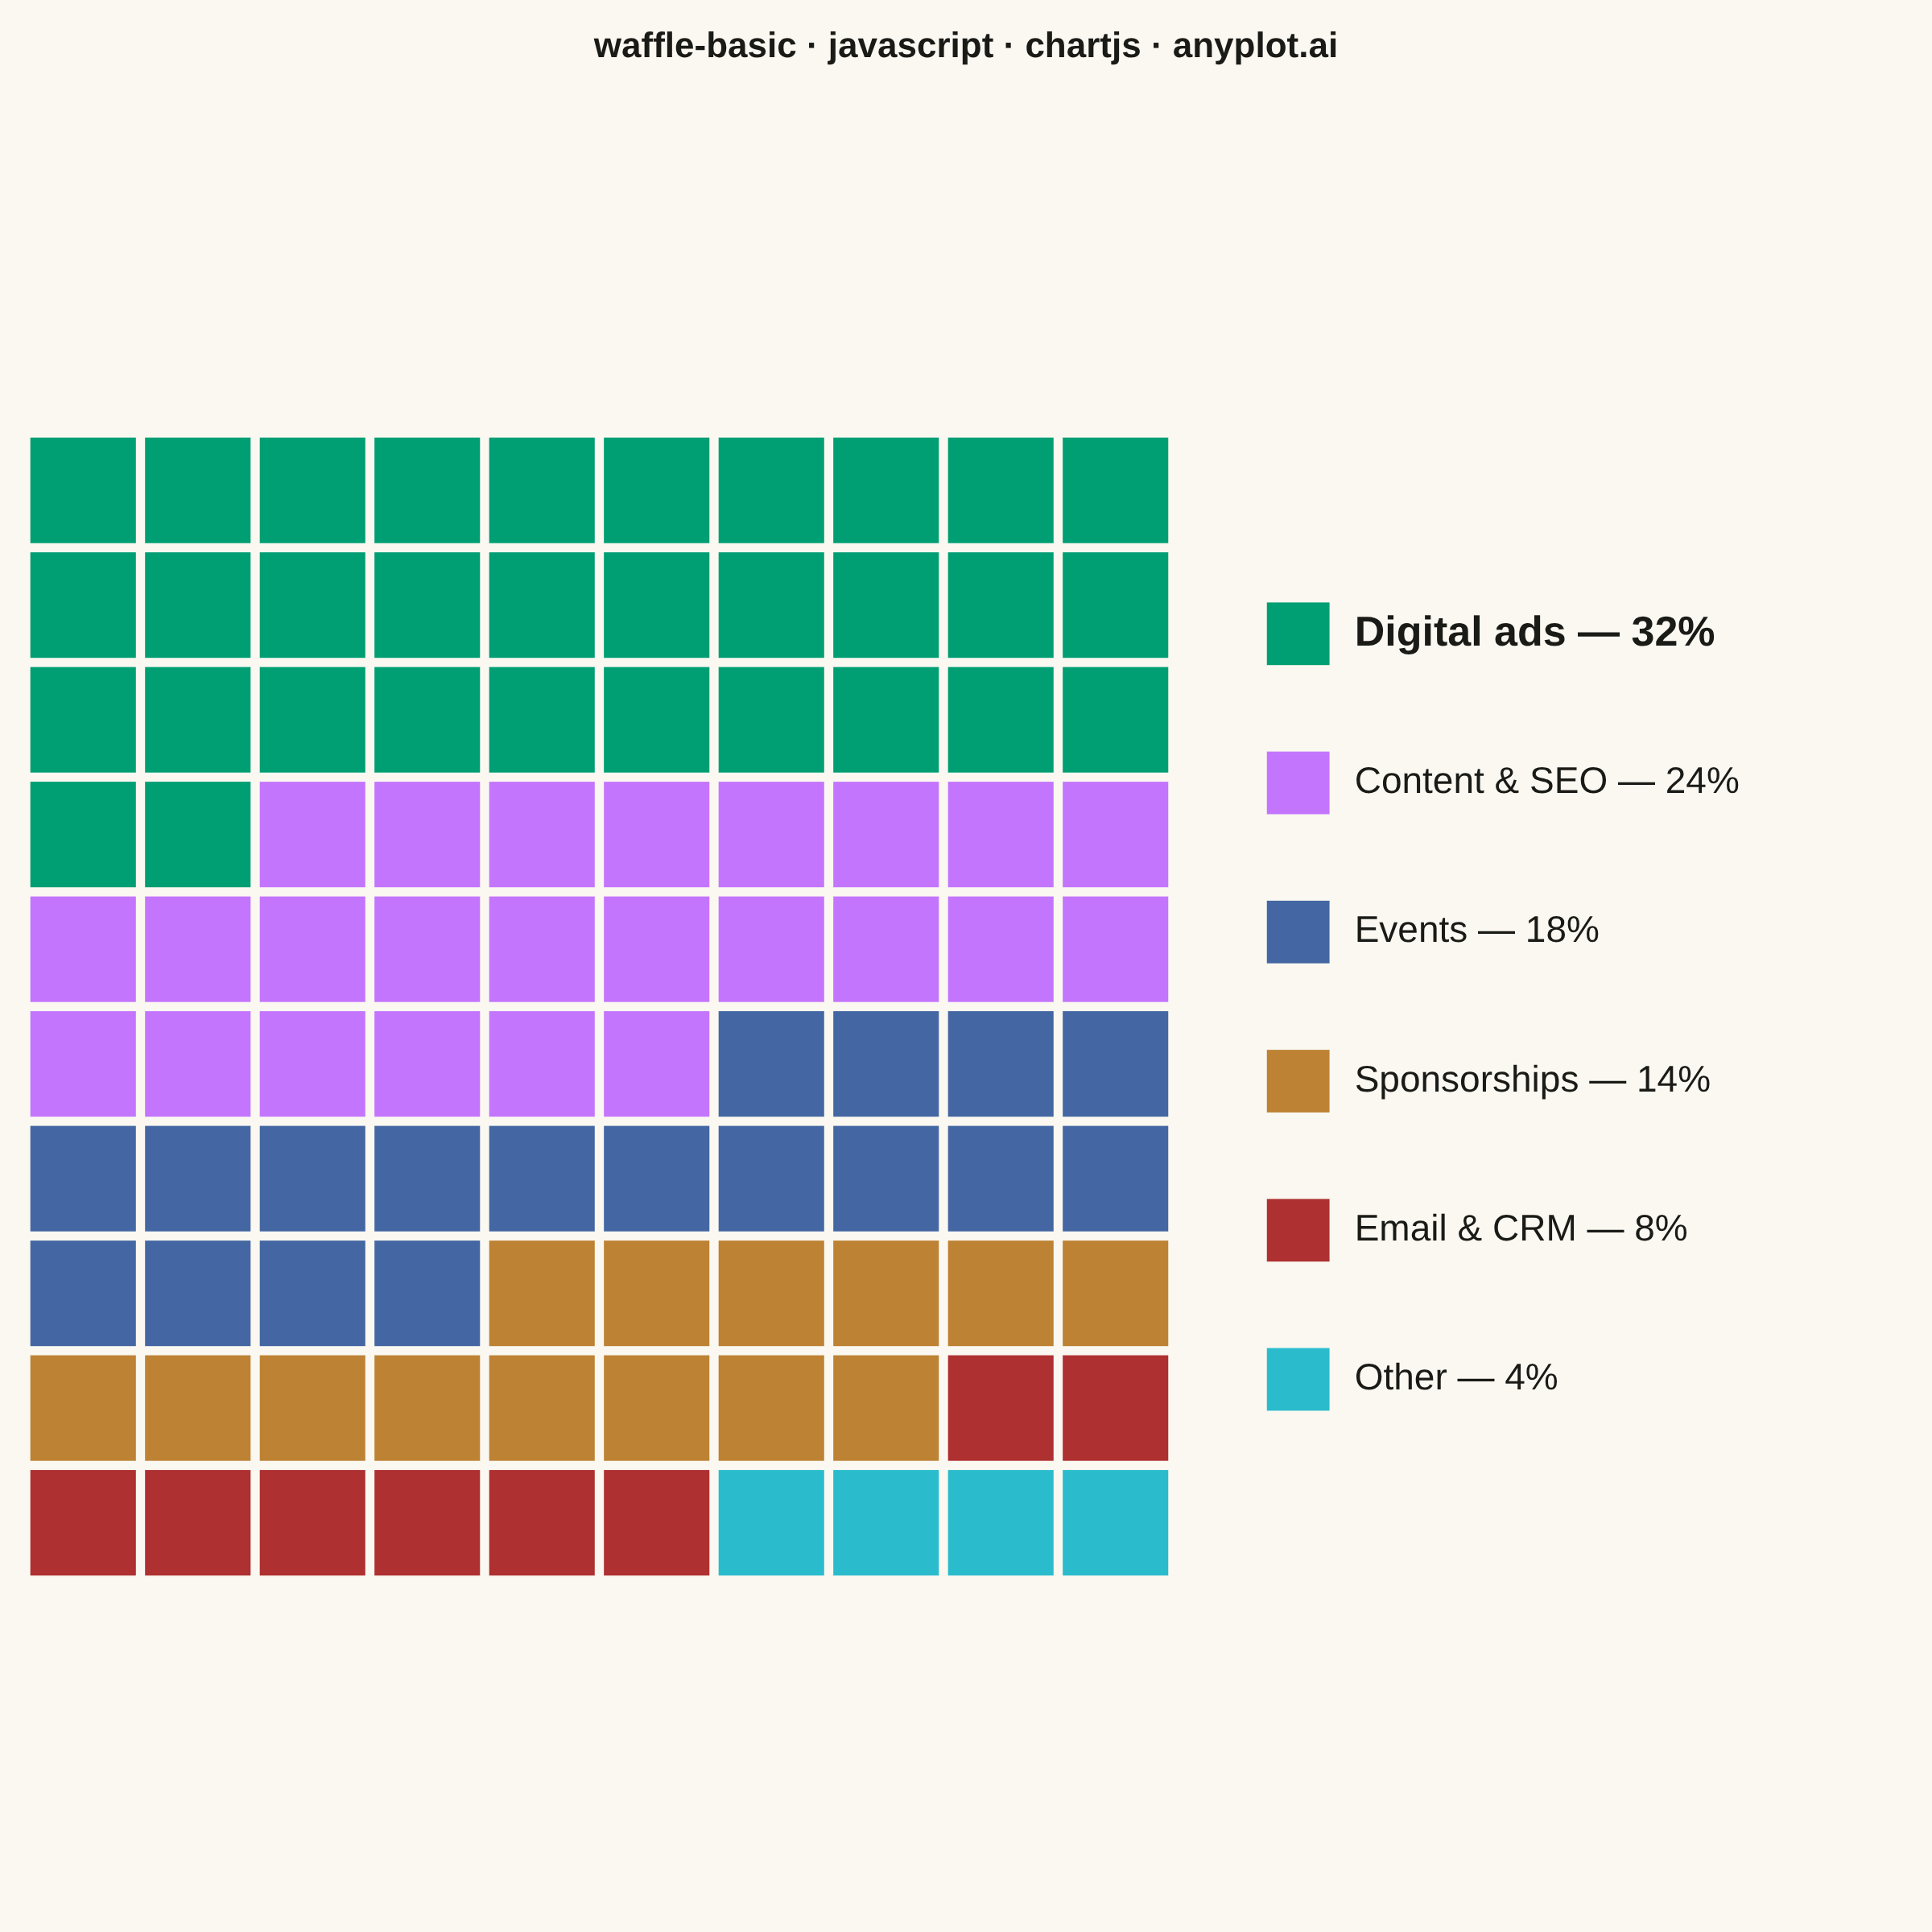
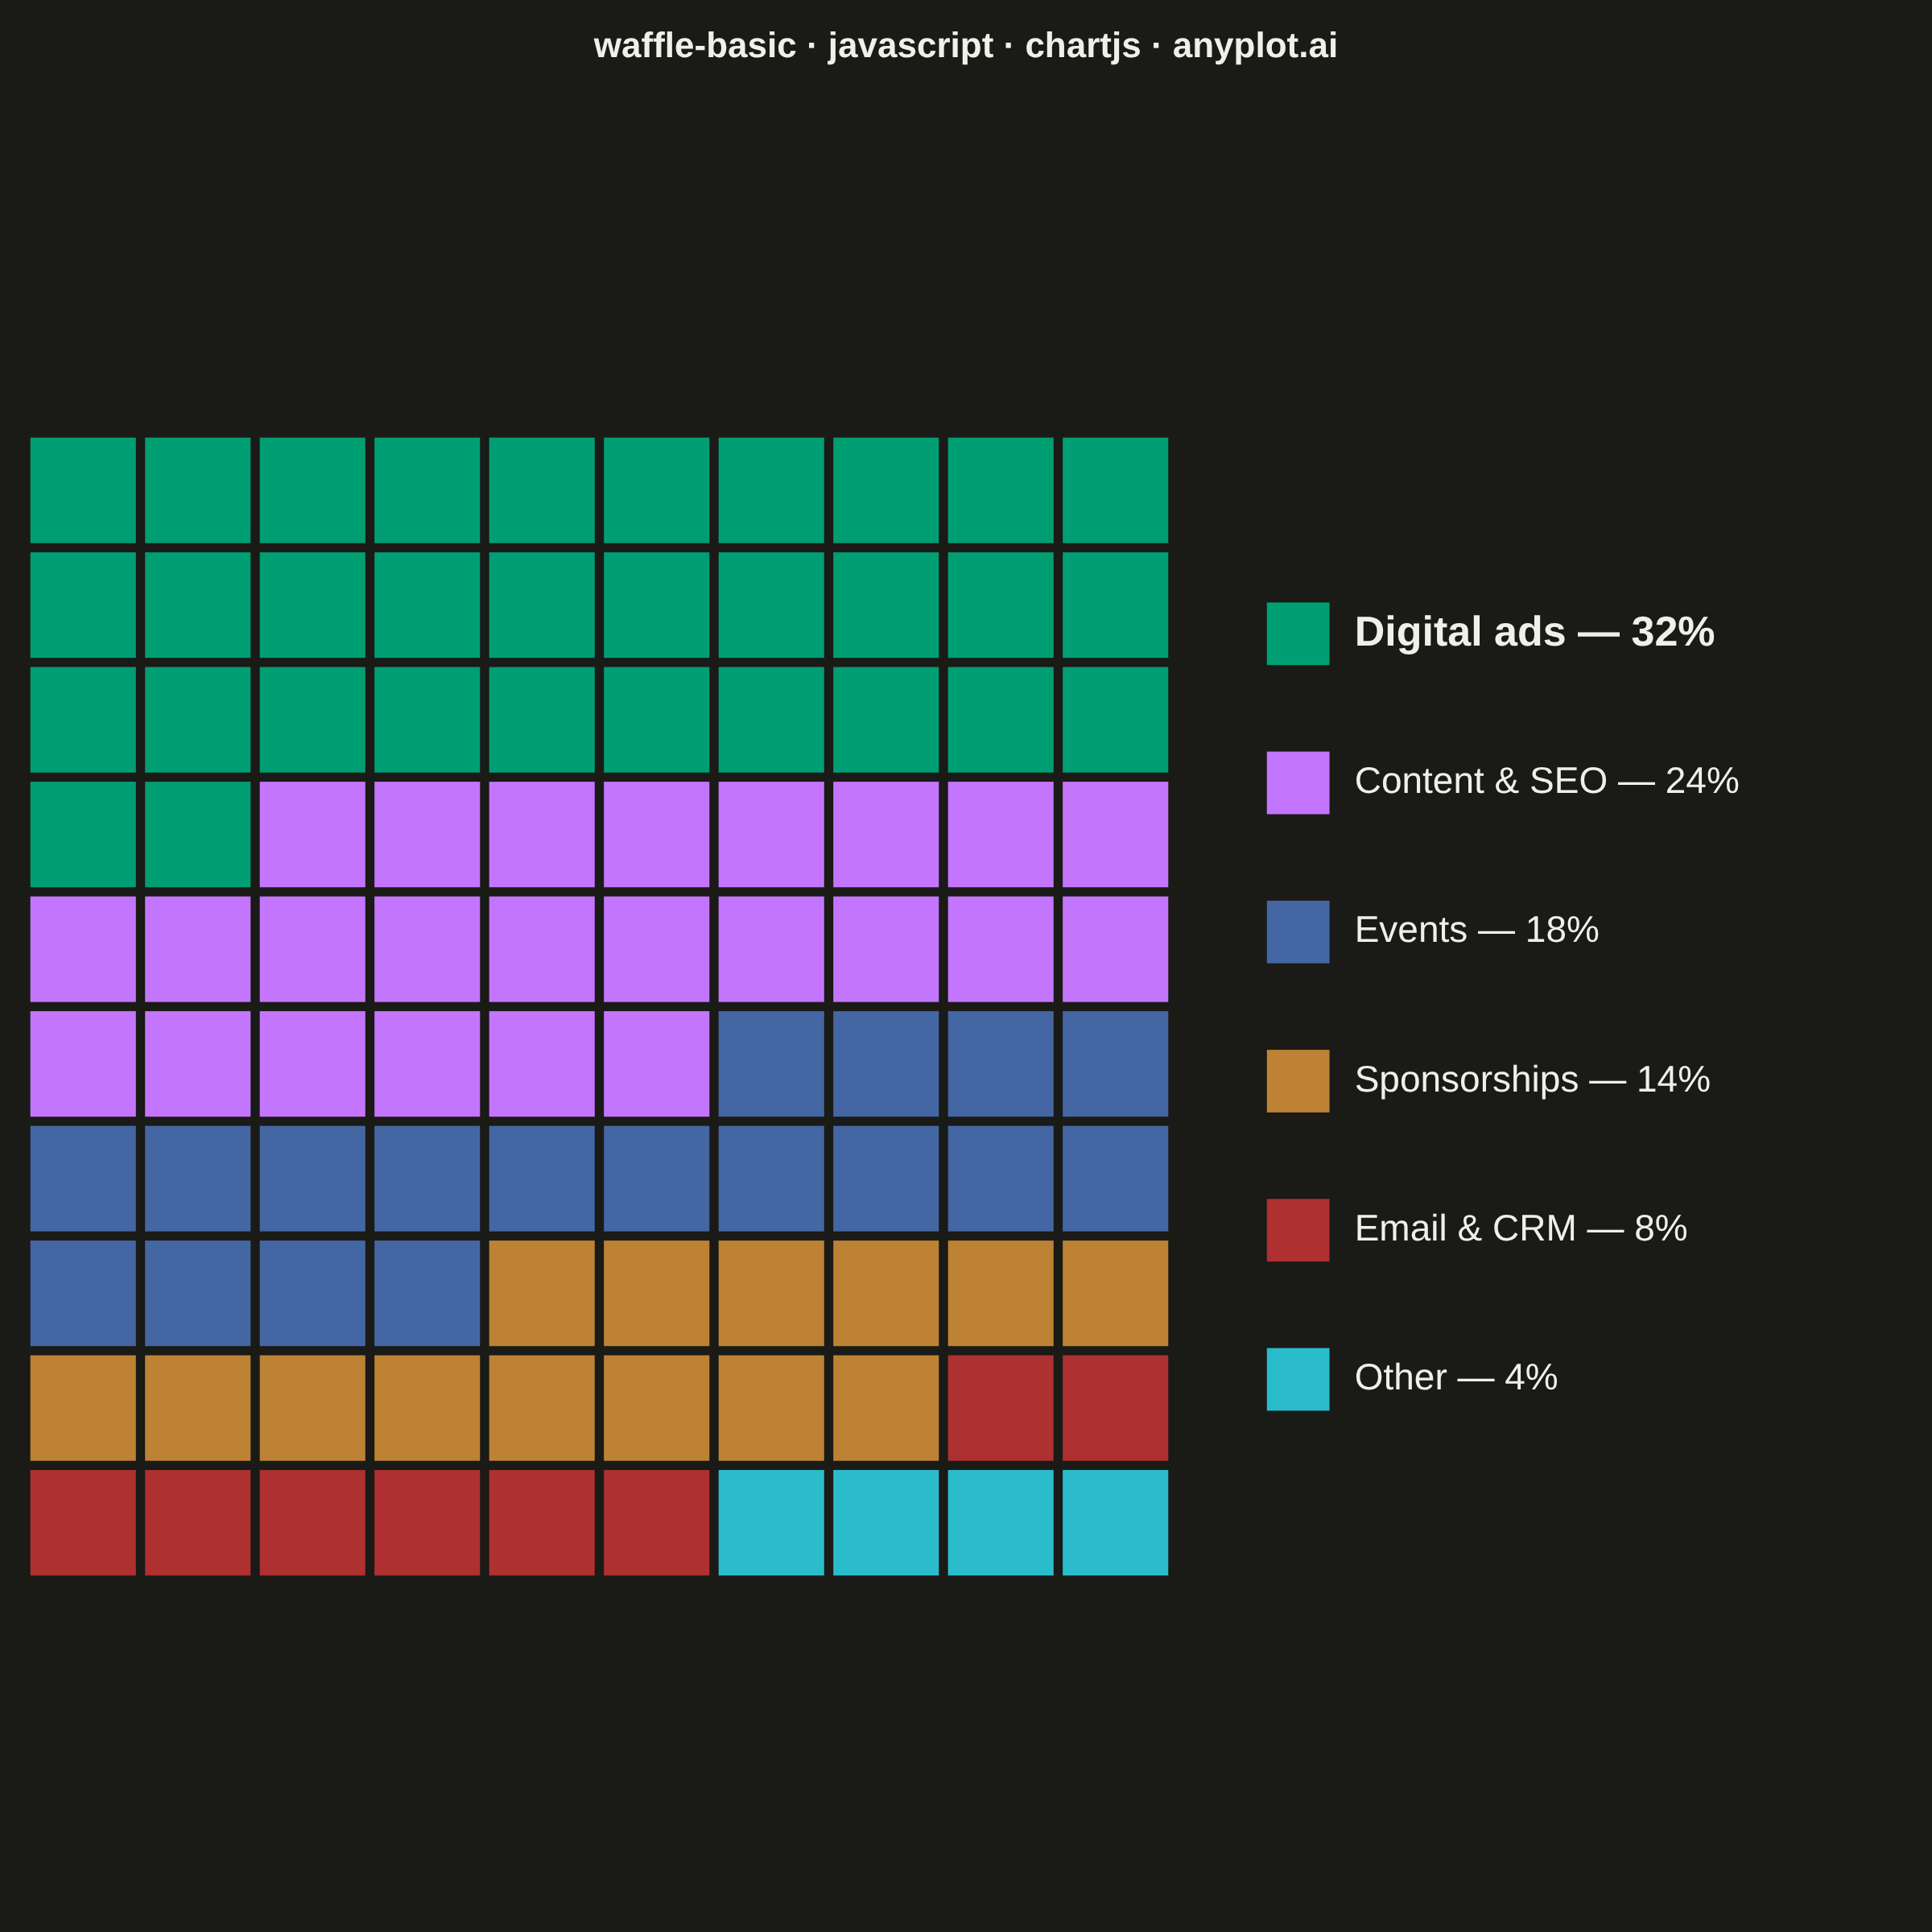
A waffle chart displays proportions using a grid of equal-sized squares where colored squares represent parts of a whole. Each square typically represents 1% of the total, making it easy to count and compare values visually. It provides an intuitive alternative to pie charts, offering more accurate perception of proportions.
// anyplot.ai
// waffle-basic: Basic Waffle Chart
// Library: chartjs 4.4.7 | JavaScript 22.23.2
// Quality: 85/100 | Created: 2026-09-09

//# anyplot-orientation: square

// Chart.js has no native waffle/matrix chart type (chartjs-chart-matrix is an
// unpinned community plugin and out of scope). We draw the 10x10 grid and its
// legend ourselves in a plugin's `afterDraw` hook, anchored to `chart.chartArea`
// so the built-in title plugin still reserves its own space above the grid.

const t = window.ANYPLOT_TOKENS;

// --- Data (in-memory, deterministic) — quarterly marketing budget, % of total
const categories = [
  { label: "Digital ads", value: 32 },
  { label: "Content & SEO", value: 24 },
  { label: "Events", value: 18 },
  { label: "Sponsorships", value: 14 },
  { label: "Email & CRM", value: 8 },
  { label: "Other", value: 4 },
];
// Values sum to 100 -> one square per percentage point, no rounding drift.
categories.forEach((c, i) => {
  c.color = t.palette[i % t.palette.length];
});

const GRID_SIDE = 10; // 10x10 = 100 squares, each worth 1%
const cells = categories.flatMap((c, i) => Array(c.value).fill(i));

// --- Mount -------------------------------------------------------------------
const canvas = document.createElement("canvas");
document.getElementById("container").appendChild(canvas);

// --- Waffle grid + legend plugin ---------------------------------------------
const wafflePlugin = {
  id: "wafflePlugin",
  afterDraw(chart) {
    const { ctx, chartArea } = chart;
    const areaW = chartArea.right - chartArea.left;
    const areaH = chartArea.bottom - chartArea.top;

    const legendW = Math.min(areaW * 0.34, 460);
    const gutter = areaW * 0.05;
    const gridBoxW = areaW - legendW - gutter;
    const gridSize = Math.min(gridBoxW, areaH);
    const cell = gridSize / GRID_SIDE;
    const gap = cell * 0.08;

    const gridLeft = chartArea.left + (gridBoxW - gridSize) / 2;
    const gridTop = chartArea.top + (areaH - gridSize) / 2;

    ctx.save();
    cells.forEach((catIdx, i) => {
      const row = Math.floor(i / GRID_SIDE);
      const col = i % GRID_SIDE;
      const x = gridLeft + col * cell;
      const y = gridTop + row * cell;
      ctx.fillStyle = categories[catIdx].color;
      ctx.fillRect(x + gap / 2, y + gap / 2, cell - gap, cell - gap);
    });

    // --- Legend: swatch + label + percentage, vertically centered ------------
    const legendX = gridLeft + gridSize + gutter;
    const rowH = Math.min(areaH / categories.length, cell * 1.3);
    const legendH = rowH * categories.length;
    const legendTop = chartArea.top + (areaH - legendH) / 2;
    const swatch = rowH * 0.42;

    ctx.textBaseline = "middle";
    categories.forEach((c, idx) => {
      const y = legendTop + idx * rowH + rowH / 2;
      ctx.fillStyle = c.color;
      ctx.fillRect(legendX, y - swatch / 2, swatch, swatch);
      // Largest category (first, since data is sorted descending) gets a
      // heavier weight + slightly larger size to anchor the reading order.
      const isFocal = idx === 0;
      ctx.font = `${isFocal ? 700 : 500} ${Math.round(swatch * (isFocal ? 0.68 : 0.6))}px sans-serif`;
      ctx.fillStyle = t.ink;
      ctx.fillText(`${c.label} — ${c.value}%`, legendX + swatch * 1.4, y);
    });
    ctx.restore();
  },
};

// --- Chart ---------------------------------------------------------------
new Chart(canvas, {
  type: "bar",
  data: { labels: [], datasets: [] },
  plugins: [wafflePlugin],
  options: {
    responsive: true,
    maintainAspectRatio: false,
    animation: false,
    layout: { padding: 16 },
    plugins: {
      title: {
        display: true,
        text: "waffle-basic · javascript · chartjs · anyplot.ai",
        color: t.ink,
        font: { size: 22 },
        padding: { bottom: 24 },
      },
      legend: { display: false },
      tooltip: { enabled: false },
    },
    // The dummy bar-chart host would otherwise auto-generate default x/y
    // cartesian scales (even with empty labels/datasets), whose reserved
    // tick space shrinks chart.chartArea and confines the plugin's drawing
    // to the upper portion of the canvas. Hiding both scales lets
    // chartArea span the full area below the title.
    scales: {
      x: { display: false },
      y: { display: false },
    },
  },
});
Runnable source as JSON, for any HTTP client: https://api.anyplot.ai/specs/waffle-basic/chartjs/code. Any spec id and library id listed in llms-full.txt fit the same URL shape; every URL below is complete and callable.
{
  "spec_id": "waffle-basic",
  "language": "javascript",
  "library": "chartjs",
  "page": "https://anyplot.ai/waffle-basic/javascript/chartjs",
  "hub": "https://anyplot.ai/waffle-basic",
  "code_json": "https://api.anyplot.ai/specs/waffle-basic/chartjs/code",
  "spec_json": "https://api.anyplot.ai/specs/waffle-basic",
  "render_light_png": "https://storage.googleapis.com/anyplot-images/plots/waffle-basic/javascript/chartjs/plot-light.png",
  "render_dark_png": "https://storage.googleapis.com/anyplot-images/plots/waffle-basic/javascript/chartjs/plot-dark.png",
  "interactive_light_html": "https://storage.googleapis.com/anyplot-images/plots/waffle-basic/javascript/chartjs/plot-light.html",
  "interactive_dark_html": "https://storage.googleapis.com/anyplot-images/plots/waffle-basic/javascript/chartjs/plot-dark.html",
  "quality_score": 85.0,
  "license": "MIT",
  "guide": "https://anyplot.ai/llms.txt"
}
Part of Basic Waffle Chart on anyplot.ai.