The same plot in 14 other libraries — JavaScript: Chart.js, D3.js, Apache ECharts, MUI X Charts; Python: Altair, Bokeh, lets-plot, Matplotlib, Plotly, plotnine, Pygal, Seaborn; R: ggplot2; Julia: Makie.jl. Compare all 15 side by side: Basic Waffle Chart in Python, R, Julia and JavaScript.
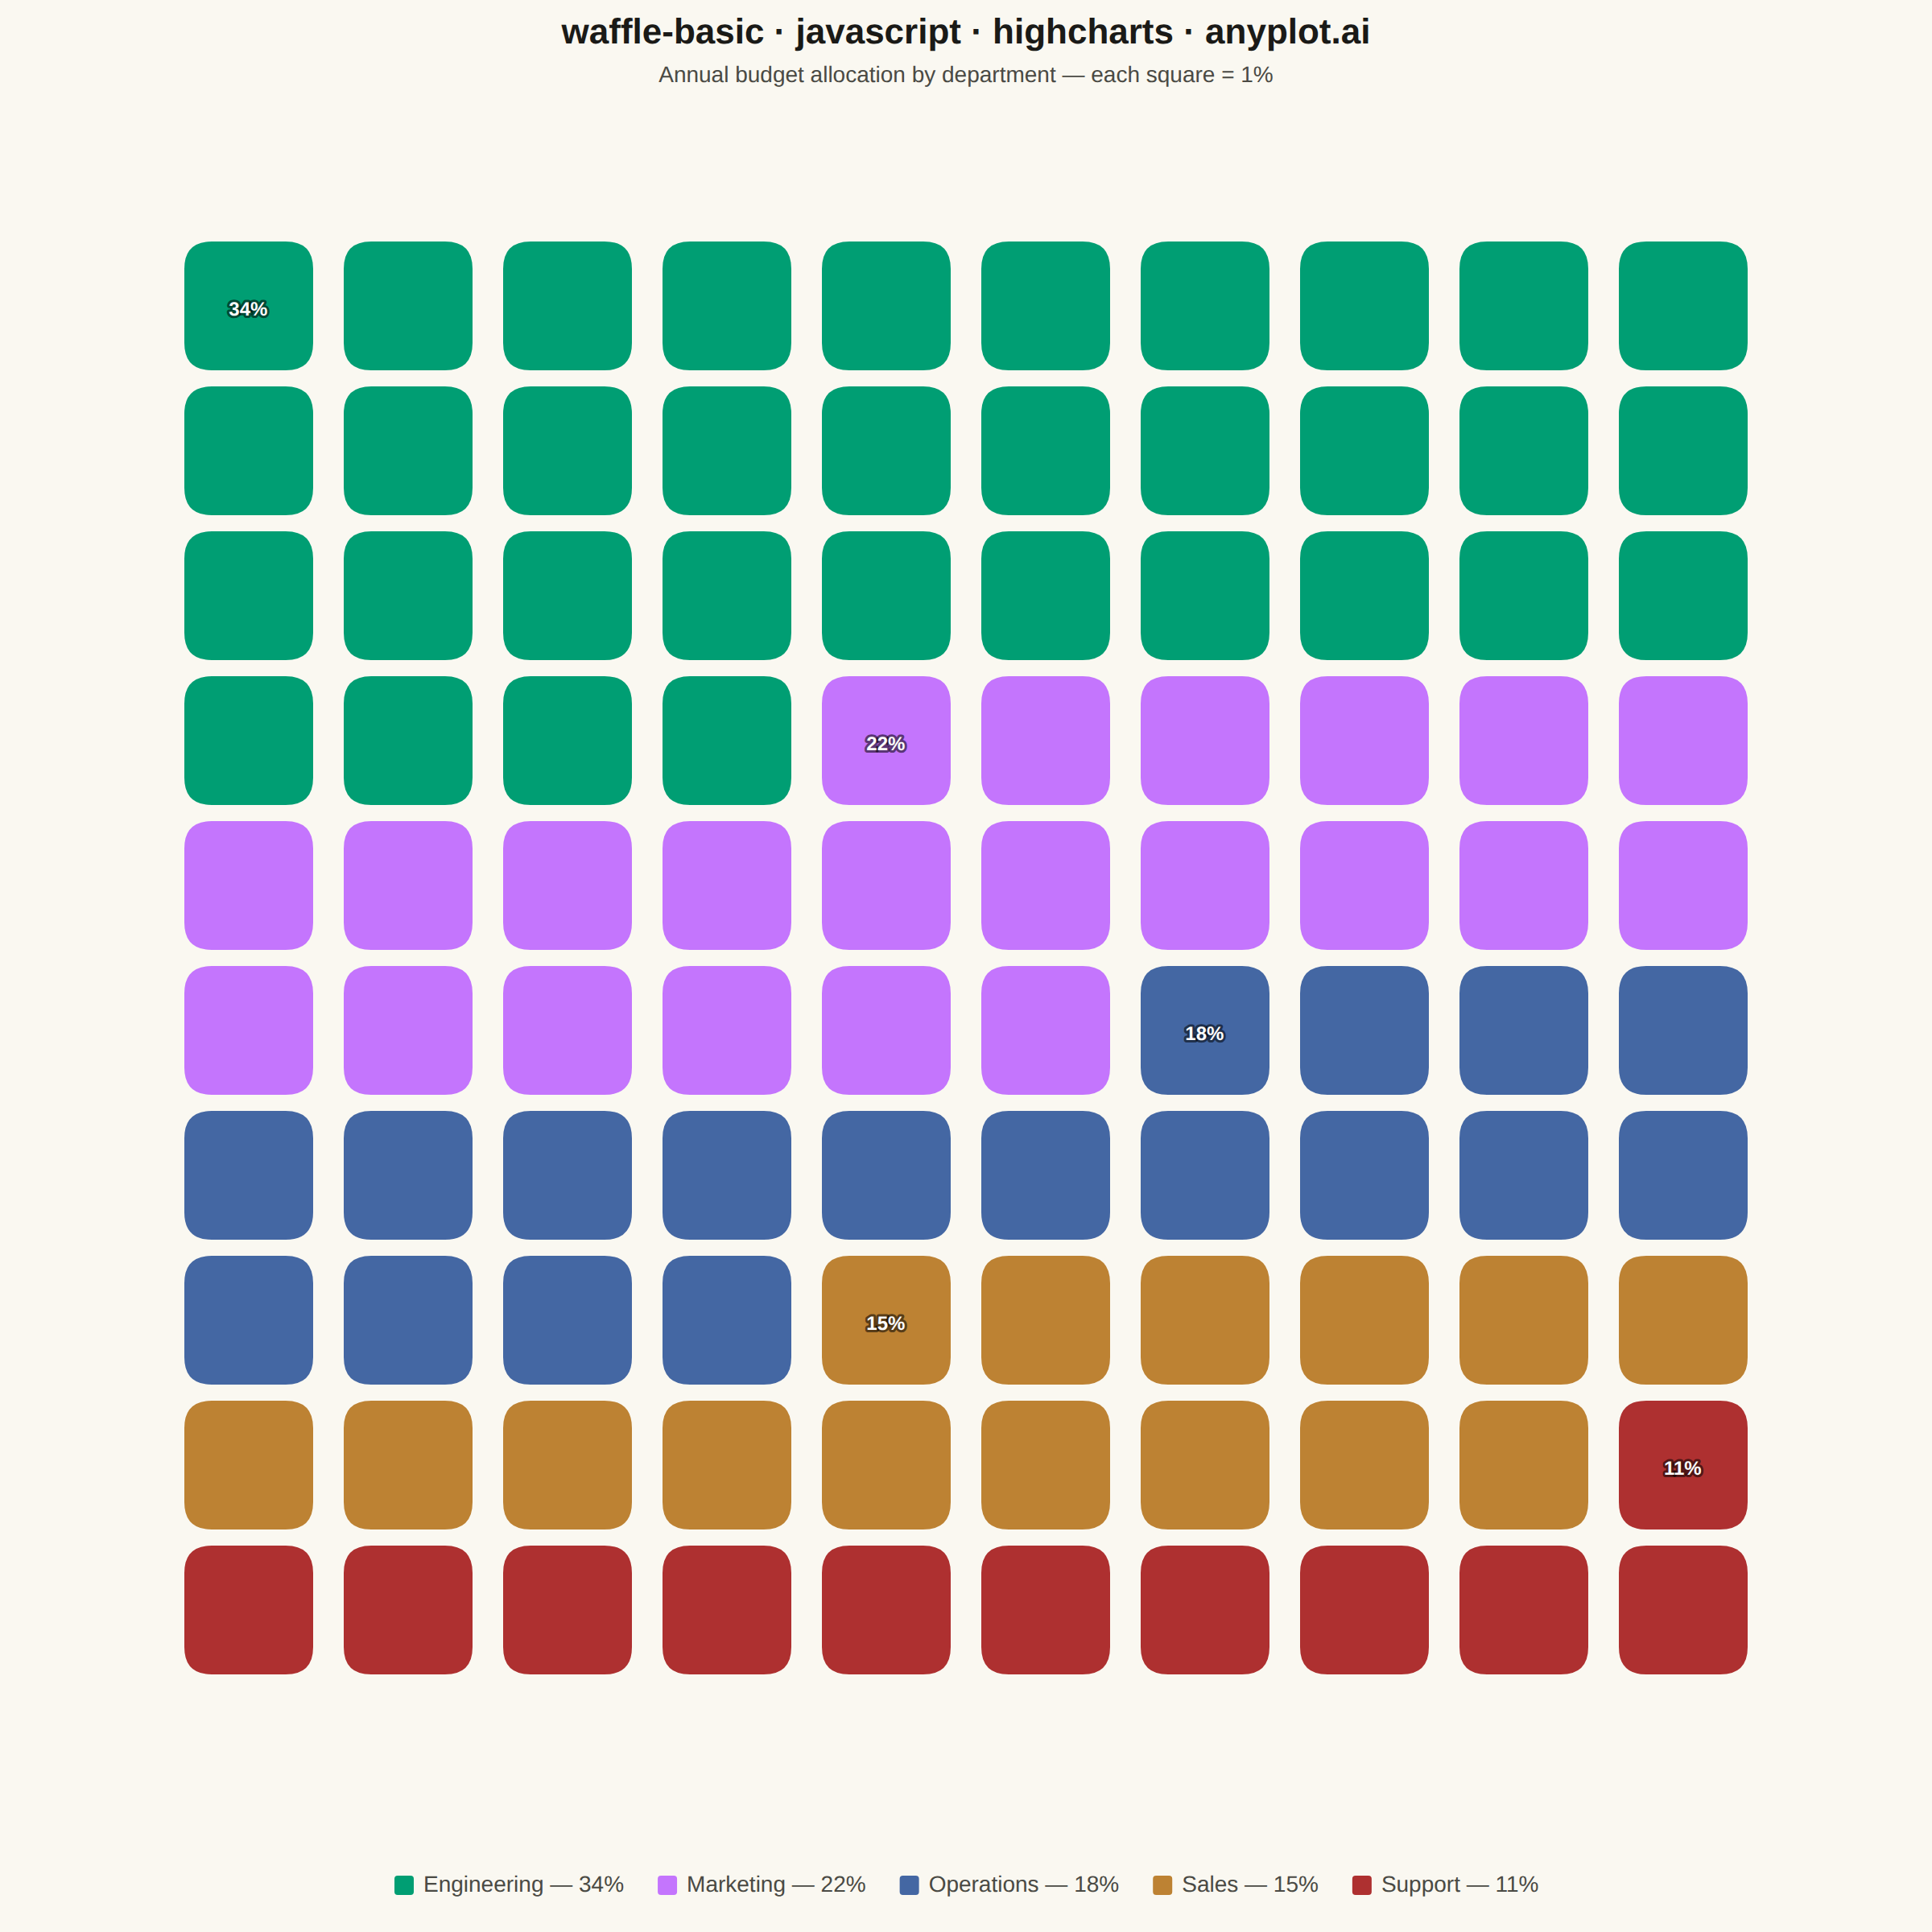
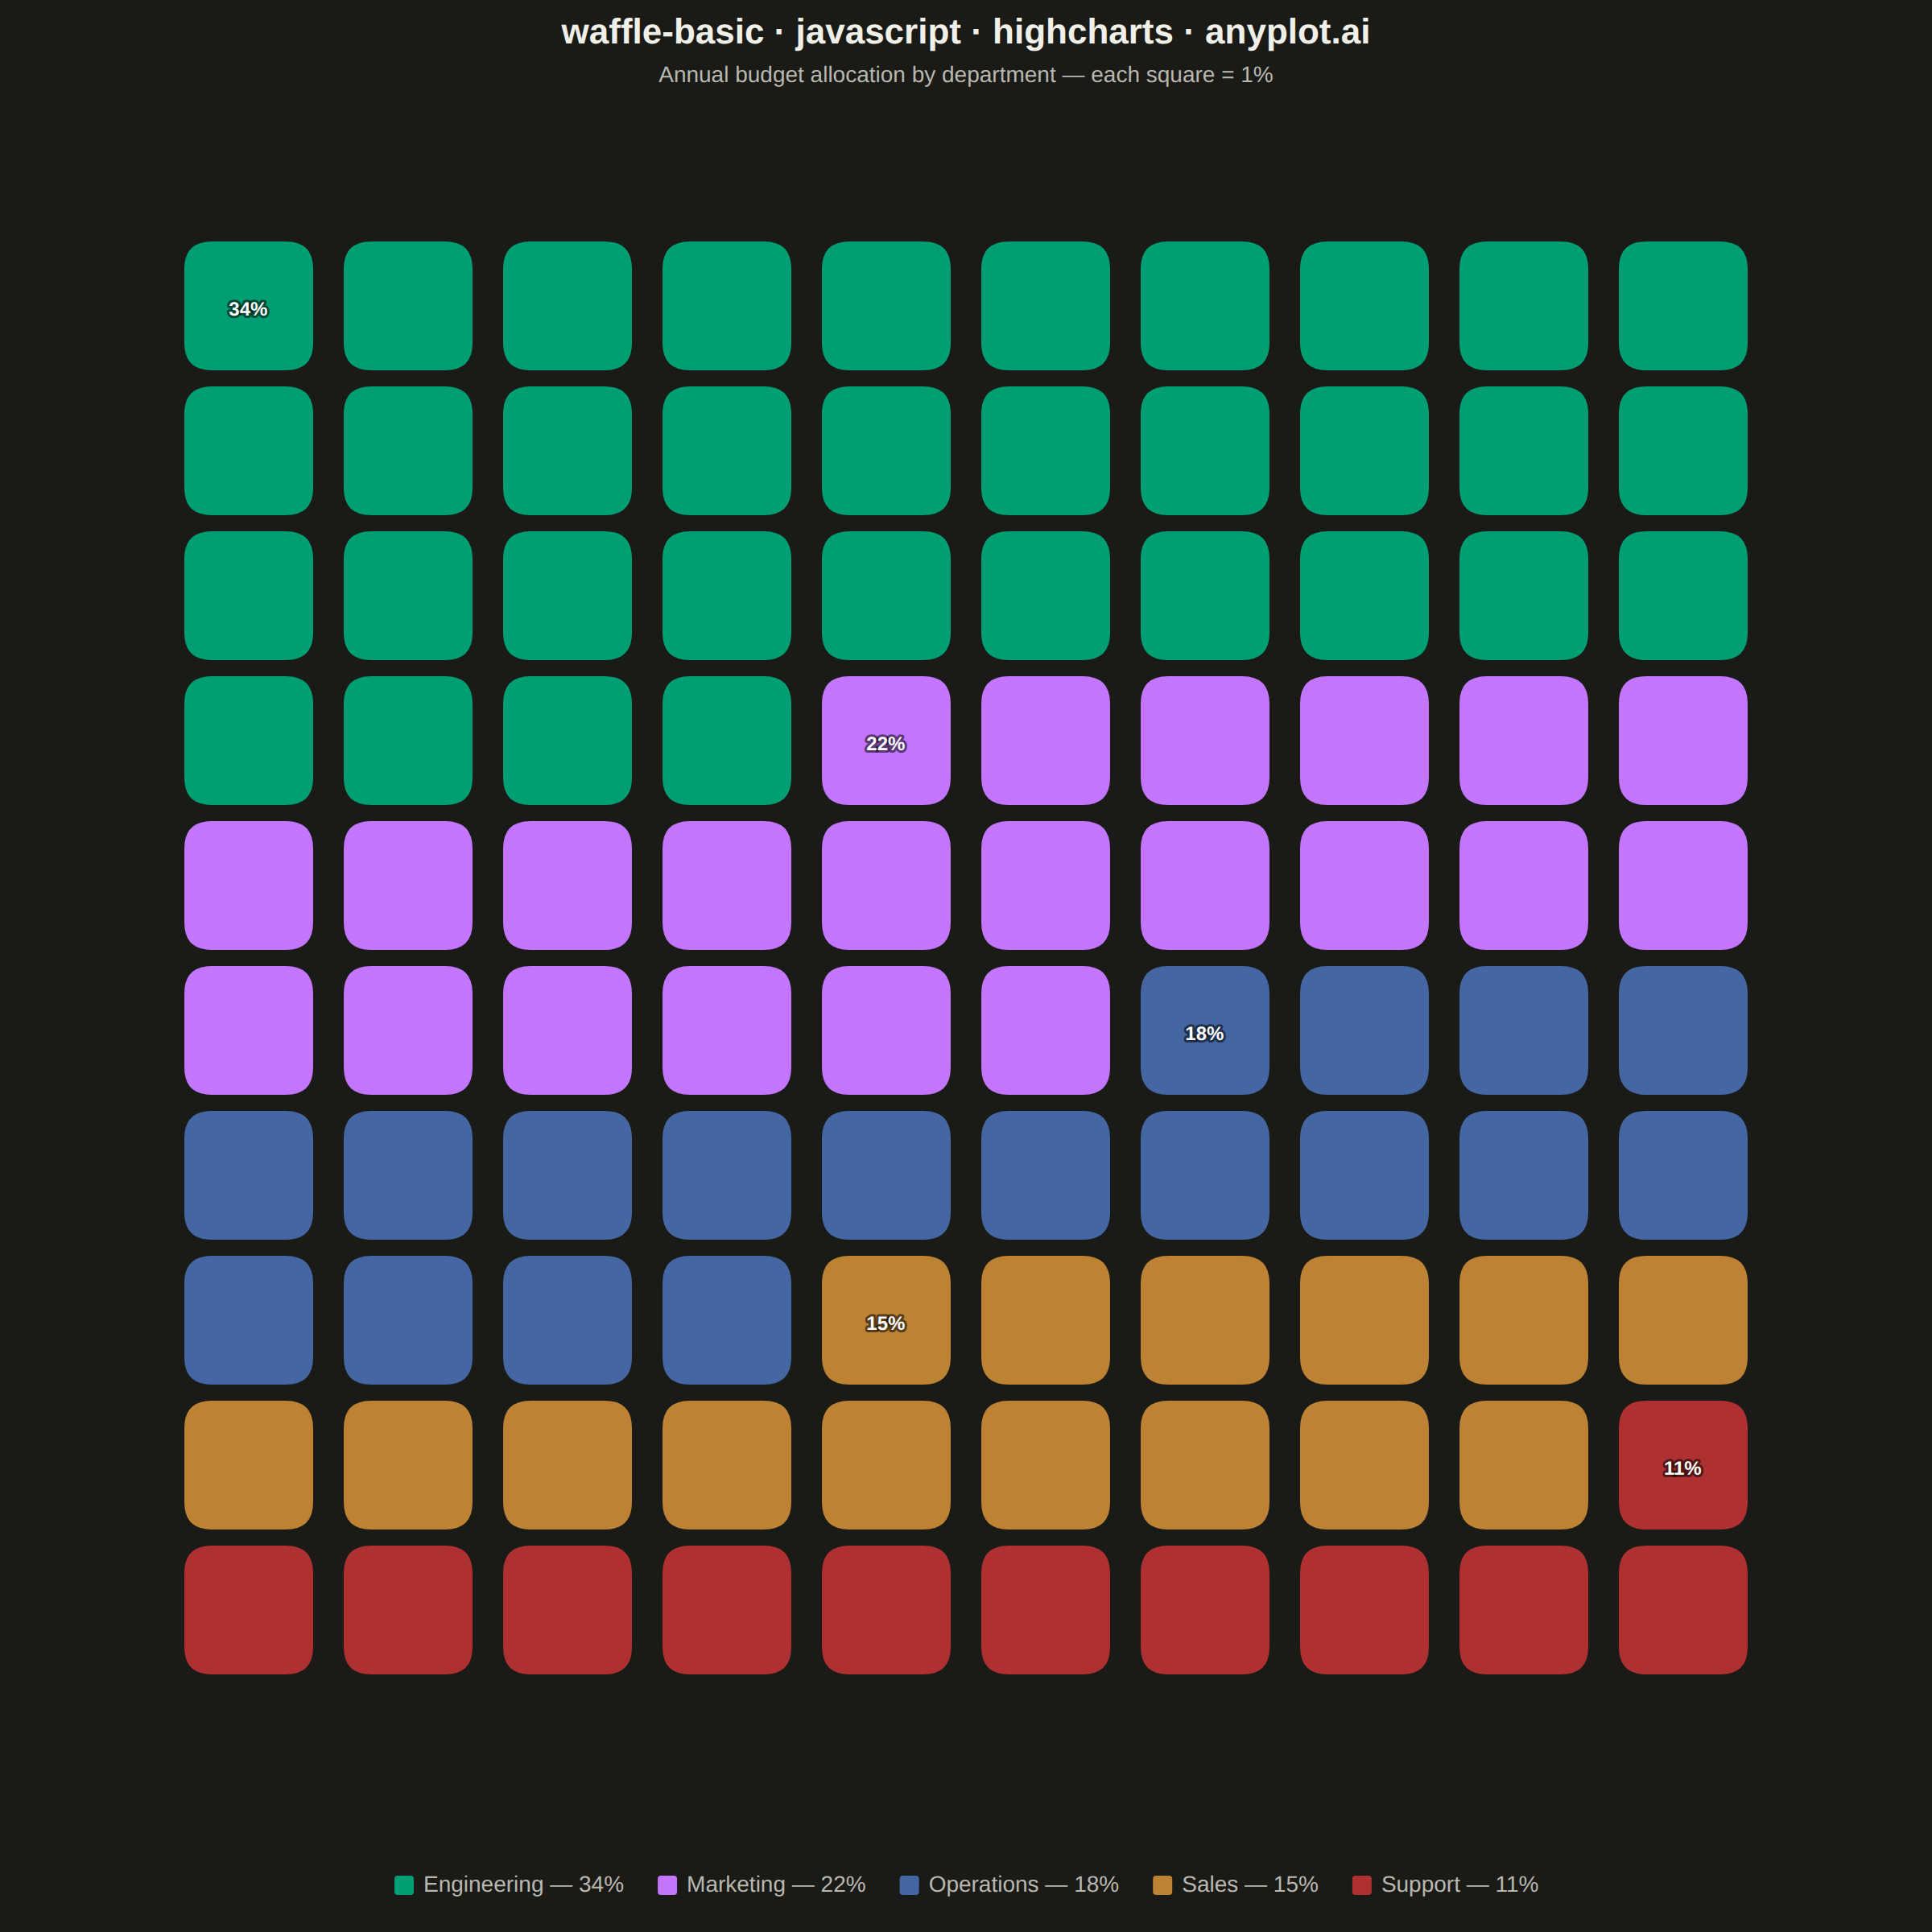
A waffle chart displays proportions using a grid of equal-sized squares where colored squares represent parts of a whole. Each square typically represents 1% of the total, making it easy to count and compare values visually. It provides an intuitive alternative to pie charts, offering more accurate perception of proportions.
// anyplot.ai
// waffle-basic: Basic Waffle Chart
// Library: highcharts 12.6.0 | JavaScript 22.23.2
// Quality: 90/100 | Created: 2026-09-09

//# anyplot-orientation: square
const t = window.ANYPLOT_TOKENS;

// --- Data (in-memory, deterministic) ---------------------------------------
const departments = [
  { name: "Engineering", value: 34 },
  { name: "Marketing", value: 22 },
  { name: "Operations", value: 18 },
  { name: "Sales", value: 15 },
  { name: "Support", value: 11 },
];

const GRID_SIZE = 10;
let cellIndex = 0;
const series = departments.map((dept, i) => {
  const data = [];
  for (let n = 0; n < dept.value; n += 1) {
    const row = Math.floor(cellIndex / GRID_SIZE);
    const col = cellIndex % GRID_SIZE;
    const point = { x: col, y: row };
    if (n === 0) {
      // Highcharts-specific touch: stamp the department's percentage as a
      // dataLabel on its leading square instead of relying on hue alone.
      point.dataLabels = {
        enabled: true,
        format: `${dept.value}%`,
        verticalAlign: "middle",
        y: 1,
        style: {
          color: "#FFFFFF",
          textOutline: "1.5px rgba(0, 0, 0, 0.55)",
          fontSize: "12px",
          fontWeight: "700",
        },
      };
    }
    data.push(point);
    cellIndex += 1;
  }
  return {
    name: `${dept.name} — ${dept.value}%`,
    color: t.palette[i],
    data,
  };
});

// Rounded-square marker symbol: a subtle deliberate refinement over a plain
// solid square, giving the grid a lifted, tile-like depth in both themes.
Highcharts.SVGRenderer.prototype.symbols.squareRounded = function (x, y, w, h) {
  const r = Math.round(Math.min(w, h) * 0.22);
  return [
    "M", x + r, y,
    "L", x + w - r, y,
    "Q", x + w, y, x + w, y + r,
    "L", x + w, y + h - r,
    "Q", x + w, y + h, x + w - r, y + h,
    "L", x + r, y + h,
    "Q", x, y + h, x, y + h - r,
    "L", x, y + r,
    "Q", x, y, x + r, y,
    "Z",
  ];
};

// --- Chart -------------------------------------------------------------
Highcharts.chart("container", {
  chart: {
    type: "scatter",
    backgroundColor: "transparent",
    animation: false,
    style: { fontFamily: "inherit" },
    marginTop: 100,
    marginBottom: 110,
    marginLeft: 105,
    marginRight: 105,
  },
  credits: { enabled: false },
  colors: t.palette,
  title: {
    text: "waffle-basic · javascript · highcharts · anyplot.ai",
    style: { color: t.ink, fontSize: "22px", fontWeight: "600" },
  },
  subtitle: {
    text: "Annual budget allocation by department — each square = 1%",
    style: { color: t.inkSoft, fontSize: "14px" },
  },
  xAxis: {
    min: -0.5,
    max: GRID_SIZE - 0.5,
    tickInterval: 1,
    gridLineWidth: 0,
    lineWidth: 0,
    tickWidth: 0,
    labels: { enabled: false },
    title: { text: null },
  },
  yAxis: {
    min: -0.5,
    max: GRID_SIZE - 0.5,
    tickInterval: 1,
    reversed: true,
    gridLineWidth: 0,
    lineWidth: 0,
    tickWidth: 0,
    labels: { enabled: false },
    title: { text: null },
  },
  legend: {
    layout: "horizontal",
    align: "center",
    verticalAlign: "bottom",
    itemStyle: { color: t.inkSoft, fontSize: "14px" },
    itemHoverStyle: { color: t.ink },
    symbolHeight: 14,
    symbolWidth: 14,
    symbolRadius: 3,
  },
  tooltip: {
    headerFormat: "",
    pointFormat: "<b>{series.name}</b>",
  },
  plotOptions: {
    series: { animation: false, dataLabels: { enabled: false } },
    scatter: {
      marker: {
        symbol: "squareRounded",
        radius: 41,
        lineWidth: 2,
        lineColor: t.pageBg,
      },
      states: { hover: { halo: { size: 0 } } },
    },
  },
  series,
});
Runnable source as JSON, for any HTTP client: https://api.anyplot.ai/specs/waffle-basic/highcharts/code. Any spec id and library id listed in llms-full.txt fit the same URL shape; every URL below is complete and callable.
{
  "spec_id": "waffle-basic",
  "language": "javascript",
  "library": "highcharts",
  "page": "https://anyplot.ai/waffle-basic/javascript/highcharts",
  "hub": "https://anyplot.ai/waffle-basic",
  "code_json": "https://api.anyplot.ai/specs/waffle-basic/highcharts/code",
  "spec_json": "https://api.anyplot.ai/specs/waffle-basic",
  "render_light_png": "https://storage.googleapis.com/anyplot-images/plots/waffle-basic/javascript/highcharts/plot-light.png",
  "render_dark_png": "https://storage.googleapis.com/anyplot-images/plots/waffle-basic/javascript/highcharts/plot-dark.png",
  "interactive_light_html": "https://storage.googleapis.com/anyplot-images/plots/waffle-basic/javascript/highcharts/plot-light.html",
  "interactive_dark_html": "https://storage.googleapis.com/anyplot-images/plots/waffle-basic/javascript/highcharts/plot-dark.html",
  "quality_score": 90.0,
  "license": "MIT",
  "guide": "https://anyplot.ai/llms.txt"
}
Part of Basic Waffle Chart on anyplot.ai.