The same plot in 14 other libraries — JavaScript: Chart.js, Apache ECharts, Highcharts, MUI X Charts; Python: Altair, Bokeh, lets-plot, Matplotlib, Plotly, plotnine, Pygal, Seaborn; R: ggplot2; Julia: Makie.jl. Compare all 15 side by side: Basic Waffle Chart in Python, R, Julia and JavaScript.
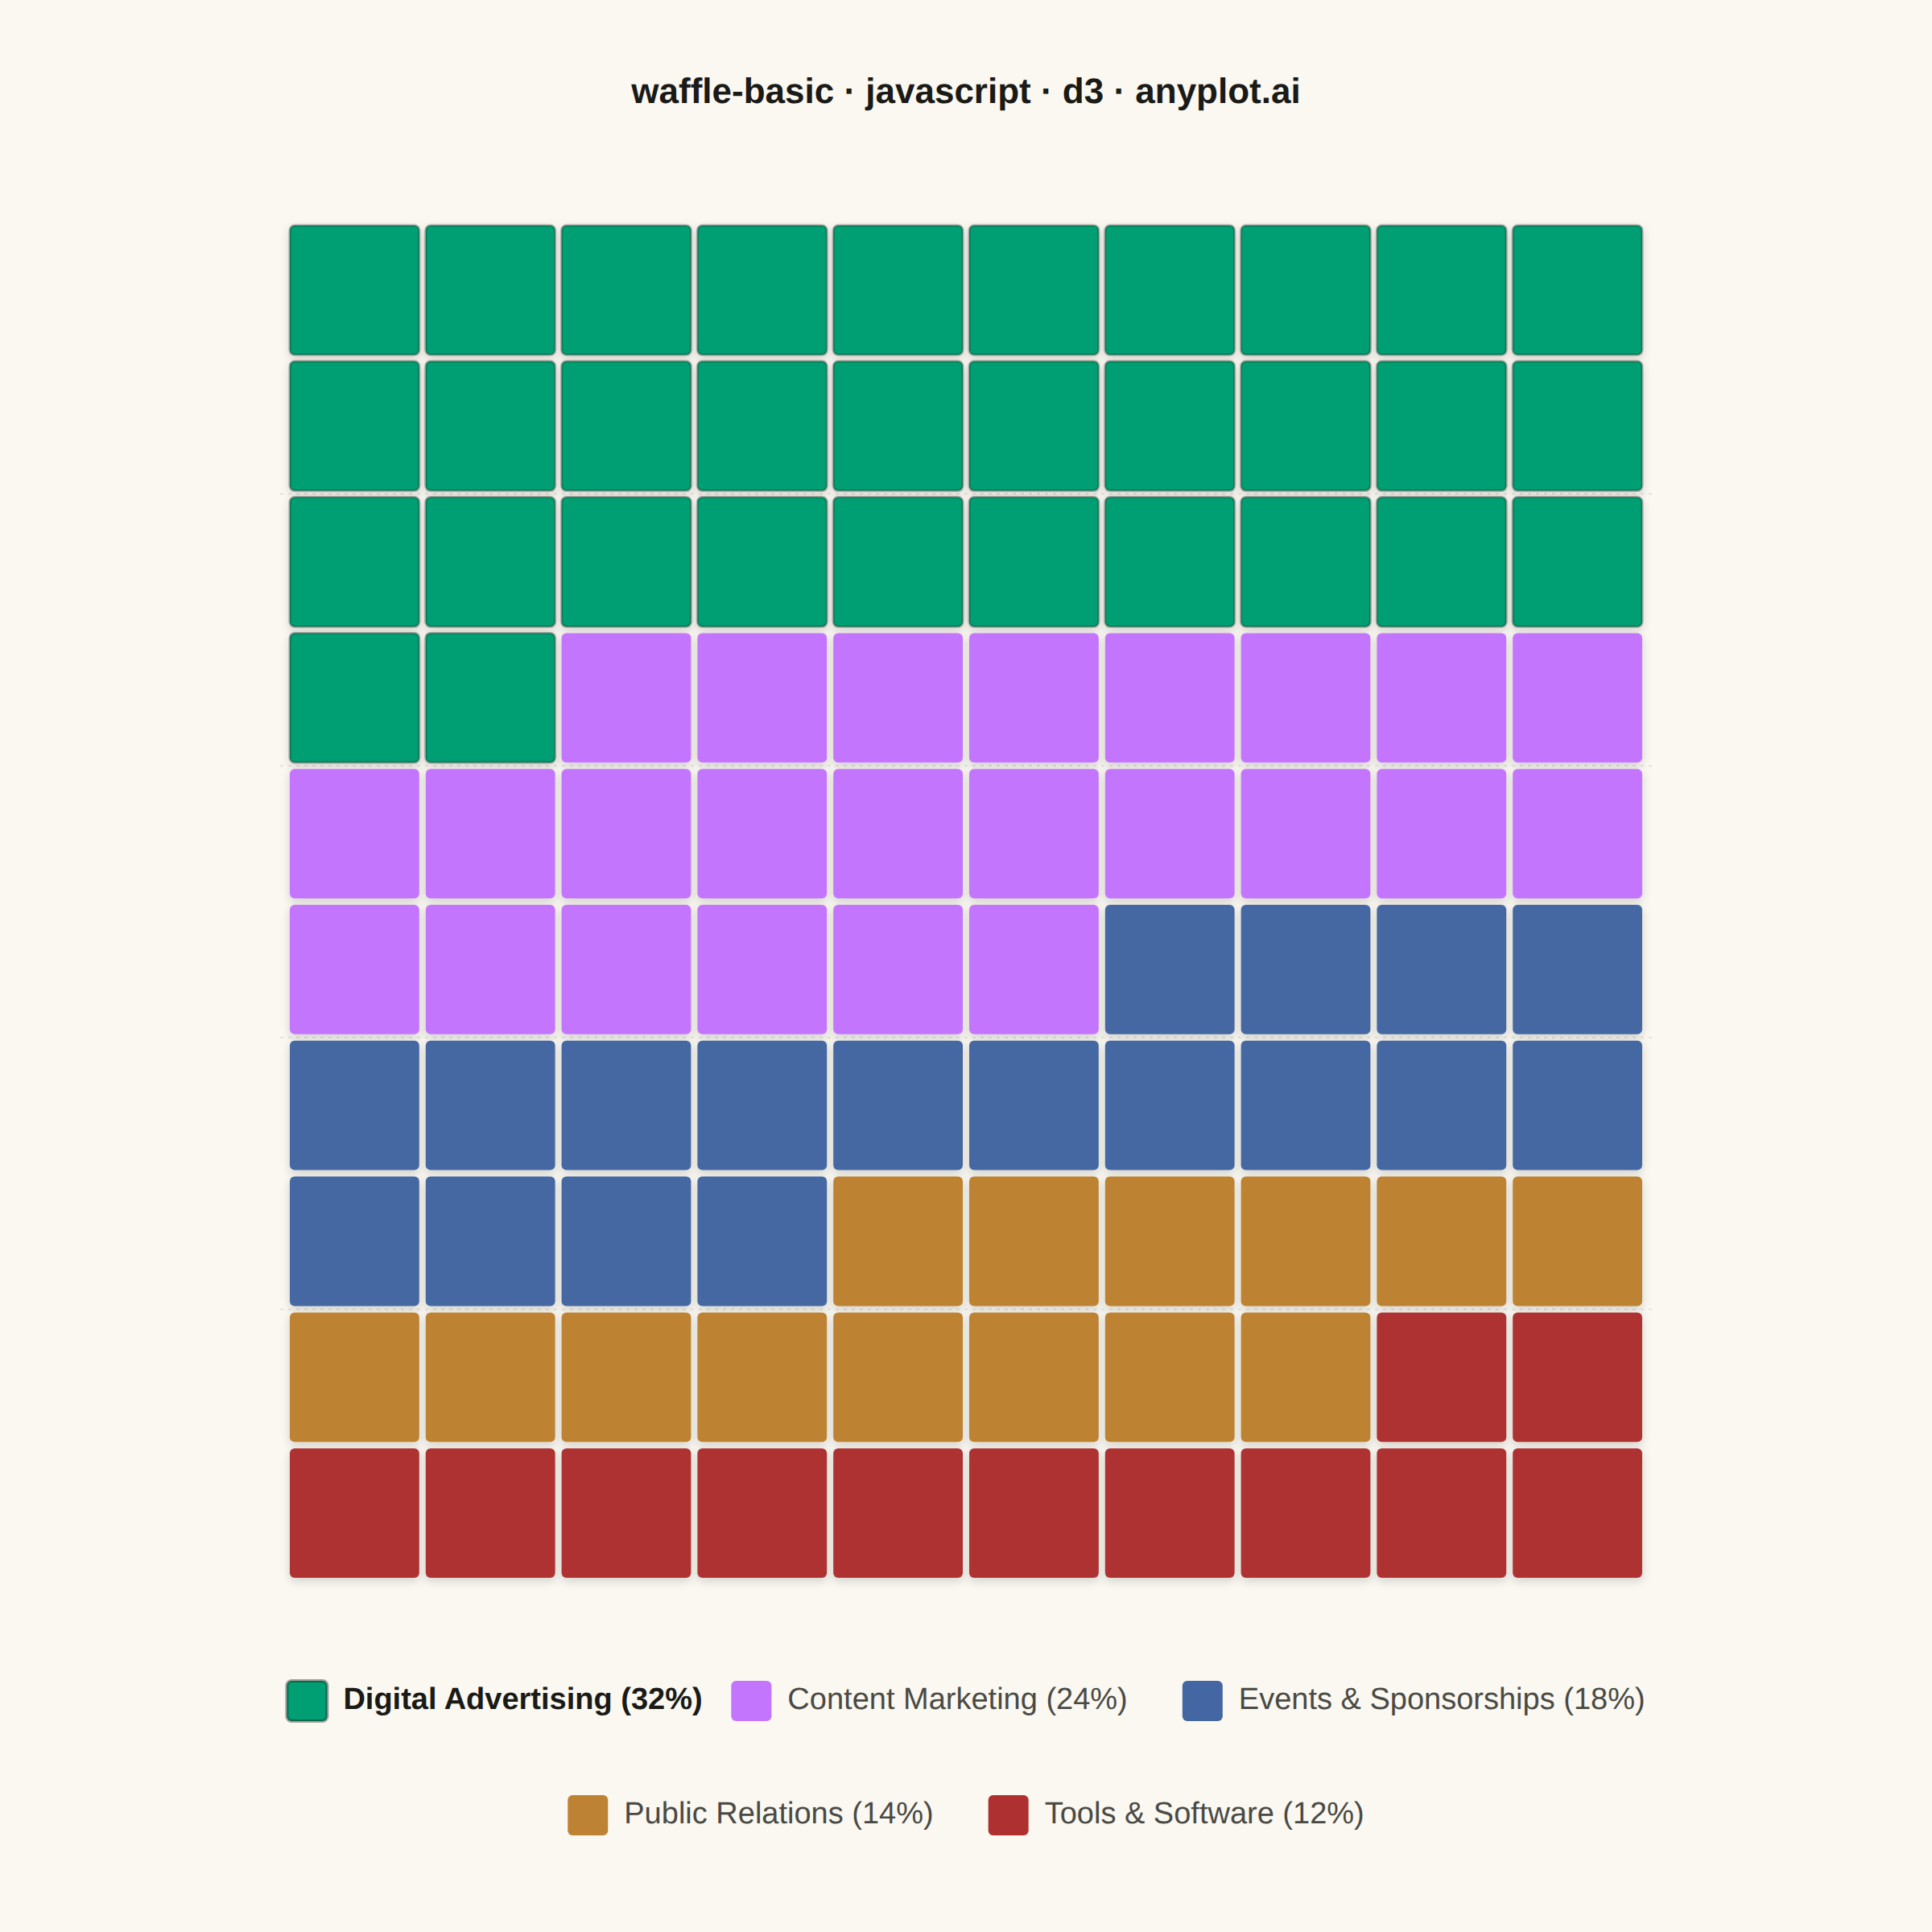
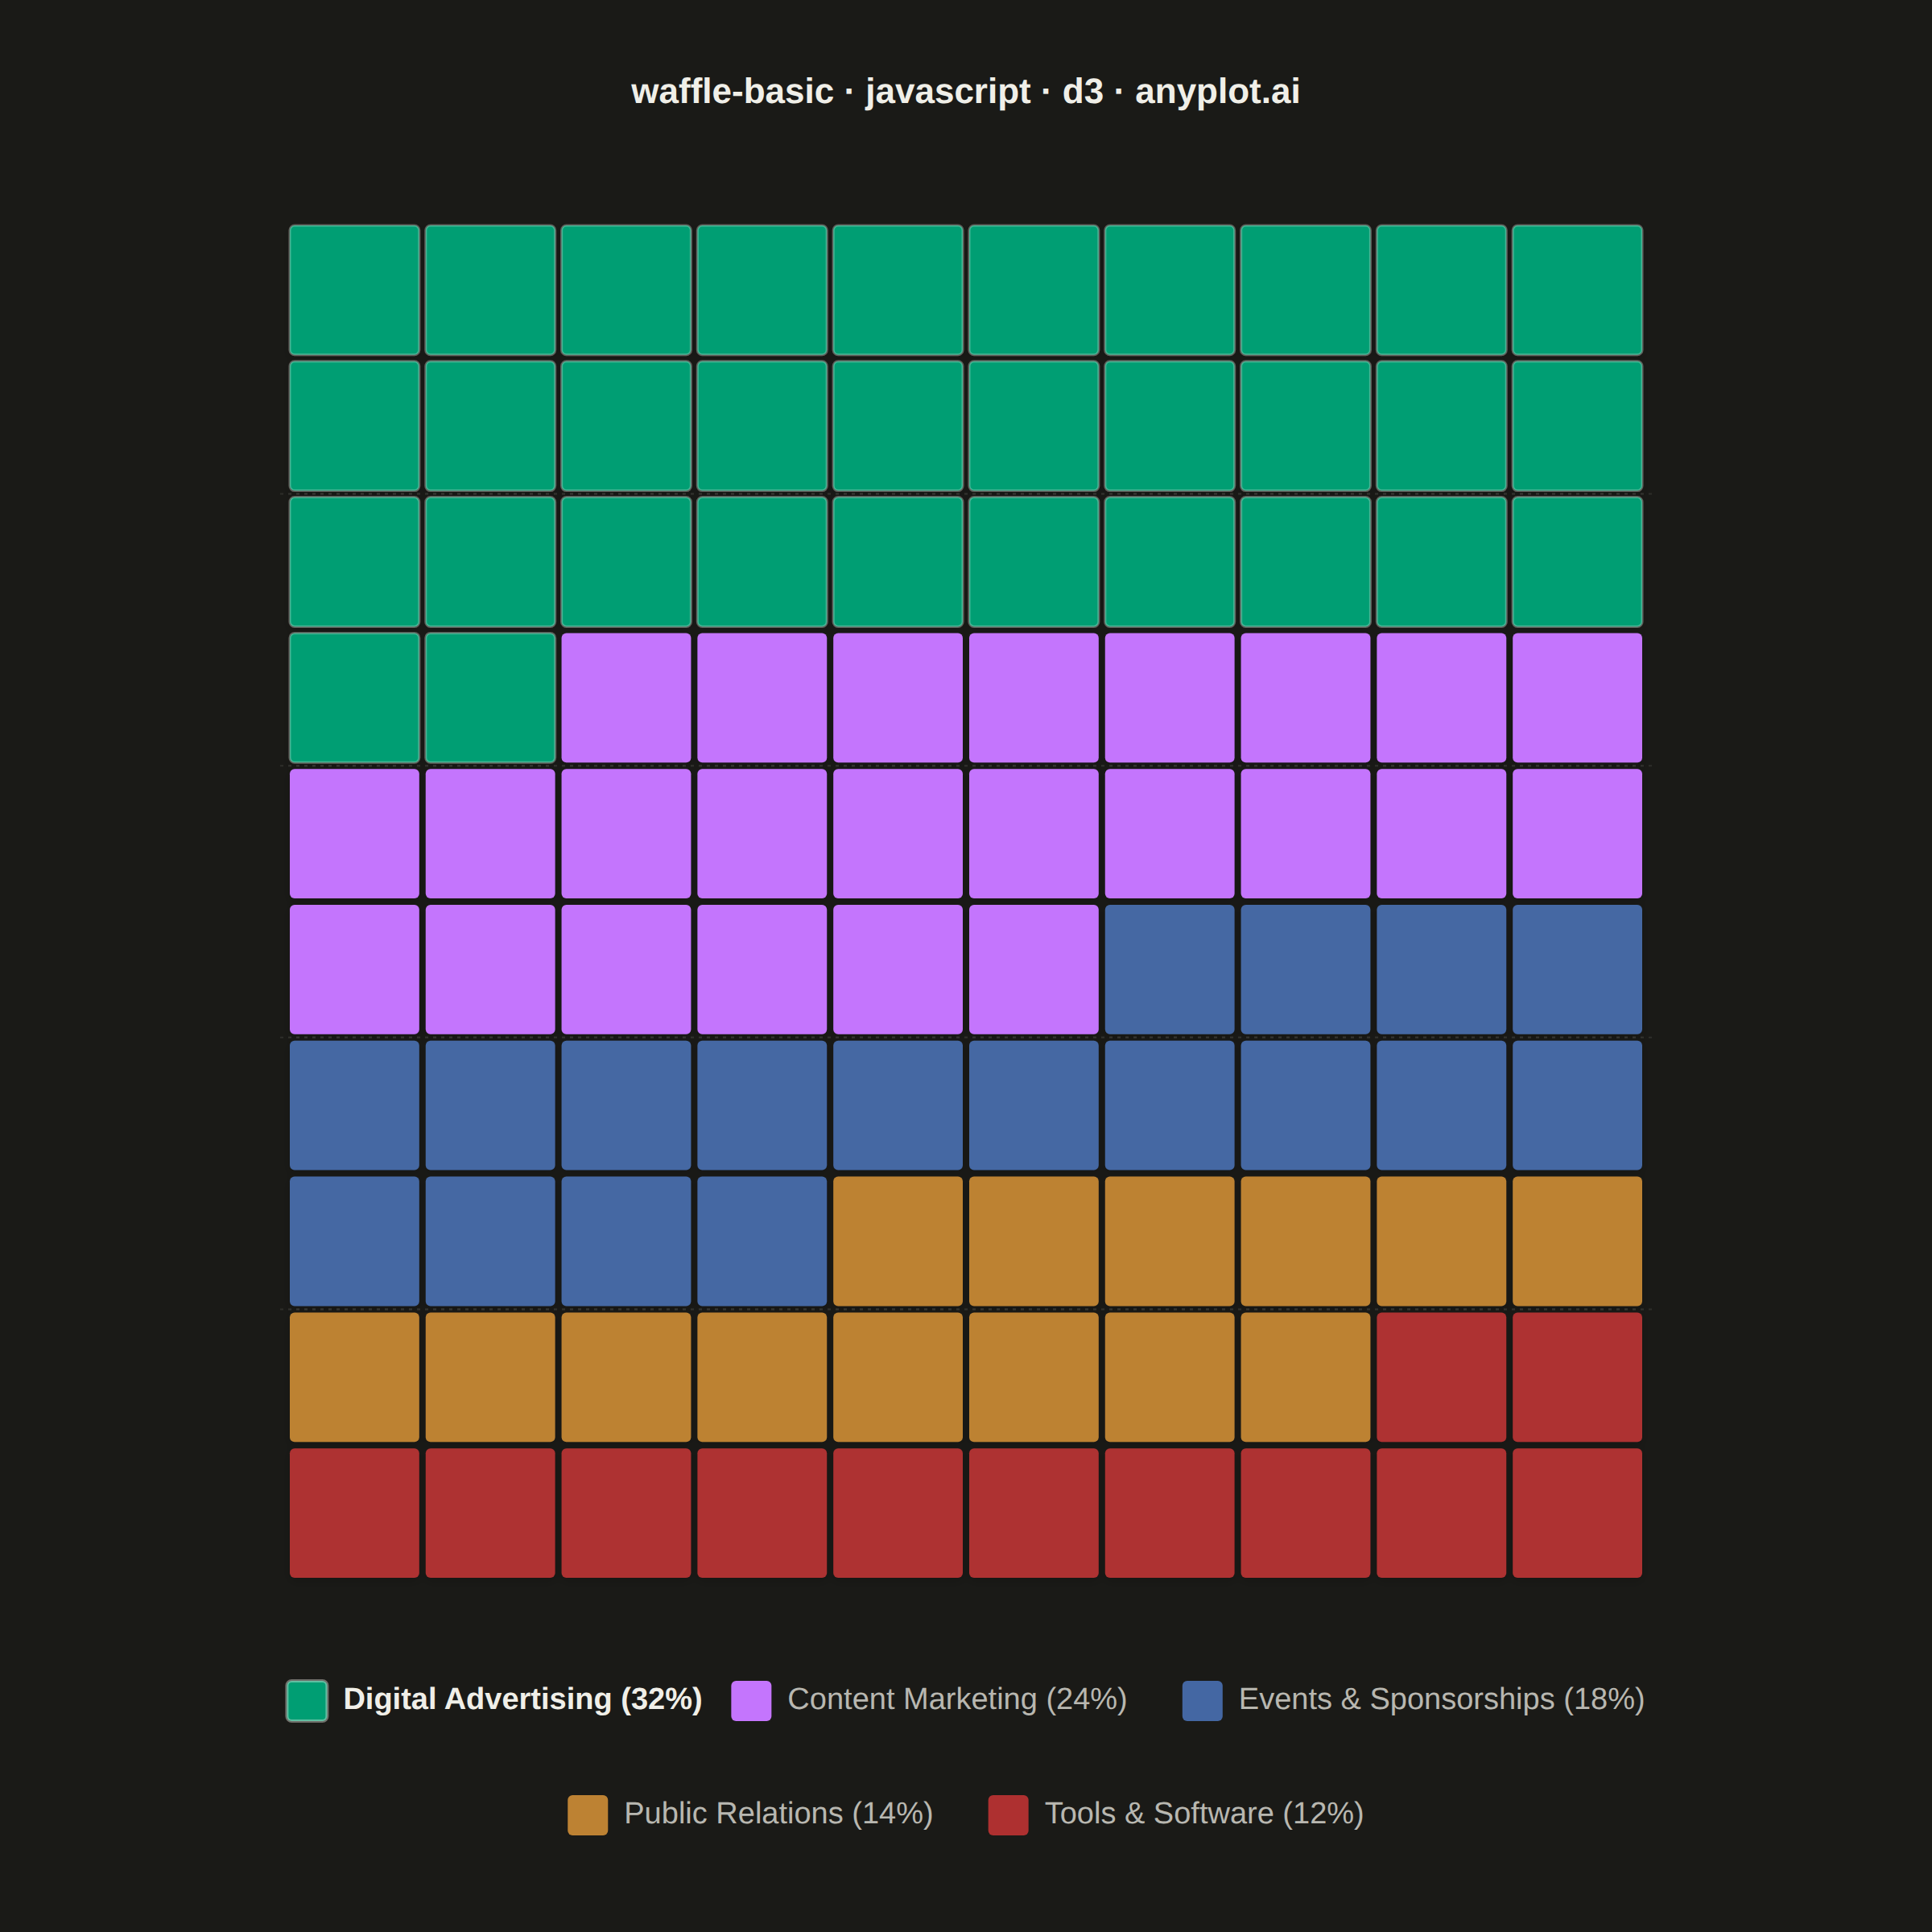
A waffle chart displays proportions using a grid of equal-sized squares where colored squares represent parts of a whole. Each square typically represents 1% of the total, making it easy to count and compare values visually. It provides an intuitive alternative to pie charts, offering more accurate perception of proportions.
// anyplot.ai
// waffle-basic: Basic Waffle Chart
// Library: d3 7.9.0 | JavaScript 22.23.2
// Quality: 87/100 | Created: 2026-09-09

//# anyplot-orientation: square
const t = window.ANYPLOT_TOKENS;
const { width, height } = window.ANYPLOT_SIZE;

// --- Data (in-memory, deterministic) ----------------------------------------
// Marketing budget allocation across spending categories, values sum to 100.
const categories = [
  { label: "Digital Advertising", value: 32 },
  { label: "Content Marketing", value: 24 },
  { label: "Events & Sponsorships", value: 18 },
  { label: "Public Relations", value: 14 },
  { label: "Tools & Software", value: 12 },
];

const color = d3.scaleOrdinal()
  .domain(categories.map((d) => d.label))
  .range(t.palette);

// Expand into 100 grid cells (one square = 1%), in category order.
const cellCategories = categories.flatMap((d) => Array(d.value).fill(d));

const gridCols = 10;
const gridRows = 10;
const cells = cellCategories.map((d, i) => ({
  category: d,
  row: Math.floor(i / gridCols),
  col: i % gridCols,
}));

// --- SVG mount ----------------------------------------------------------------
const svg = d3.select("#container").append("svg").attr("width", width).attr("height", height);

// Soft drop shadow for the grid group — a small depth cue beyond flat fills.
const shadow = svg.append("defs").append("filter")
  .attr("id", "waffleShadow").attr("x", "-20%").attr("y", "-20%").attr("width", "140%").attr("height", "140%");
shadow.append("feDropShadow")
  .attr("dx", 0).attr("dy", 2).attr("stdDeviation", 3)
  .attr("flood-color", "#000000").attr("flood-opacity", 0.16);

// --- Title ----------------------------------------------------------------
svg.append("text").attr("x", width / 2).attr("y", 64).attr("text-anchor", "middle")
  .attr("fill", t.ink).style("font-size", "22px").style("font-weight", "600")
  .text("waffle-basic · javascript · d3 · anyplot.ai");

// --- Waffle grid --------------------------------------------------------------
const marginTop = 140;
const legendHeight = 220;
const sideMargin = 100;
const availableWidth = width - 2 * sideMargin;
const availableHeight = height - marginTop - legendHeight;
const gridSize = Math.min(availableWidth, availableHeight);
const cellGap = 4;
const cellSize = (gridSize - (gridCols - 1) * cellGap) / gridCols;
const gridX = (width - gridSize) / 2;
const gridY = marginTop;
const leadingCategory = categories[0].label;

const g = svg.append("g").attr("transform", `translate(${gridX},${gridY})`).attr("filter", "url(#waffleShadow)");

g.selectAll("rect").data(cells).join("rect")
  .attr("x", (d) => d.col * (cellSize + cellGap))
  .attr("y", (d) => d.row * (cellSize + cellGap))
  .attr("width", cellSize)
  .attr("height", cellSize)
  .attr("rx", 3)
  .attr("fill", (d) => color(d.category.label))
  .attr("stroke", (d) => (d.category.label === leadingCategory ? t.ink : "none"))
  .attr("stroke-opacity", 0.3)
  .attr("stroke-width", 1.5);

// Decade-band guides: a faint dashed rule every 2 rows (20 cells = 20% of the
// whole), giving the eye a fifths-of-the-total rhythm to count against.
const bandRowBoundaries = [2, 4, 6, 8];
g.selectAll(".band-guide").data(bandRowBoundaries).join("line").attr("class", "band-guide")
  .attr("x1", -6).attr("x2", gridSize + 6)
  .attr("y1", (r) => r * (cellSize + cellGap) - cellGap / 2)
  .attr("y2", (r) => r * (cellSize + cellGap) - cellGap / 2)
  .attr("stroke", t.grid).attr("stroke-width", 1).attr("stroke-dasharray", "2,3").attr("stroke-opacity", 0.6);

// --- Legend ---------------------------------------------------------------
const legendY = marginTop + gridSize + 64;
const swatchSize = 25;
const itemGap = 34;
const legendRowGap = 46;
const legendMaxWidth = availableWidth;
const legendFontSize = "19px";

const legend = svg.append("g").attr("transform", `translate(0,${legendY})`);

// Measure each item's text width first so items can be centered as a group.
const measure = legend.append("text").style("font-size", legendFontSize).attr("opacity", 0);
const itemWidths = categories.map((d) => {
  measure.text(`${d.label} (${d.value}%)`);
  return swatchSize + 10 + measure.node().getComputedTextLength();
});
measure.remove();

// Greedy-wrap legend items into centered rows that fit within the grid's
// width — avoids clipping when larger text pushes a single row too wide.
const legendRows = [];
let row = [];
let rowWidth = 0;
categories.forEach((d, i) => {
  const added = row.length === 0 ? itemWidths[i] : itemWidths[i] + itemGap;
  if (row.length > 0 && rowWidth + added > legendMaxWidth) {
    legendRows.push(row);
    row = [];
    rowWidth = 0;
  }
  row.push(i);
  rowWidth += row.length === 1 ? itemWidths[i] : itemWidths[i] + itemGap;
});
if (row.length) legendRows.push(row);

legendRows.forEach((indices, r) => {
  const rowTotalWidth = indices.reduce((sum, i) => sum + itemWidths[i], 0) + itemGap * (indices.length - 1);
  let cursorX = (width - rowTotalWidth) / 2;
  const rowY = r * (swatchSize + legendRowGap);

  indices.forEach((i) => {
    const d = categories[i];
    const isLeading = d.label === leadingCategory;
    const item = legend.append("g").attr("transform", `translate(${cursorX},${rowY})`);
    item.append("rect")
      .attr("width", swatchSize).attr("height", swatchSize)
      .attr("rx", 3)
      .attr("fill", color(d.label))
      .attr("stroke", isLeading ? t.ink : "none")
      .attr("stroke-opacity", 0.4)
      .attr("stroke-width", 2);
    item.append("text")
      .attr("x", swatchSize + 10).attr("y", swatchSize / 2)
      .attr("dominant-baseline", "middle")
      .attr("fill", isLeading ? t.ink : t.inkSoft).style("font-size", legendFontSize)
      .style("font-weight", isLeading ? "700" : "400")
      .text(`${d.label} (${d.value}%)`);
    cursorX += itemWidths[i] + itemGap;
  });
});
Runnable source as JSON, for any HTTP client: https://api.anyplot.ai/specs/waffle-basic/d3/code. Any spec id and library id listed in llms-full.txt fit the same URL shape; every URL below is complete and callable.
{
  "spec_id": "waffle-basic",
  "language": "javascript",
  "library": "d3",
  "page": "https://anyplot.ai/waffle-basic/javascript/d3",
  "hub": "https://anyplot.ai/waffle-basic",
  "code_json": "https://api.anyplot.ai/specs/waffle-basic/d3/code",
  "spec_json": "https://api.anyplot.ai/specs/waffle-basic",
  "render_light_png": "https://storage.googleapis.com/anyplot-images/plots/waffle-basic/javascript/d3/plot-light.png",
  "render_dark_png": "https://storage.googleapis.com/anyplot-images/plots/waffle-basic/javascript/d3/plot-dark.png",
  "interactive_light_html": "https://storage.googleapis.com/anyplot-images/plots/waffle-basic/javascript/d3/plot-light.html",
  "interactive_dark_html": "https://storage.googleapis.com/anyplot-images/plots/waffle-basic/javascript/d3/plot-dark.html",
  "quality_score": 87.0,
  "license": "MIT",
  "guide": "https://anyplot.ai/llms.txt"
}
Part of Basic Waffle Chart on anyplot.ai.