The same plot in 14 other libraries — JavaScript: Chart.js, D3.js, Apache ECharts, Highcharts; Python: Altair, Bokeh, lets-plot, Matplotlib, Plotly, plotnine, Pygal, Seaborn; R: ggplot2; Julia: Makie.jl. Compare all 15 side by side: Basic Waffle Chart in Python, R, Julia and JavaScript.
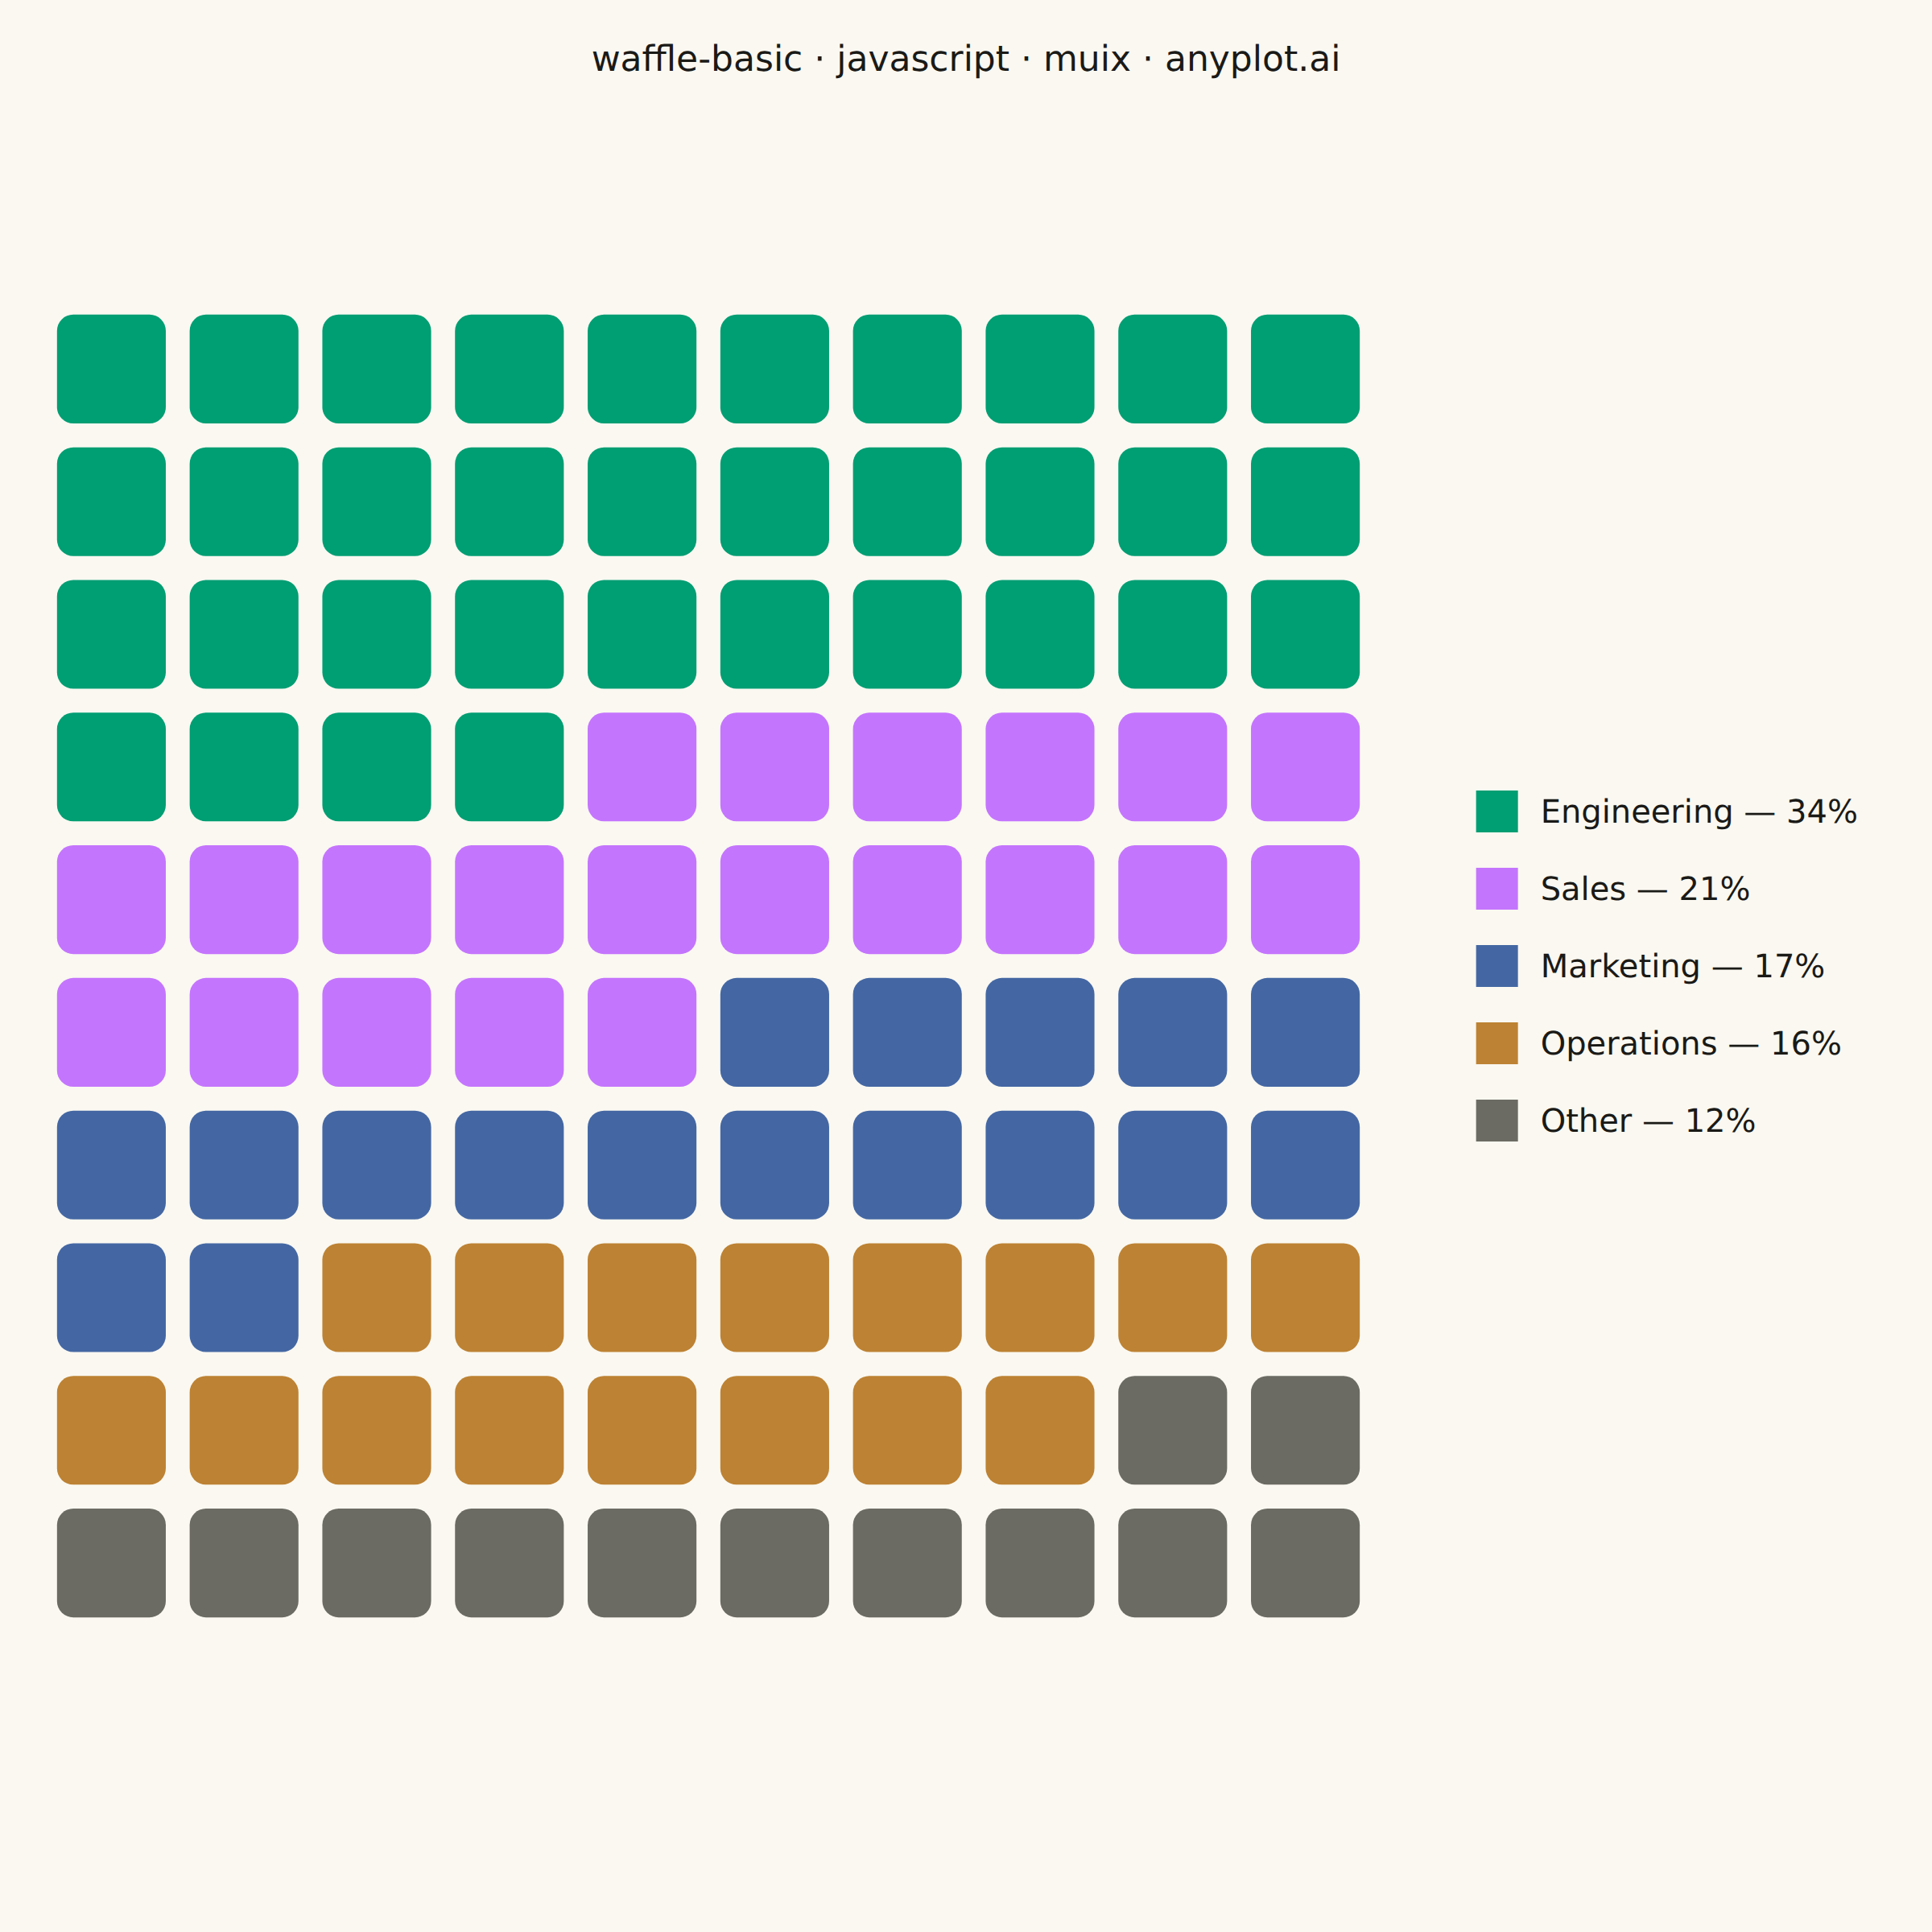
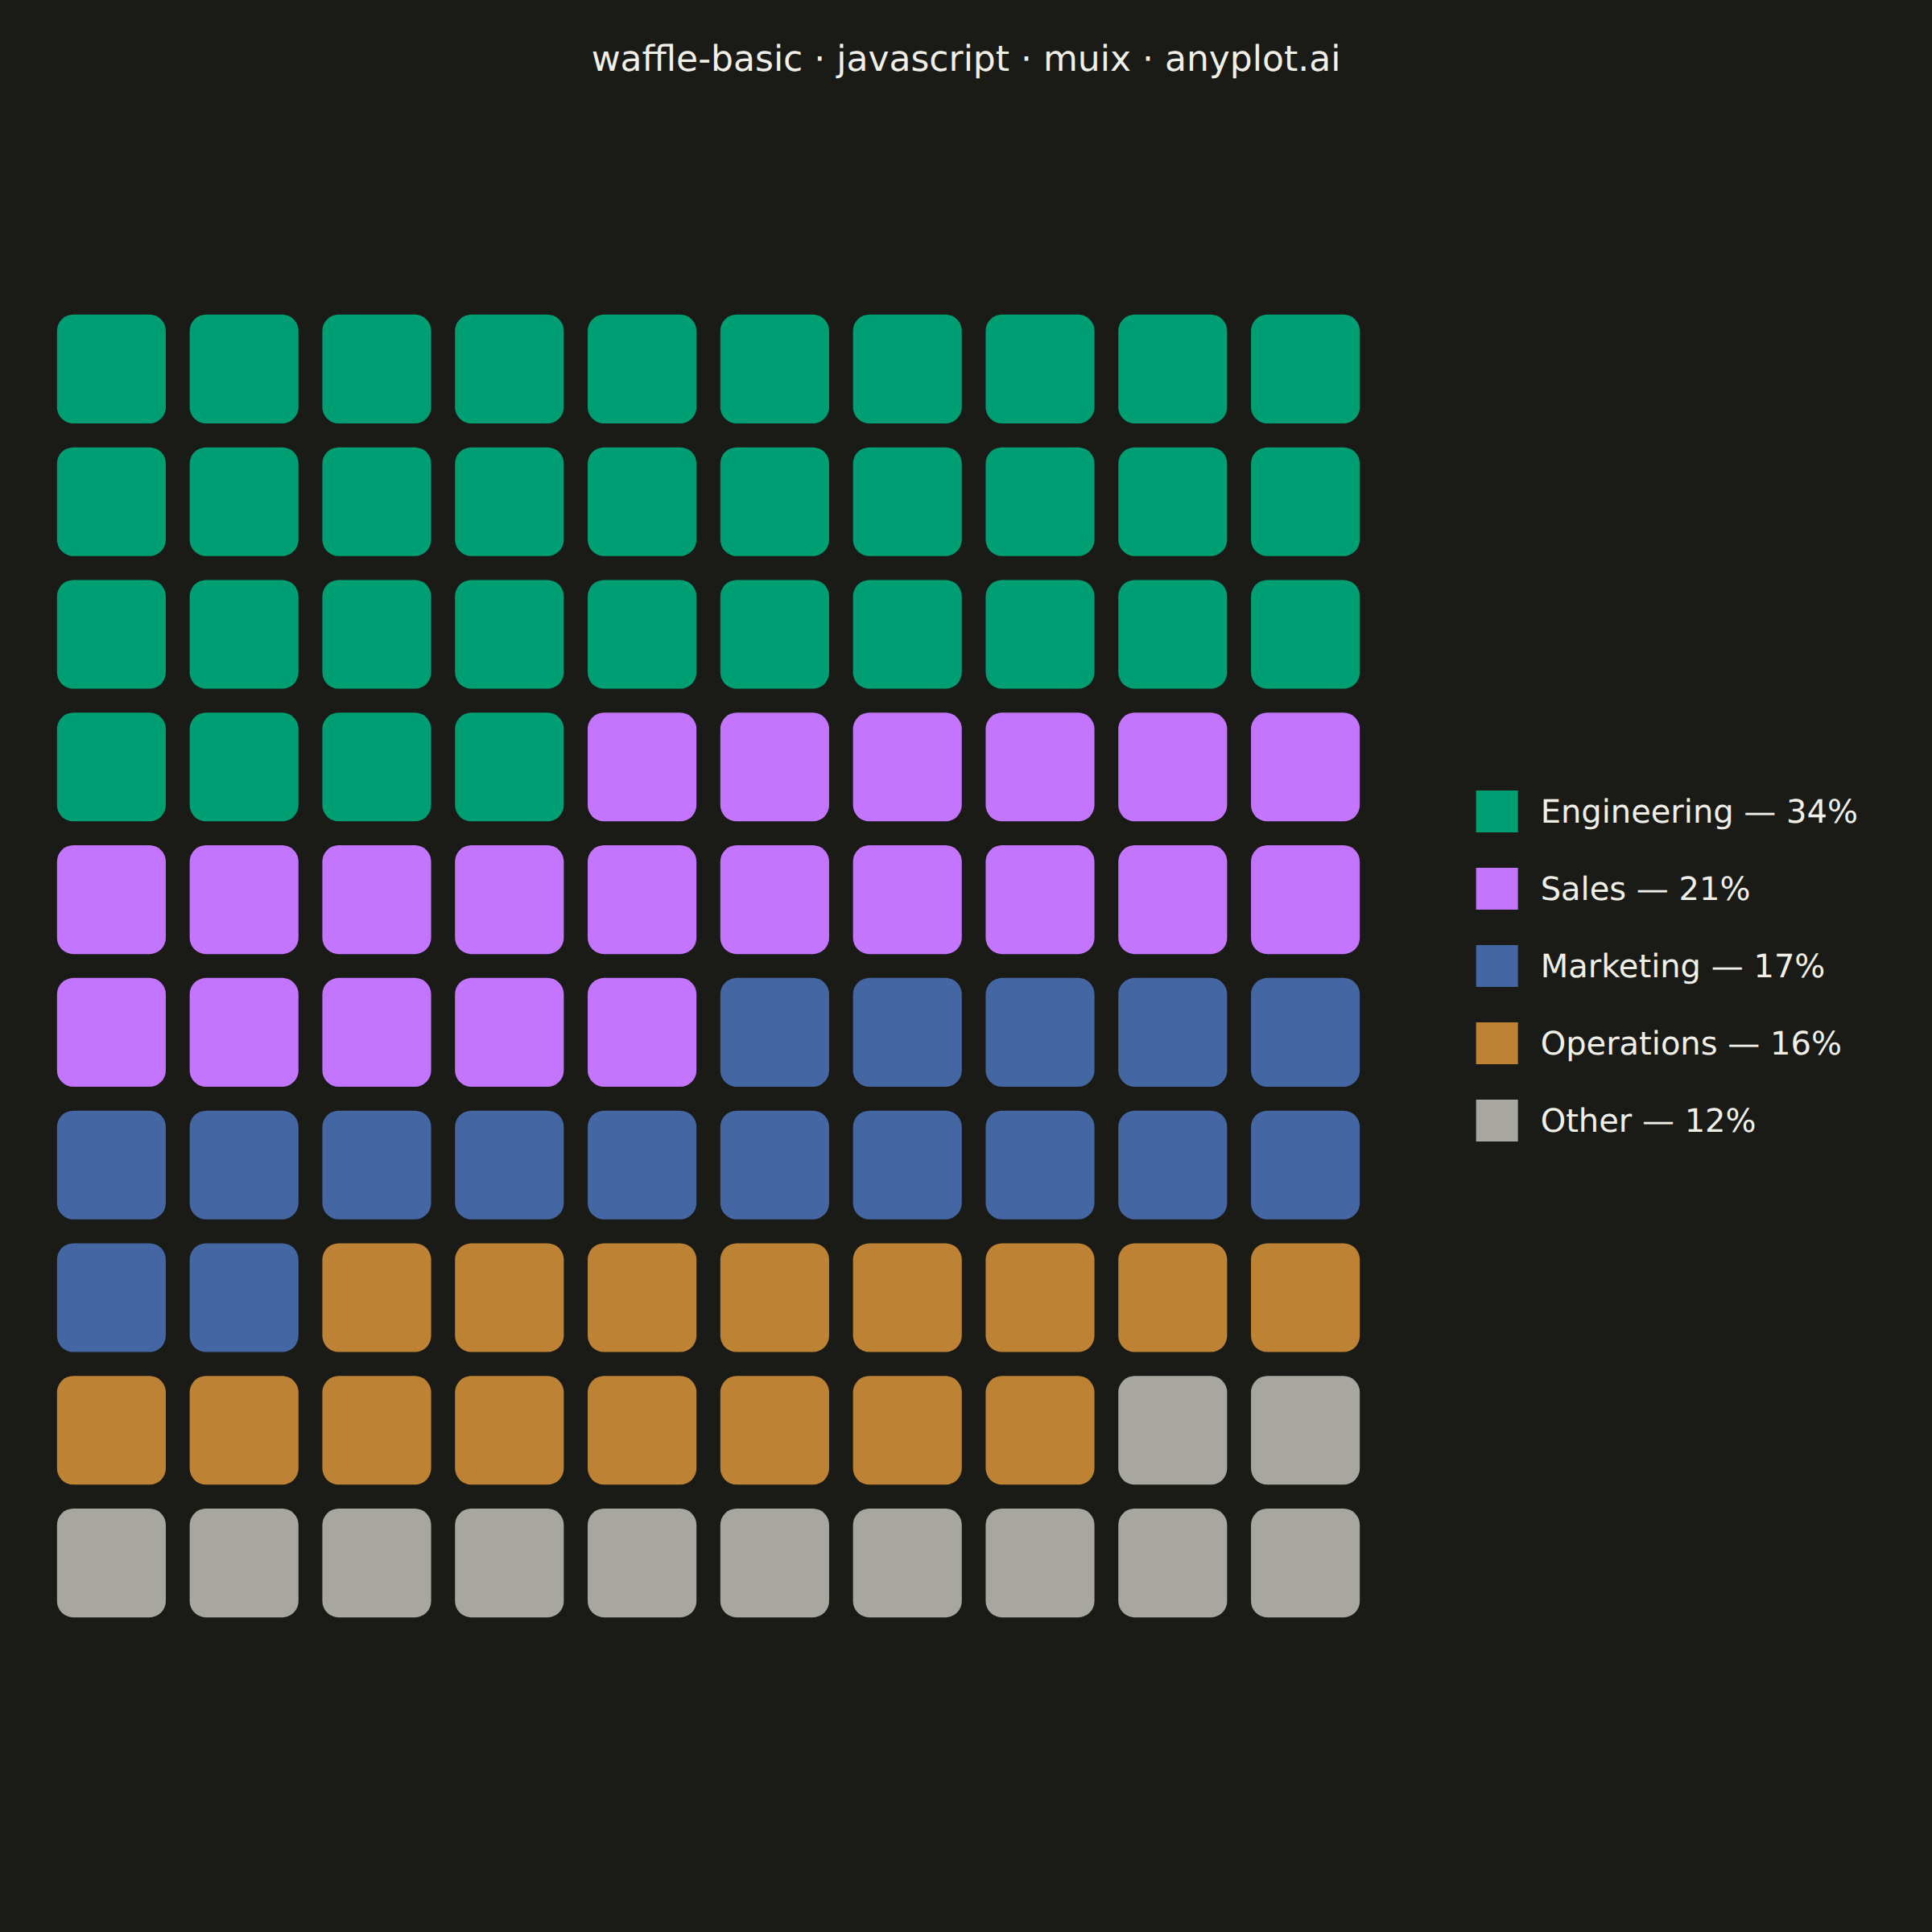
A waffle chart displays proportions using a grid of equal-sized squares where colored squares represent parts of a whole. Each square typically represents 1% of the total, making it easy to count and compare values visually. It provides an intuitive alternative to pie charts, offering more accurate perception of proportions.
// anyplot.ai
// waffle-basic: Basic Waffle Chart
// Library: muix 7.29.1 | JavaScript 22.23.2
// Quality: 89/100 | Created: 2026-09-09
//# anyplot-orientation: square

import { ChartContainer } from "@mui/x-charts/ChartContainer";
import { ScatterPlot } from "@mui/x-charts/ScatterChart";
import { ChartsLegend } from "@mui/x-charts/ChartsLegend";

const t = window.ANYPLOT_TOKENS;
const FONT = "system-ui, -apple-system, sans-serif";
const TITLE = "waffle-basic · javascript · muix · anyplot.ai";

// Imprint's theme-adaptive "muted" anchor (other/rest) isn't part of
// ANYPLOT_TOKENS, so it's derived here the same way the style guide defines it.
const MUTED = window.ANYPLOT_THEME === "dark" ? "#A8A79F" : "#6B6A63";

// --- Data (in-memory, deterministic) ----------------------------------------
// Annual engineering-org budget allocation by department. Values sum to 100 —
// one grid square per percentage point, the canonical waffle-chart mapping.
// "Other" gets the theme-adaptive muted anchor (other/rest semantic exception)
// instead of the next ordinal palette slot.
const CATEGORIES = [
  { label: "Engineering", pct: 34, color: t.palette[0] },
  { label: "Sales", pct: 21, color: t.palette[1] },
  { label: "Marketing", pct: 17, color: t.palette[2] },
  { label: "Operations", pct: 16, color: t.palette[3] },
  { label: "Other", pct: 12, color: MUTED },
];

const GRID_SIZE = 10; // 10x10 = 100 squares, one per percentage point
const COLS = Array.from({ length: GRID_SIZE }, (_, i) => i);
const ROWS = Array.from({ length: GRID_SIZE }, (_, i) => i);

// Fill the grid row-major, left-to-right then top-to-bottom, handing each
// category a contiguous block of squares in the order above.
let cellIndex = 0;
const series = CATEGORIES.map((category) => {
  const data = [];
  for (let i = 0; i < category.pct; i += 1) {
    data.push({
      id: `cell-${cellIndex}`,
      x: cellIndex % GRID_SIZE,
      y: Math.floor(cellIndex / GRID_SIZE),
    });
    cellIndex += 1;
  }
  return {
    type: "scatter",
    id: category.label.toLowerCase(),
    data,
    label: `${category.label} — ${category.pct}%`,
  };
});
const COLORS = CATEGORIES.map((category) => category.color);

// Custom scatter mark: opaque squares tiling the band grid, colored per series
// rather than by a continuous data value — this is what turns MUI X's
// ScatterPlot into a waffle/unit-chart grid instead of a scatter of dots.
function WaffleSquares({ series: seriesData, xScale, yScale, color }) {
  const cellW = xScale.bandwidth();
  const cellH = yScale.bandwidth();
  const radius = Math.min(cellW, cellH) * 0.15;
  return (
    <g>
      {seriesData.data.map((pt) => (
        <rect
          key={pt.id}
          x={xScale(pt.x) ?? 0}
          y={yScale(pt.y) ?? 0}
          width={cellW}
          height={cellH}
          rx={radius}
          fill={color}
        />
      ))}
    </g>
  );
}

export default function Chart() {
  const W = window.ANYPLOT_SIZE.width;
  const H = window.ANYPLOT_SIZE.height;

  // Reserve width for the legend (right), then size the waffle grid to the
  // largest square that fits — width is the binding constraint since the
  // legend column eats more width than the title eats height — so every one
  // of the 100 cells is a true square.
  const TITLE_SPACE = 80; // minimum clearance the grid must leave below the title
  const PAD = 28;
  const LEGEND_WIDTH = 320;

  const availW = W - PAD * 2 - LEGEND_WIDTH;
  const availH = H - PAD * 2;
  const grid = Math.min(availW, availH);

  // Center the grid+legend block vertically in the full canvas (instead of
  // top-aligning it against the title) so leftover height doesn't collect as
  // dead space below. Clamp so the grid never rises above the title's
  // reserved band.
  const vPad = Math.max(TITLE_SPACE, (H - grid) / 2);
  const margin = {
    left: PAD + (availW - grid) / 2,
    right: W - PAD - (availW - grid) / 2 - grid,
    top: vPad,
    bottom: H - vPad - grid,
  };
  const gridCenterY = margin.top + grid / 2;

  return (
    <ChartContainer
      width={W}
      height={H}
      margin={margin}
      skipAnimation
      colors={COLORS}
      series={series}
      xAxis={[{ scaleType: "band", data: COLS, categoryGapRatio: 0.18 }]}
      yAxis={[{ scaleType: "band", data: ROWS, categoryGapRatio: 0.18 }]}
    >
      {/* Chart title */}
      <text
        x={W / 2}
        y={44}
        textAnchor="middle"
        fontSize={22}
        fontWeight="500"
        fill={t.ink}
        fontFamily={FONT}
      >
        {TITLE}
      </text>

      {/* The waffle grid — 100 squares, one per percentage point */}
      <ScatterPlot slots={{ scatter: WaffleSquares }} />

      <ChartsLegend
        position={{ horizontal: "right", vertical: "middle" }}
        direction="column"
        itemMarkWidth={26}
        itemMarkHeight={26}
        markGap={14}
        itemGap={22}
        // "middle" centers within [padding.top, H - padding.bottom] — bias the
        // padding so that band's midpoint lands on the grid's true vertical
        // center (which sits below the title, not the full canvas center).
        padding={{ top: 0, right: 24, bottom: Math.max(0, H - 2 * gridCenterY), left: 0 }}
        labelStyle={{ fontSize: 20, fill: t.ink, fontFamily: FONT }}
      />
    </ChartContainer>
  );
}
Runnable source as JSON, for any HTTP client: https://api.anyplot.ai/specs/waffle-basic/muix/code. Any spec id and library id listed in llms-full.txt fit the same URL shape; every URL below is complete and callable.
{
  "spec_id": "waffle-basic",
  "language": "javascript",
  "library": "muix",
  "page": "https://anyplot.ai/waffle-basic/javascript/muix",
  "hub": "https://anyplot.ai/waffle-basic",
  "code_json": "https://api.anyplot.ai/specs/waffle-basic/muix/code",
  "spec_json": "https://api.anyplot.ai/specs/waffle-basic",
  "render_light_png": "https://storage.googleapis.com/anyplot-images/plots/waffle-basic/javascript/muix/plot-light.png",
  "render_dark_png": "https://storage.googleapis.com/anyplot-images/plots/waffle-basic/javascript/muix/plot-dark.png",
  "interactive_light_html": "https://storage.googleapis.com/anyplot-images/plots/waffle-basic/javascript/muix/plot-light.html",
  "interactive_dark_html": "https://storage.googleapis.com/anyplot-images/plots/waffle-basic/javascript/muix/plot-dark.html",
  "quality_score": 89.0,
  "license": "MIT",
  "guide": "https://anyplot.ai/llms.txt"
}
Part of Basic Waffle Chart on anyplot.ai.