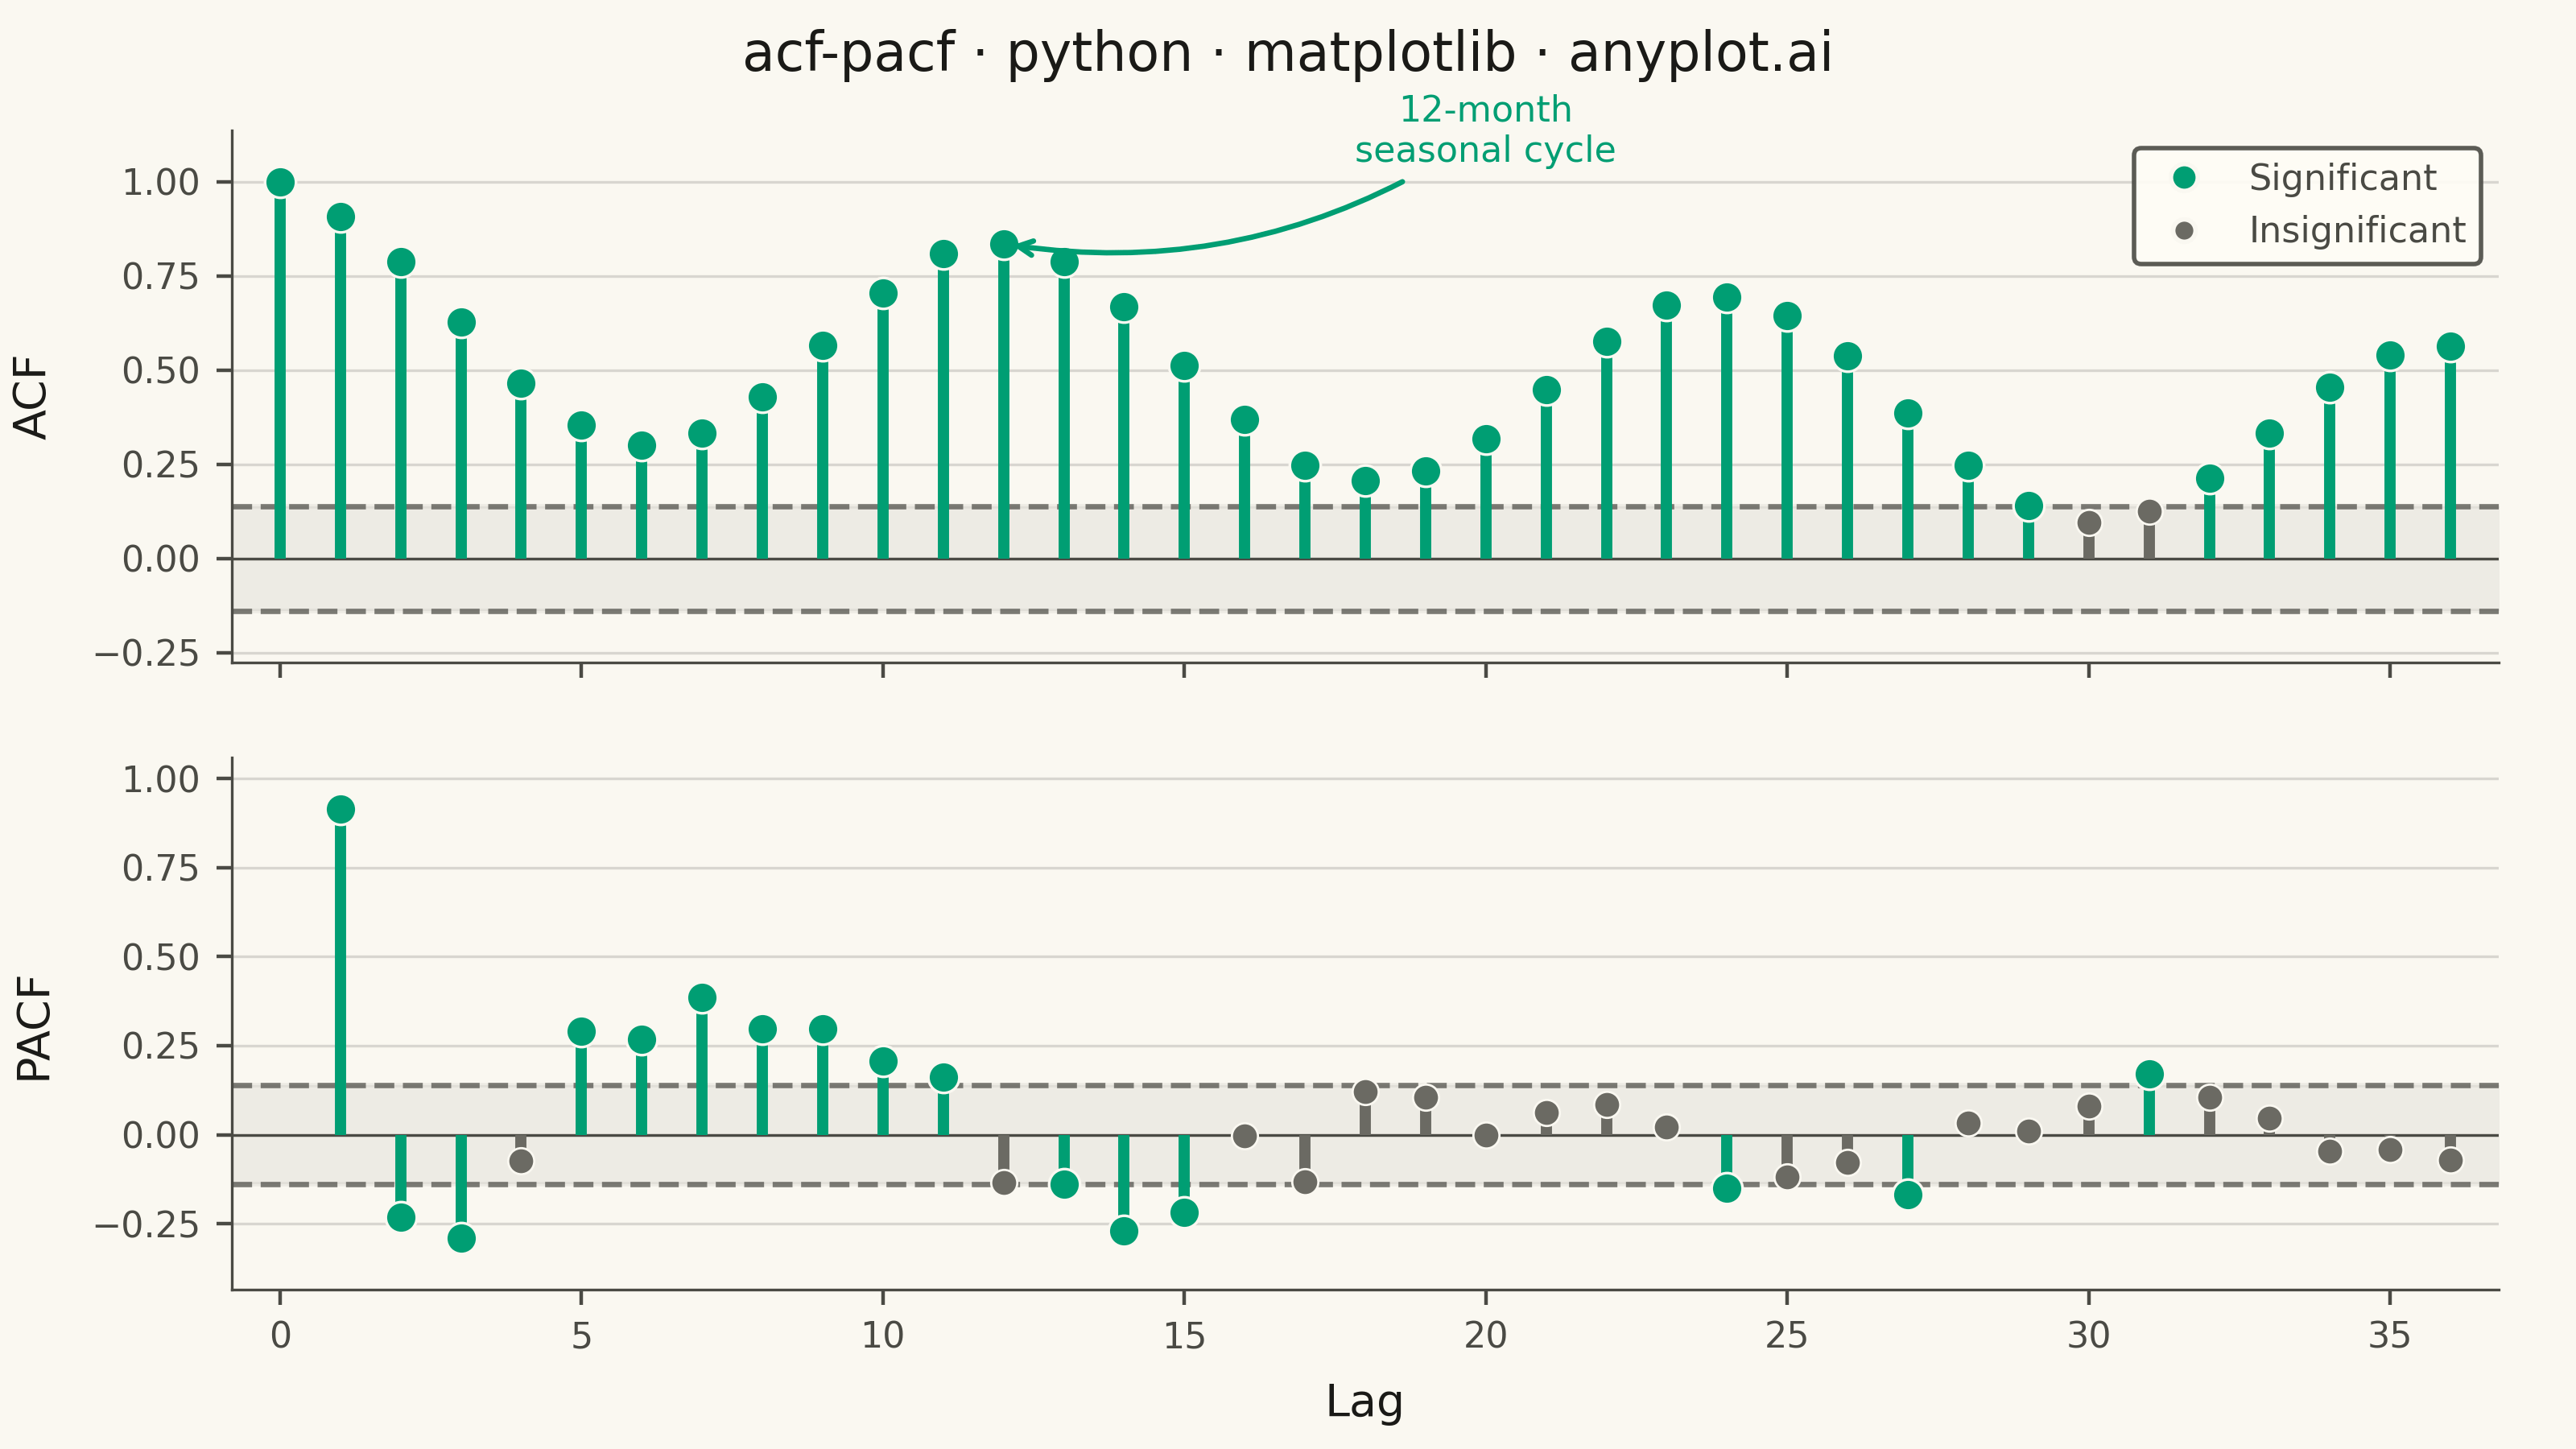
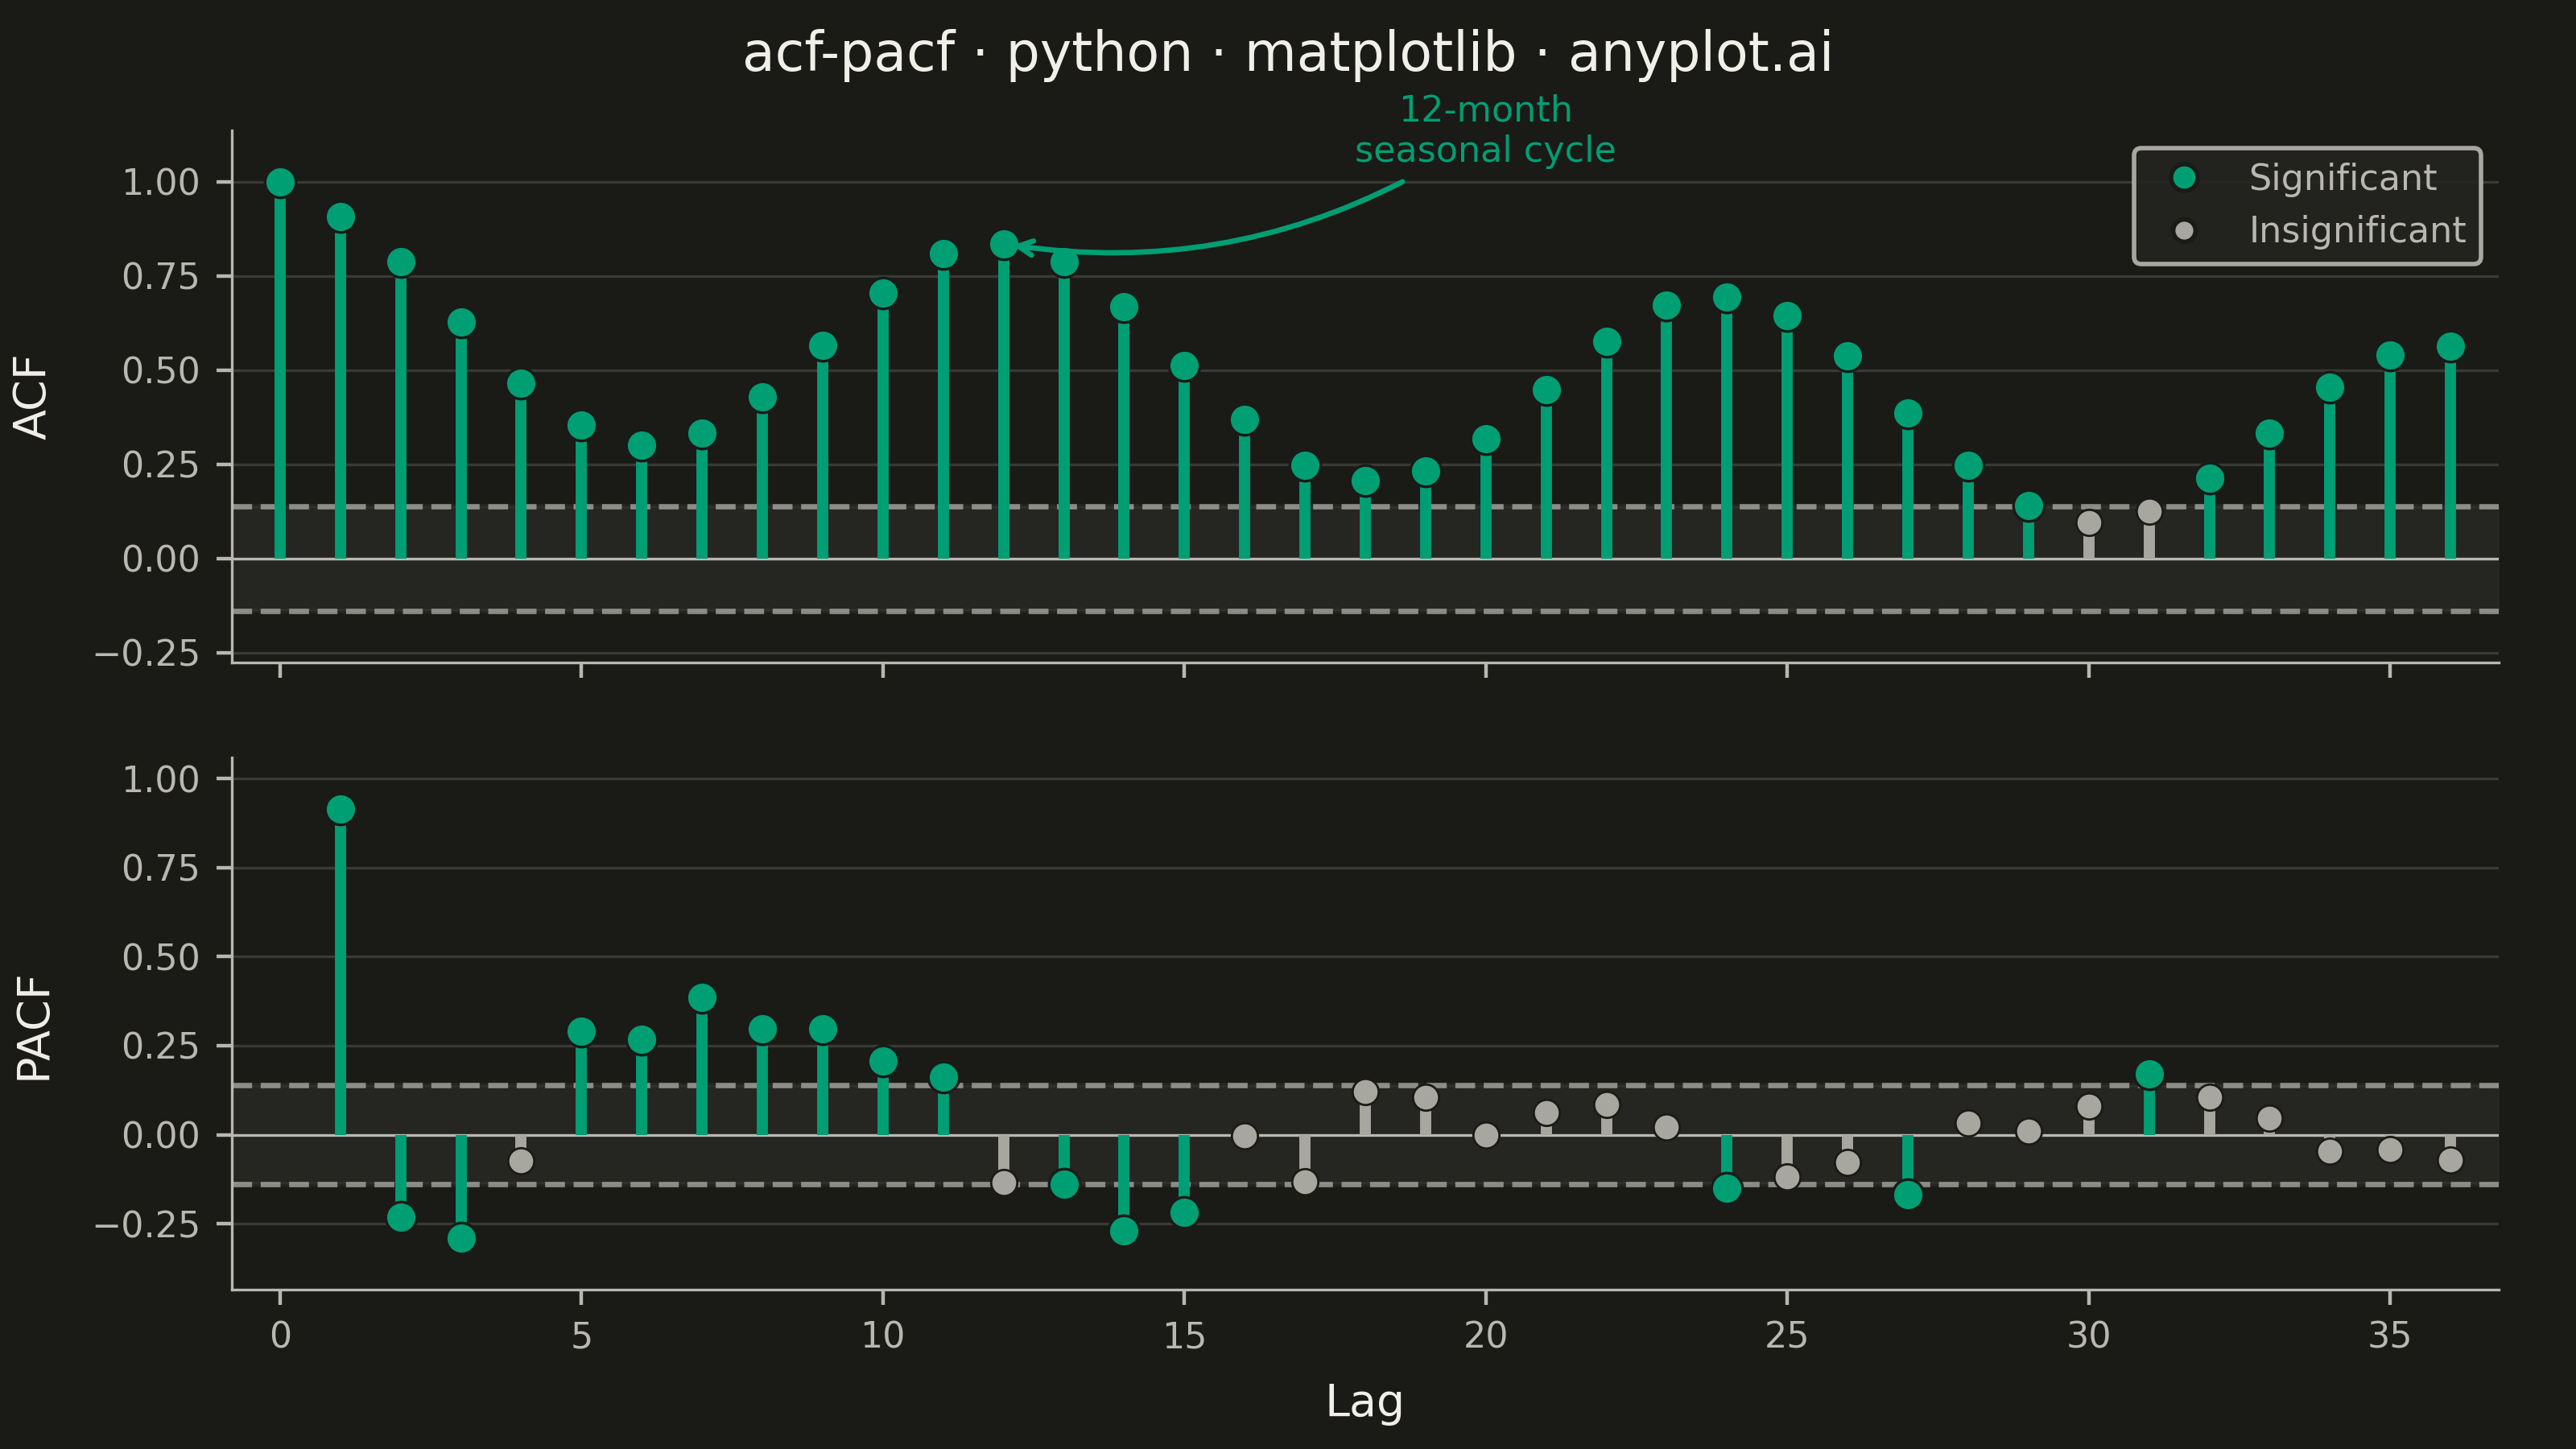
Displays the autocorrelation function (ACF) and partial autocorrelation function (PACF) of a time series as vertical stem/bar plots arranged in two vertically stacked subplots. Each lag is represented by a vertical line from zero to the correlation value, with horizontal dashed lines indicating 95% confidence bounds. These plots are essential for identifying the order of AR and MA components in ARIMA modeling and for diagnosing residual independence.
Preview render from the Matplotlib implementation.