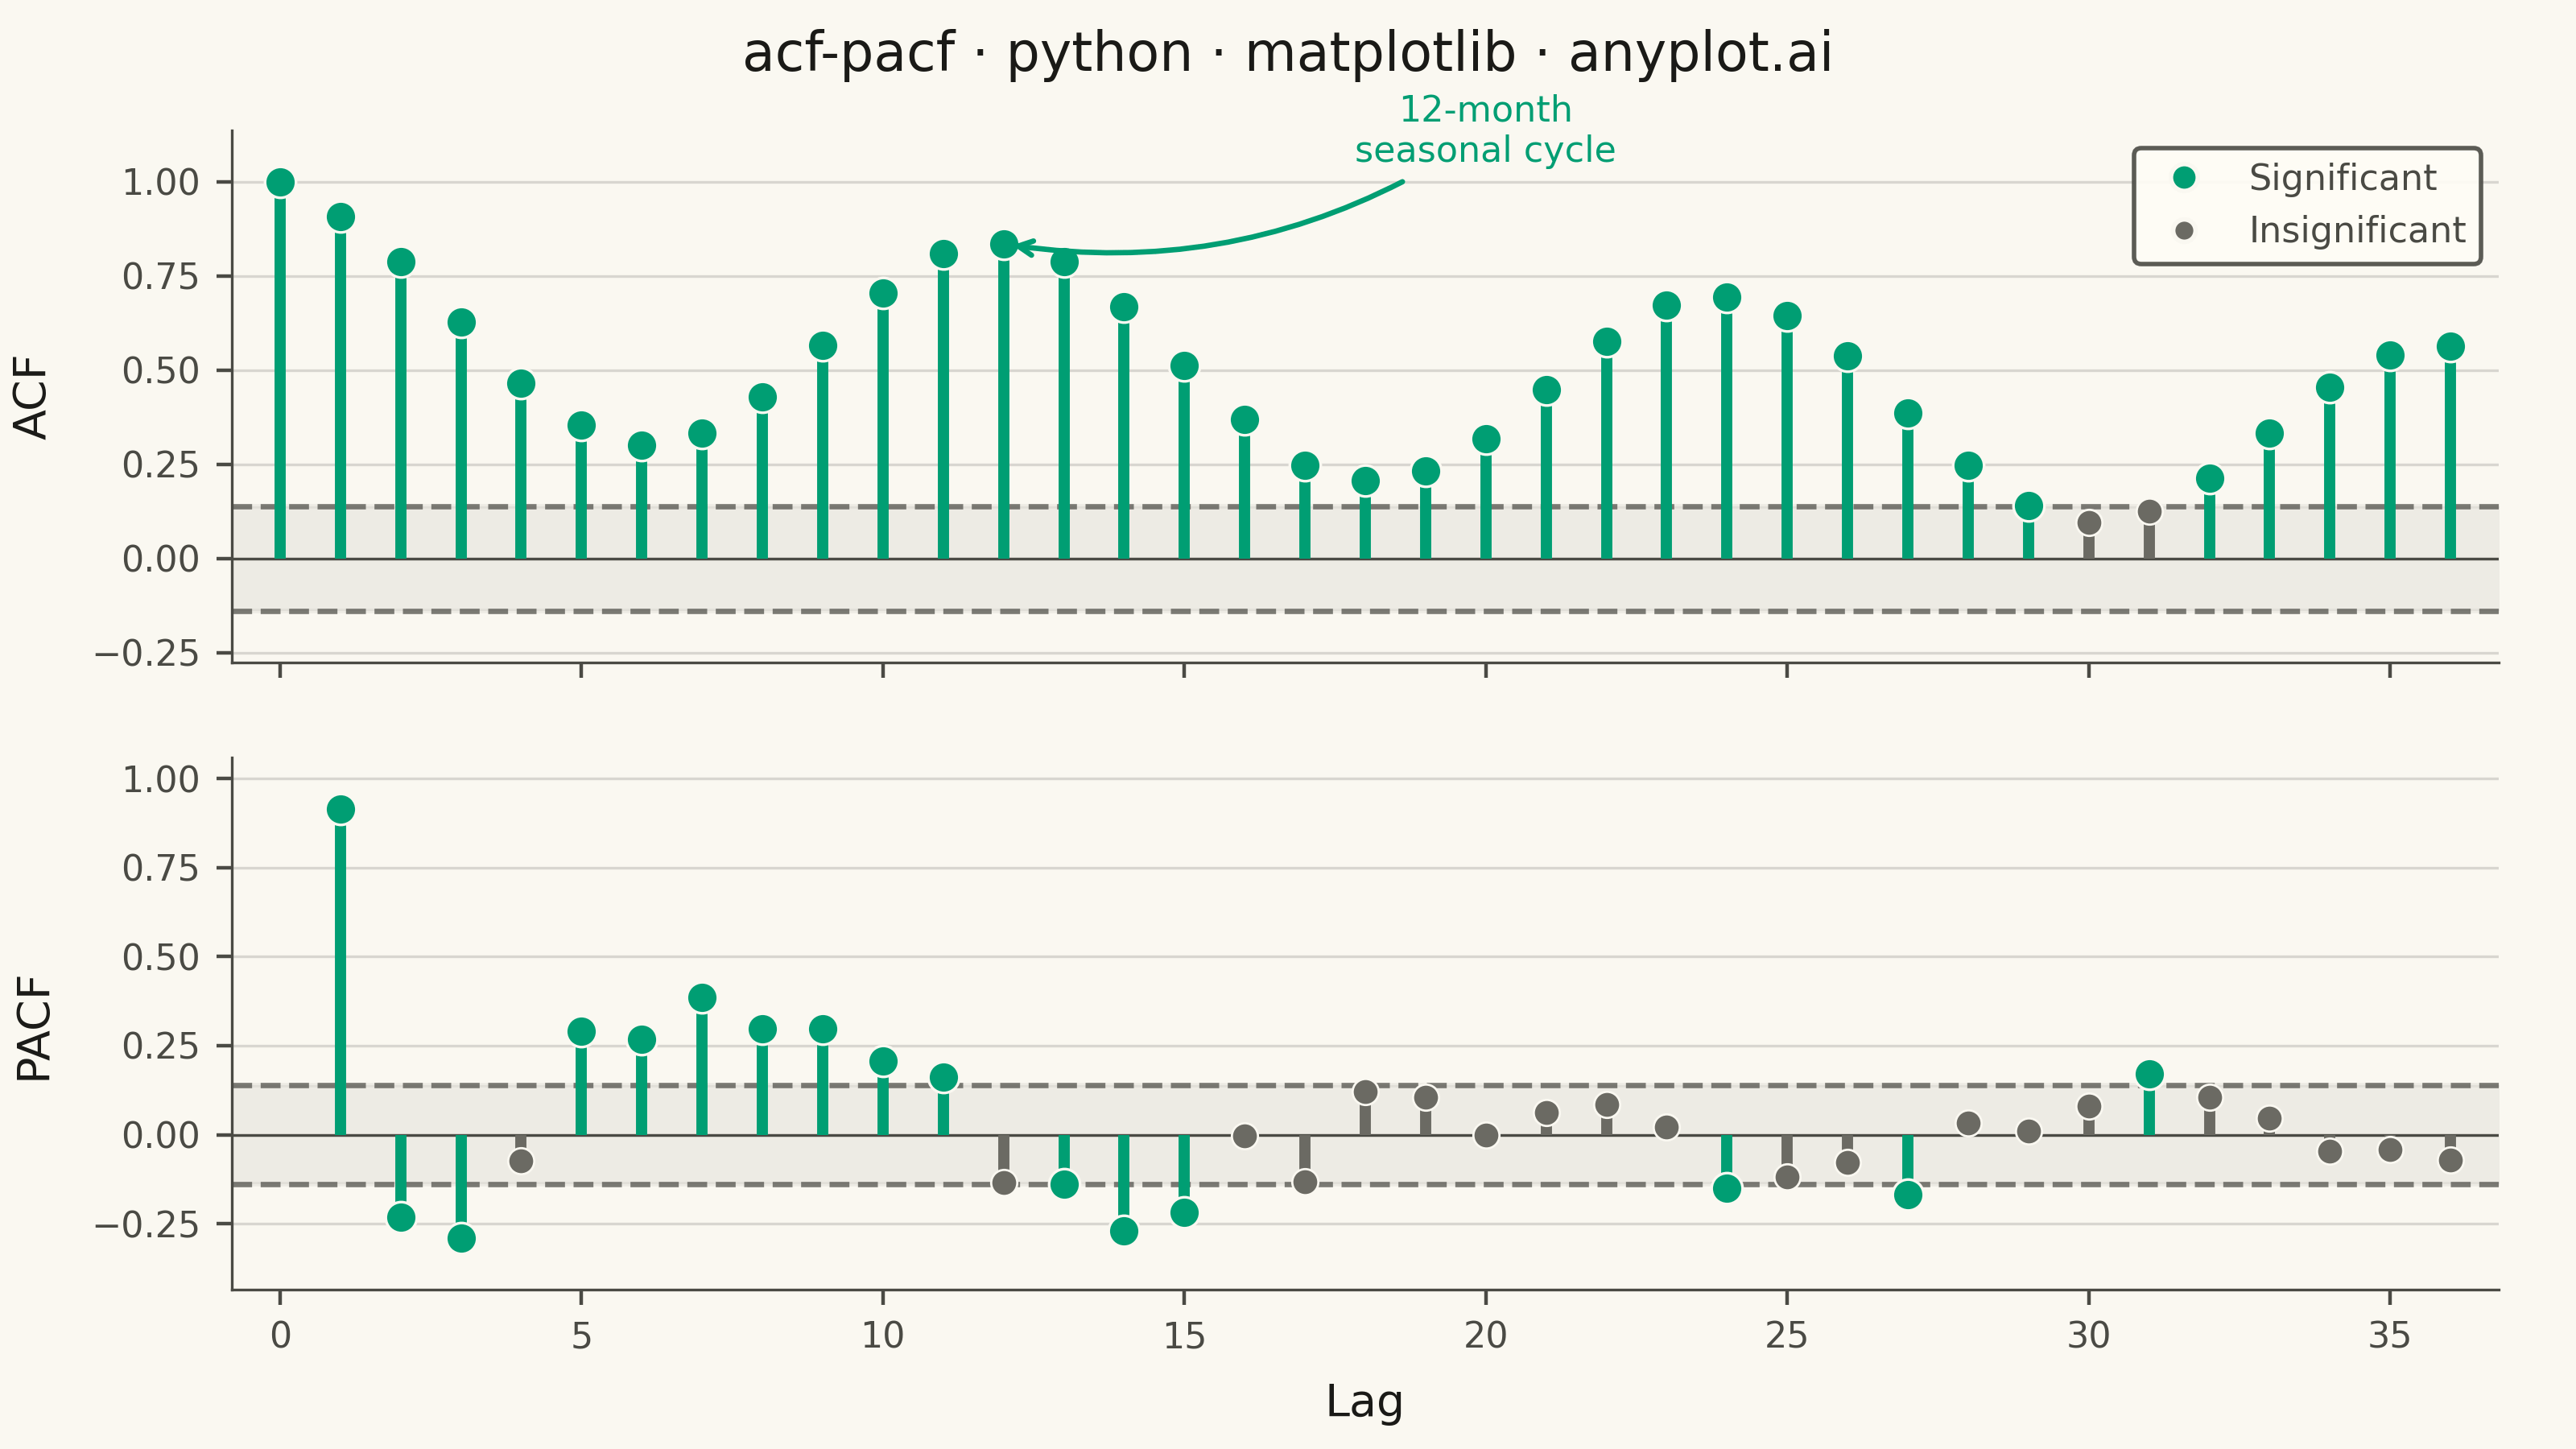
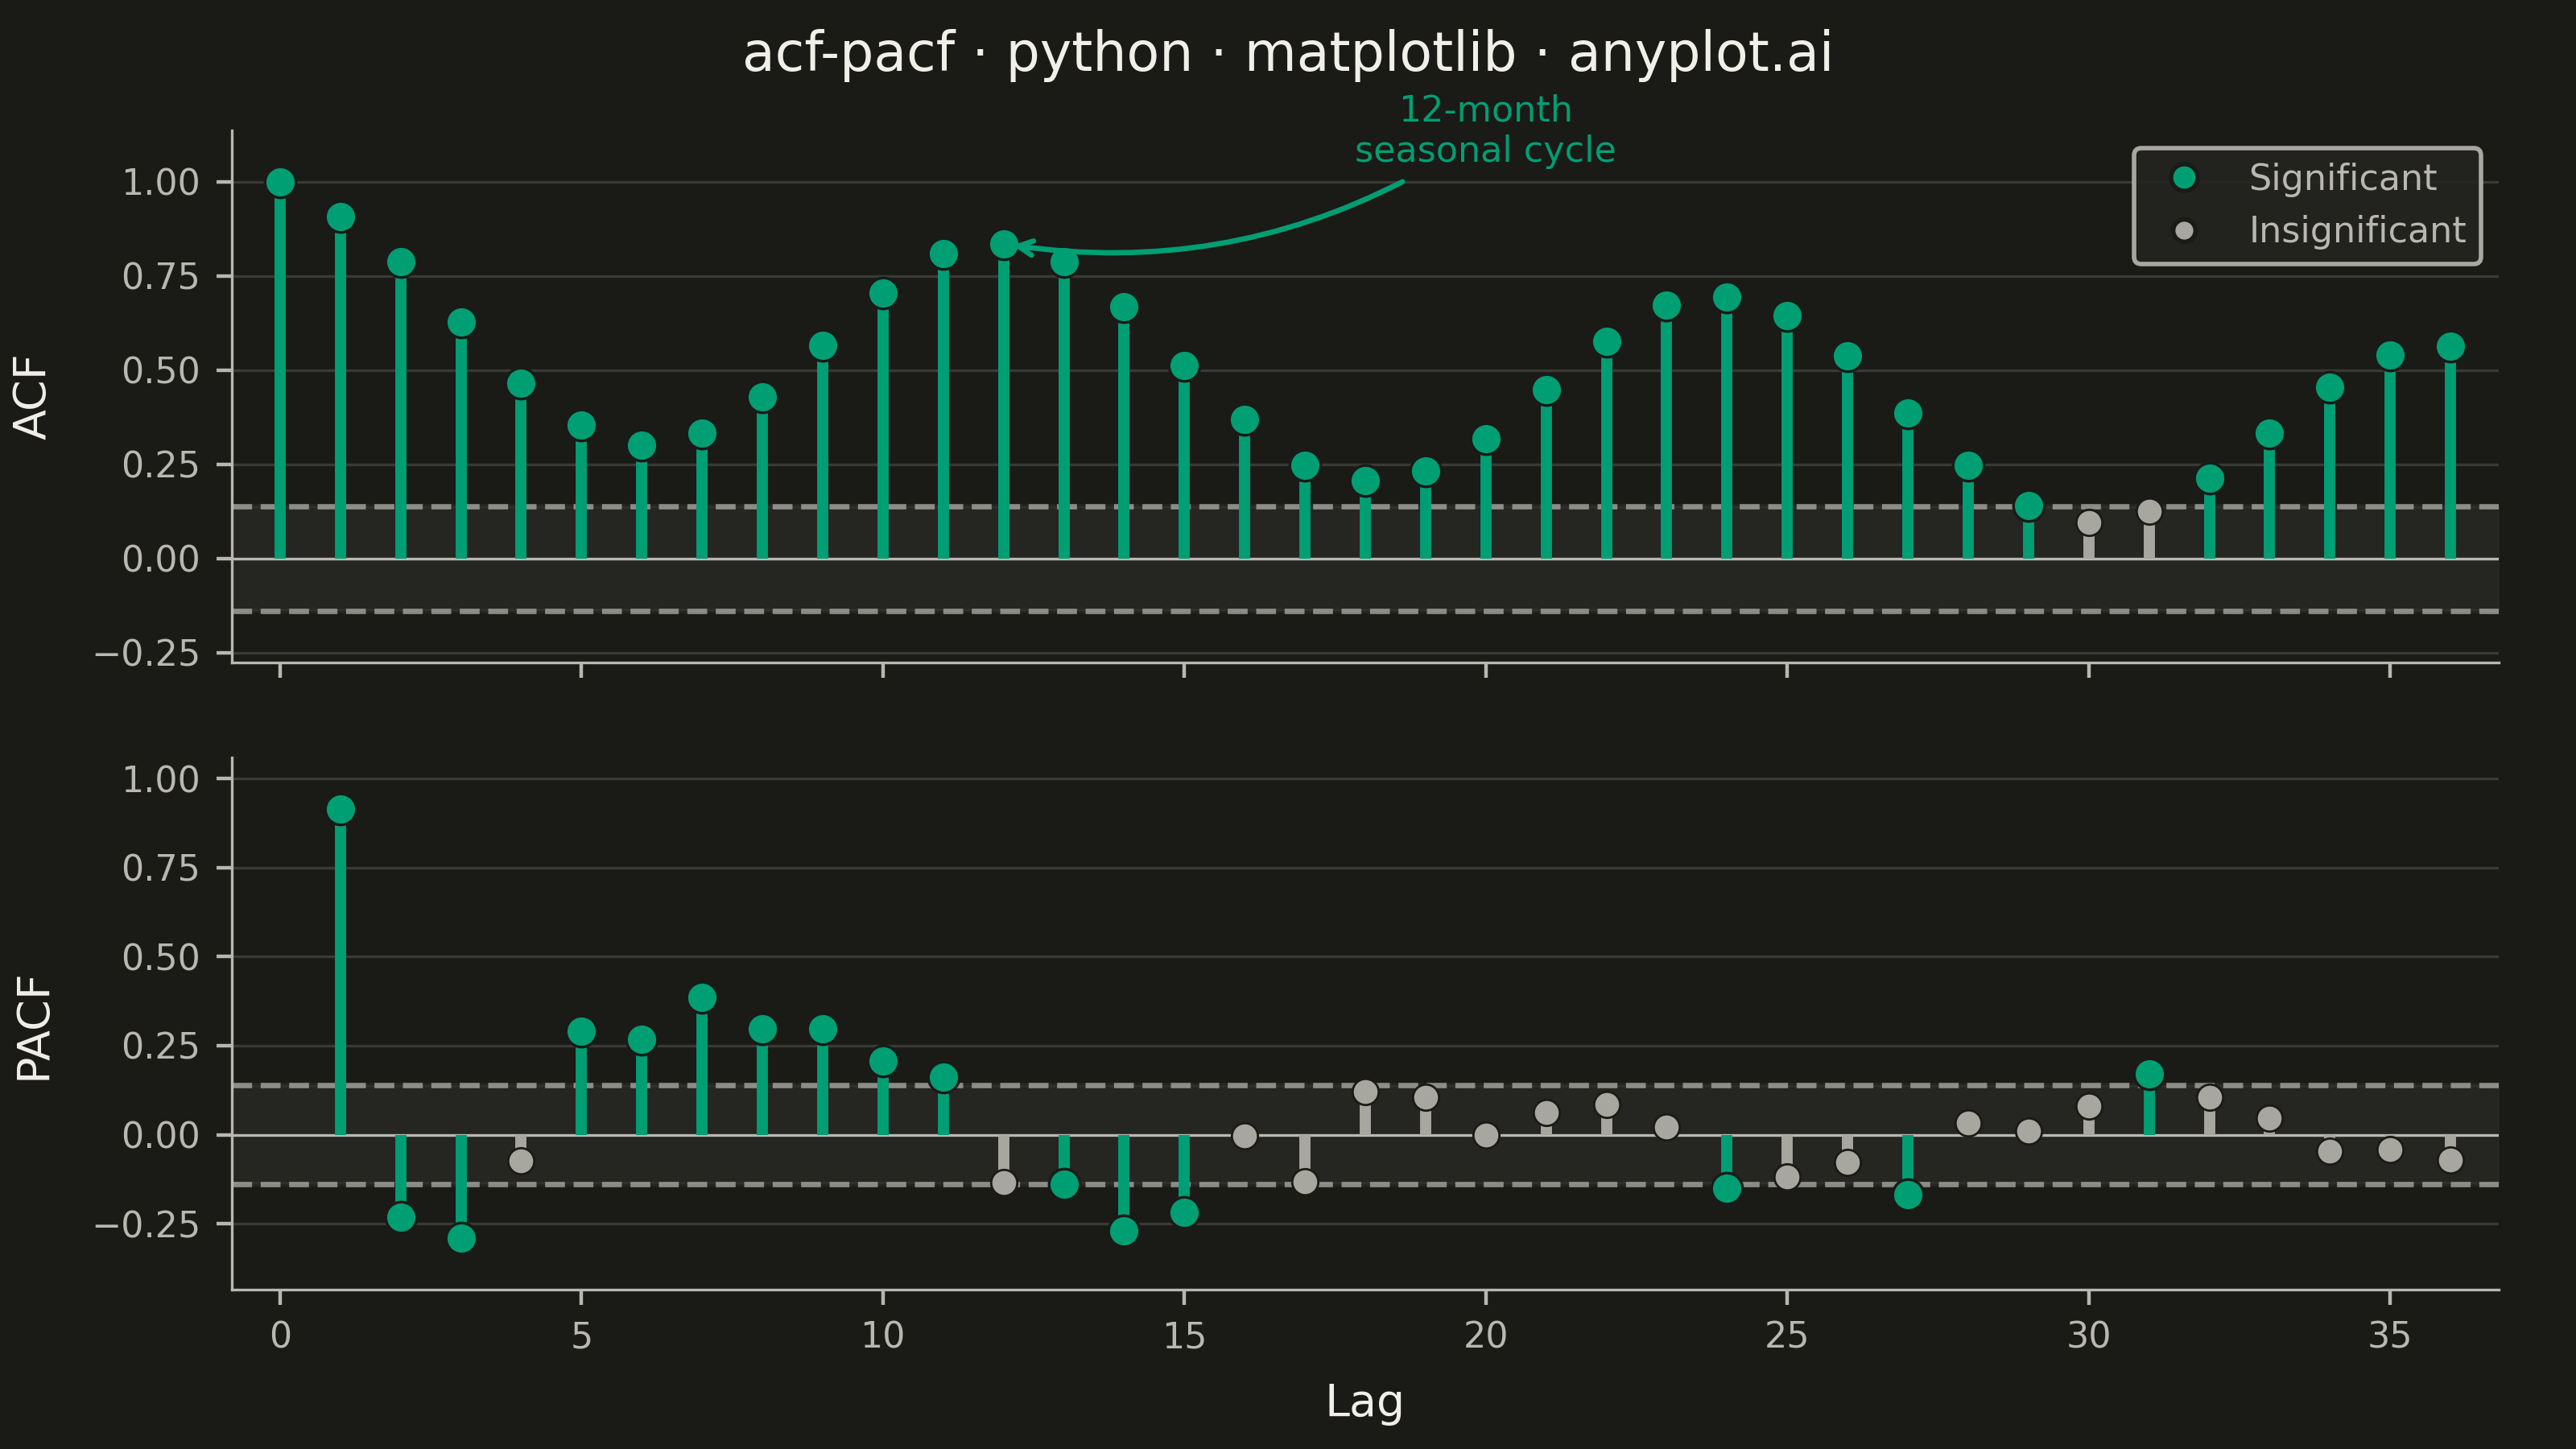
Displays the autocorrelation function (ACF) and partial autocorrelation function (PACF) of a time series as vertical stem/bar plots arranged in two vertically stacked subplots. Each lag is represented by a vertical line from zero to the correlation value, with horizontal dashed lines indicating 95% confidence bounds. These plots are essential for identifying the order of AR and MA components in ARIMA modeling and for diagnosing residual independence.
""" anyplot.ai
acf-pacf: Autocorrelation and Partial Autocorrelation (ACF/PACF) Plot
Library: matplotlib 3.10.9 | Python 3.13.13
Quality: 92/100 | Updated: 2026-06-10
"""

import os

import matplotlib.pyplot as plt
import numpy as np
from matplotlib.collections import LineCollection
from matplotlib.lines import Line2D
from statsmodels.tsa.stattools import acf, pacf


# Theme tokens (Imprint palette — see prompts/default-style-guide.md)
THEME = os.getenv("ANYPLOT_THEME", "light")
PAGE_BG = "#FAF8F1" if THEME == "light" else "#1A1A17"
ELEVATED_BG = "#FFFDF6" if THEME == "light" else "#242420"
INK = "#1A1A17" if THEME == "light" else "#F0EFE8"
INK_SOFT = "#4A4A44" if THEME == "light" else "#B8B7B0"
INK_MUTED = "#6B6A63" if THEME == "light" else "#A8A79F"
BRAND = "#009E73"  # Imprint position 1 — significant lags

# Data — synthetic monthly airline-style passenger counts with trend + seasonality
np.random.seed(42)
n_obs = 200
t = np.arange(n_obs)
passengers = 100 + 0.5 * t + 30 * np.sin(2 * np.pi * t / 12) + np.random.normal(0, 8, n_obs)

# Compute ACF and PACF
n_lags = 36
acf_values, _ = acf(passengers, nlags=n_lags, alpha=0.05)
pacf_values, _ = pacf(passengers, nlags=n_lags, alpha=0.05)

acf_lags = np.arange(len(acf_values))
pacf_lags = np.arange(1, len(pacf_values))

# 95% confidence bound
confidence_bound = 1.96 / np.sqrt(n_obs)

# Classify significance
acf_sig = np.abs(acf_values) > confidence_bound
pacf_sig = np.abs(pacf_values[1:]) > confidence_bound

# Title — 43 chars < 67 baseline, no scaling needed
title = "acf-pacf · python · matplotlib · anyplot.ai"
title_fontsize = 12

# Plot — landscape 3200 × 1800 px (figsize=(8, 4.5) × dpi=400)
fig, (ax1, ax2) = plt.subplots(2, 1, figsize=(8, 4.5), dpi=400, sharex=True, facecolor=PAGE_BG)
ax1.set_facecolor(PAGE_BG)
ax2.set_facecolor(PAGE_BG)

# --- ACF (top subplot) ---
acf_colors = [BRAND if s else INK_MUTED for s in acf_sig]
acf_segments = [[(lag, 0), (lag, val)] for lag, val in zip(acf_lags, acf_values, strict=False)]
ax1.add_collection(LineCollection(acf_segments, colors=acf_colors, linewidths=2.5, zorder=3))

if acf_sig.any():
    ax1.scatter(acf_lags[acf_sig], acf_values[acf_sig], color=BRAND, s=48, zorder=5, edgecolors=PAGE_BG, linewidths=0.6)
if (~acf_sig).any():
    ax1.scatter(
        acf_lags[~acf_sig], acf_values[~acf_sig], color=INK_MUTED, s=34, zorder=5, edgecolors=PAGE_BG, linewidths=0.5
    )

ax1.axhline(y=0, color=INK_SOFT, linewidth=0.6, zorder=2)
ax1.axhline(y=confidence_bound, color=INK_SOFT, linestyle="--", linewidth=1.2, alpha=0.7)
ax1.axhline(y=-confidence_bound, color=INK_SOFT, linestyle="--", linewidth=1.2, alpha=0.7)
x_fill = np.array([-1, n_lags + 1], dtype=float)
ax1.fill_between(x_fill, -confidence_bound, confidence_bound, color=INK_SOFT, alpha=0.07, zorder=1)

# Annotation — 12-month seasonal spike (genuine insight, not decorative)
ax1.annotate(
    "12-month\nseasonal cycle",
    xy=(12, acf_values[12]),
    xytext=(20, acf_values[12] + 0.20),
    fontsize=8,
    fontweight="medium",
    color=BRAND,
    arrowprops={"arrowstyle": "->", "color": BRAND, "lw": 1.2, "connectionstyle": "arc3,rad=-0.2"},
    ha="center",
    va="bottom",
    zorder=6,
)

ax1.set_ylabel("ACF", fontsize=10, fontweight="medium", color=INK, labelpad=8)
ax1.tick_params(axis="both", labelsize=8, colors=INK_SOFT, labelcolor=INK_SOFT)
ax1.spines["top"].set_visible(False)
ax1.spines["right"].set_visible(False)
for spine in ("left", "bottom"):
    ax1.spines[spine].set_color(INK_SOFT)
    ax1.spines[spine].set_linewidth(0.6)
ax1.yaxis.grid(True, alpha=0.15, linewidth=0.6, color=INK)
ax1.set_xlim(-0.8, n_lags + 0.8)
ax1.margins(y=0.12)

# Legend for significant / insignificant distinction
legend_handles = [
    Line2D(
        [0],
        [0],
        marker="o",
        color="none",
        markerfacecolor=BRAND,
        markeredgecolor=PAGE_BG,
        markersize=6,
        label="Significant",
    ),
    Line2D(
        [0],
        [0],
        marker="o",
        color="none",
        markerfacecolor=INK_MUTED,
        markeredgecolor=PAGE_BG,
        markersize=5,
        label="Insignificant",
    ),
]
leg = ax1.legend(handles=legend_handles, fontsize=8, loc="upper right", framealpha=0.9, edgecolor=INK_SOFT)
leg.get_frame().set_facecolor(ELEVATED_BG)
leg.get_frame().set_edgecolor(INK_SOFT)
plt.setp(leg.get_texts(), color=INK_SOFT)

# --- PACF (bottom subplot) — starts from lag 1 ---
pacf_vals = pacf_values[1:]
pacf_colors = [BRAND if s else INK_MUTED for s in pacf_sig]
pacf_segments = [[(lag, 0), (lag, val)] for lag, val in zip(pacf_lags, pacf_vals, strict=False)]
ax2.add_collection(LineCollection(pacf_segments, colors=pacf_colors, linewidths=2.5, zorder=3))

if pacf_sig.any():
    ax2.scatter(
        pacf_lags[pacf_sig], pacf_vals[pacf_sig], color=BRAND, s=48, zorder=5, edgecolors=PAGE_BG, linewidths=0.6
    )
if (~pacf_sig).any():
    ax2.scatter(
        pacf_lags[~pacf_sig], pacf_vals[~pacf_sig], color=INK_MUTED, s=34, zorder=5, edgecolors=PAGE_BG, linewidths=0.5
    )

ax2.axhline(y=0, color=INK_SOFT, linewidth=0.6, zorder=2)
ax2.axhline(y=confidence_bound, color=INK_SOFT, linestyle="--", linewidth=1.2, alpha=0.7)
ax2.axhline(y=-confidence_bound, color=INK_SOFT, linestyle="--", linewidth=1.2, alpha=0.7)
ax2.fill_between(x_fill, -confidence_bound, confidence_bound, color=INK_SOFT, alpha=0.07, zorder=1)

ax2.set_ylabel("PACF", fontsize=10, fontweight="medium", color=INK, labelpad=8)
ax2.set_xlabel("Lag", fontsize=10, fontweight="medium", color=INK, labelpad=6)
ax2.tick_params(axis="both", labelsize=8, colors=INK_SOFT, labelcolor=INK_SOFT)
ax2.tick_params(axis="x", which="both", bottom=True)
ax2.spines["top"].set_visible(False)
ax2.spines["right"].set_visible(False)
for spine in ("left", "bottom"):
    ax2.spines[spine].set_color(INK_SOFT)
    ax2.spines[spine].set_linewidth(0.6)
ax2.yaxis.grid(True, alpha=0.15, linewidth=0.6, color=INK)
ax2.margins(y=0.12)

# Title and layout
fig.suptitle(title, fontsize=title_fontsize, fontweight="medium", color=INK, y=0.98)
fig.subplots_adjust(top=0.91, bottom=0.11, left=0.09, right=0.97, hspace=0.18)

# Save — bbox_inches must stay default (None) to preserve exact 3200×1800 canvas
plt.savefig(f"plot-{THEME}.png", dpi=400, facecolor=PAGE_BG)
Runnable source as JSON, for any HTTP client: https://api.anyplot.ai/specs/acf-pacf/matplotlib/code. Any spec id and library id listed in llms-full.txt fit the same URL shape; every URL below is complete and callable.
{
  "spec_id": "acf-pacf",
  "language": "python",
  "library": "matplotlib",
  "page": "https://anyplot.ai/acf-pacf/python/matplotlib",
  "hub": "https://anyplot.ai/acf-pacf",
  "code_json": "https://api.anyplot.ai/specs/acf-pacf/matplotlib/code",
  "spec_json": "https://api.anyplot.ai/specs/acf-pacf",
  "render_light_png": "https://storage.googleapis.com/anyplot-images/plots/acf-pacf/python/matplotlib/plot-light.png",
  "render_dark_png": "https://storage.googleapis.com/anyplot-images/plots/acf-pacf/python/matplotlib/plot-dark.png",
  "quality_score": 92.0,
  "license": "MIT",
  "guide": "https://anyplot.ai/llms.txt"
}
Part of Autocorrelation and Partial Autocorrelation (ACF/PACF) Plot on anyplot.ai.