The same plot in 14 other libraries — Python: Altair, Bokeh, lets-plot, Matplotlib, Plotly, plotnine, Pygal, Seaborn; R: ggplot2; JavaScript: Chart.js, D3.js, Apache ECharts, Highcharts, MUI X Charts. Compare all 15 side by side: Autocorrelation and Partial Autocorrelation (ACF/PACF) Plot in Python, R, Julia and JavaScript.
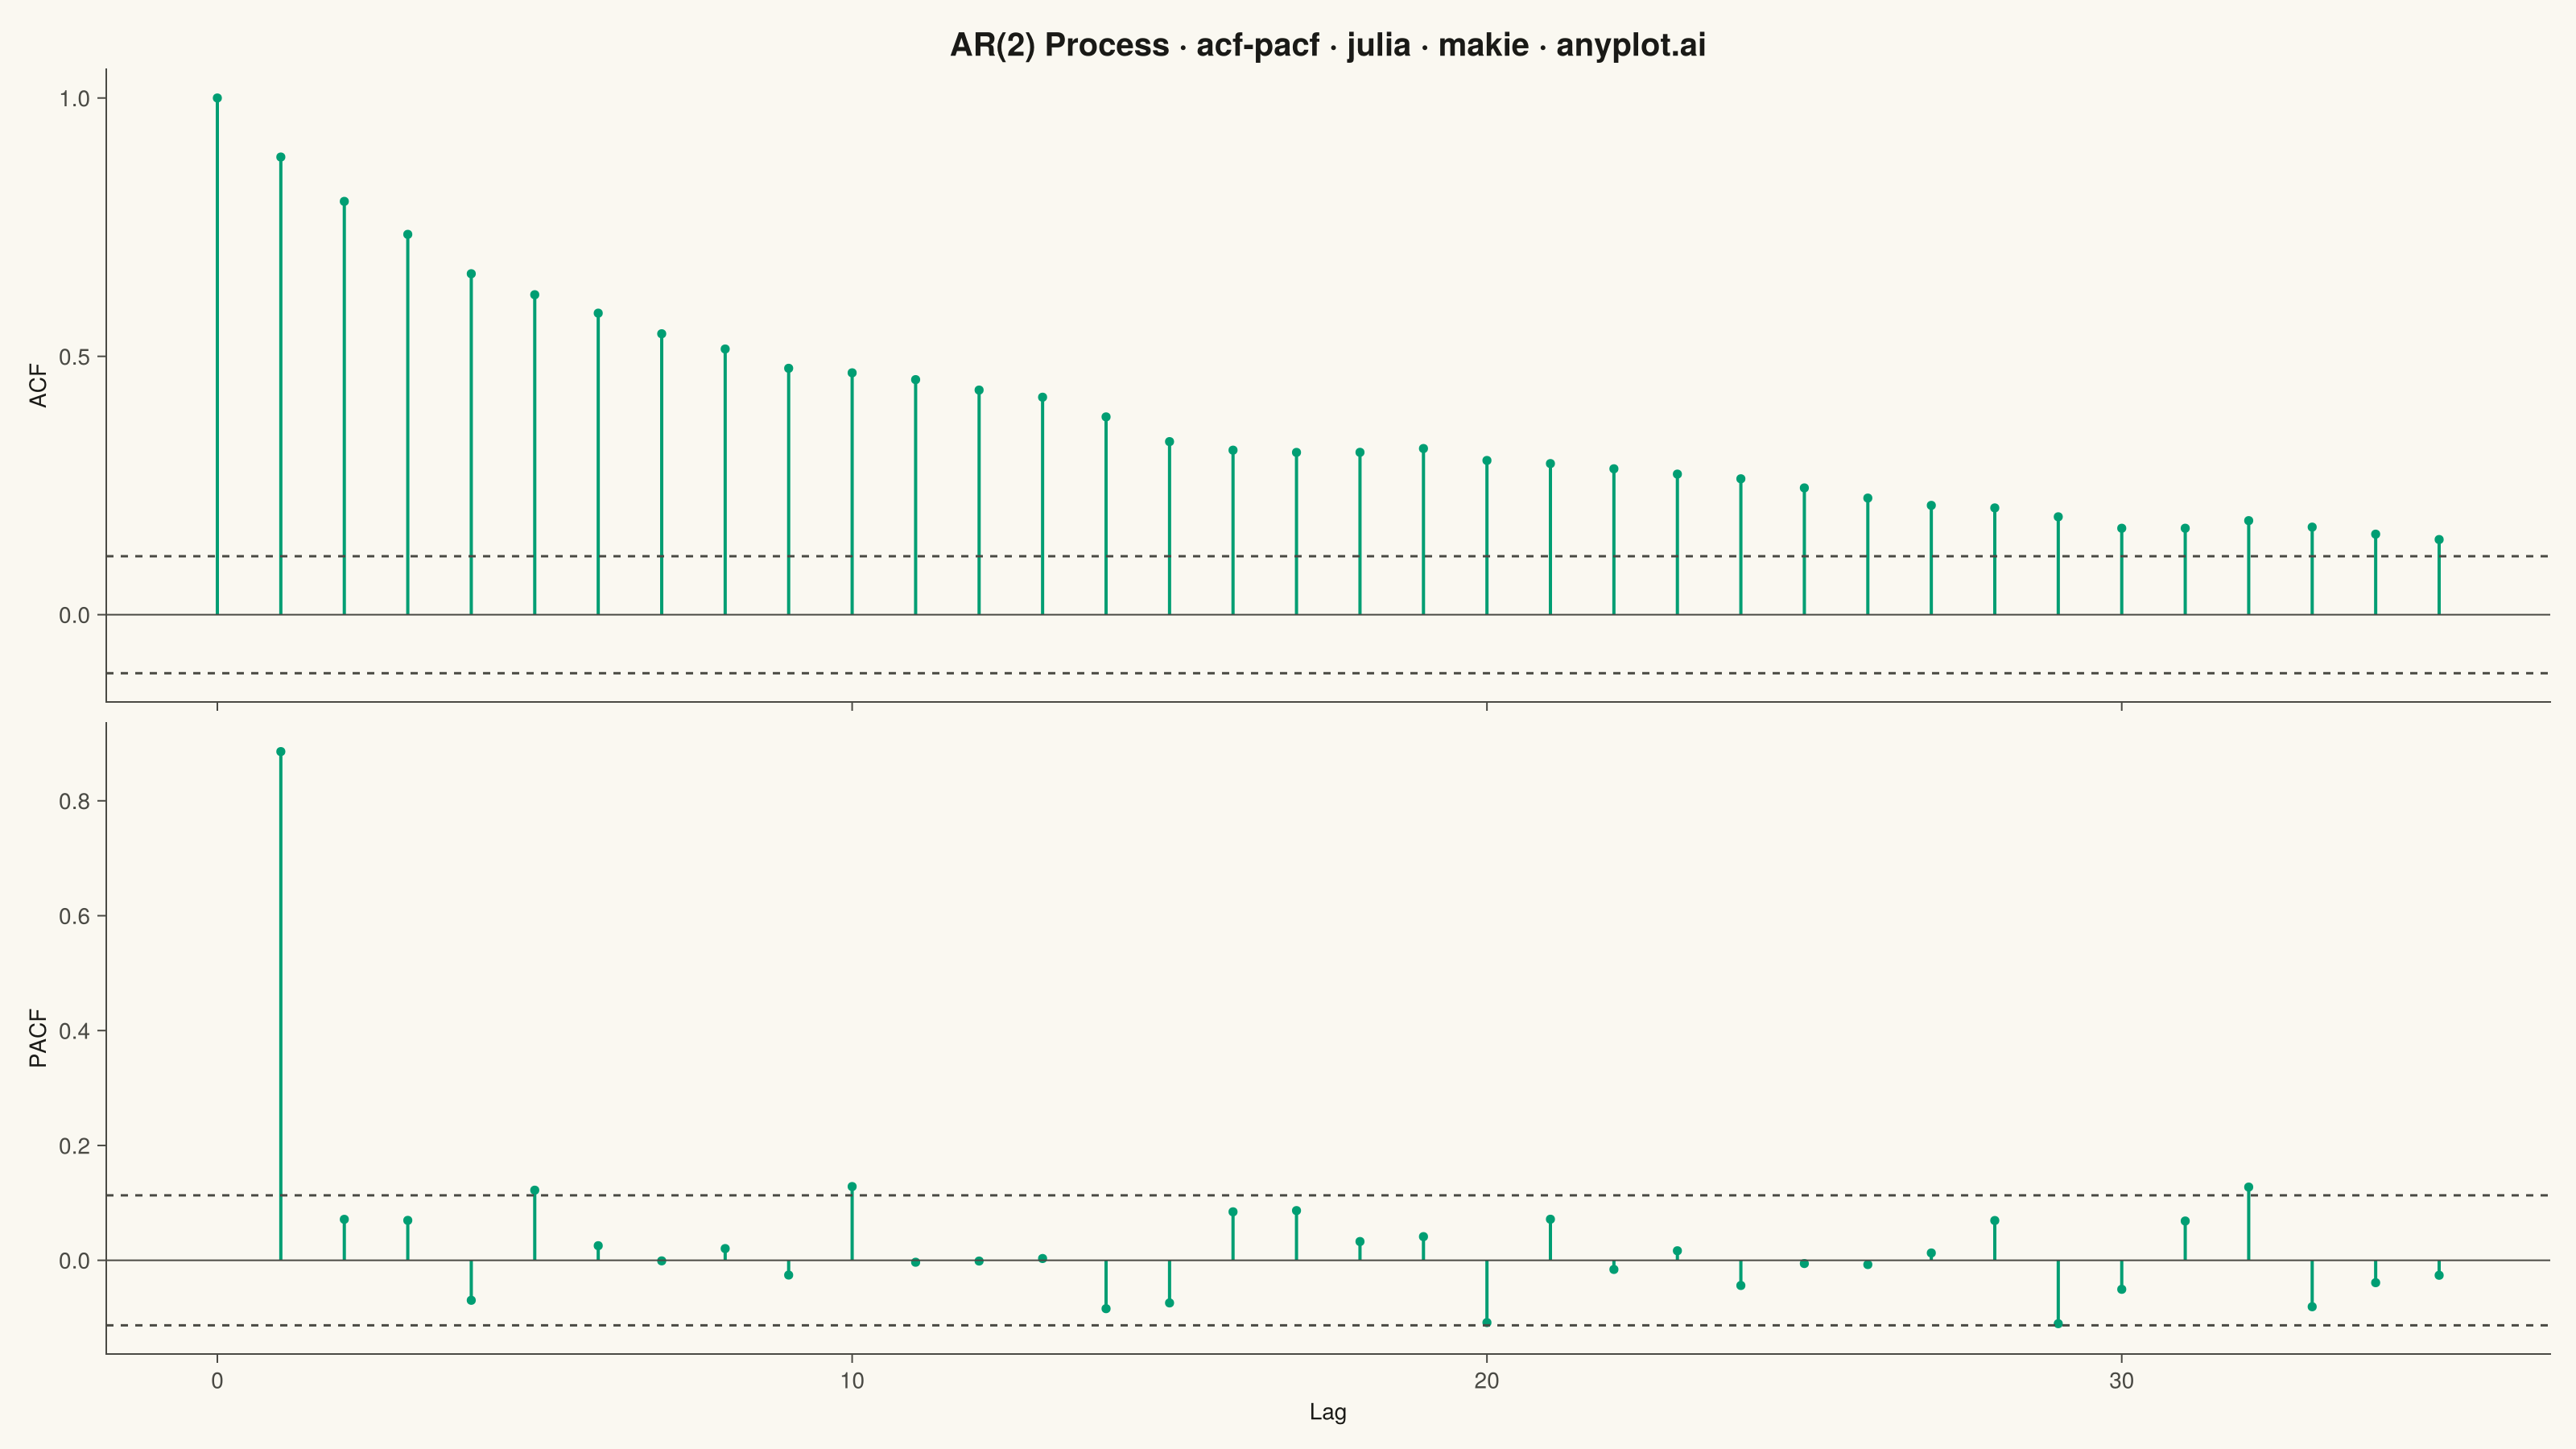
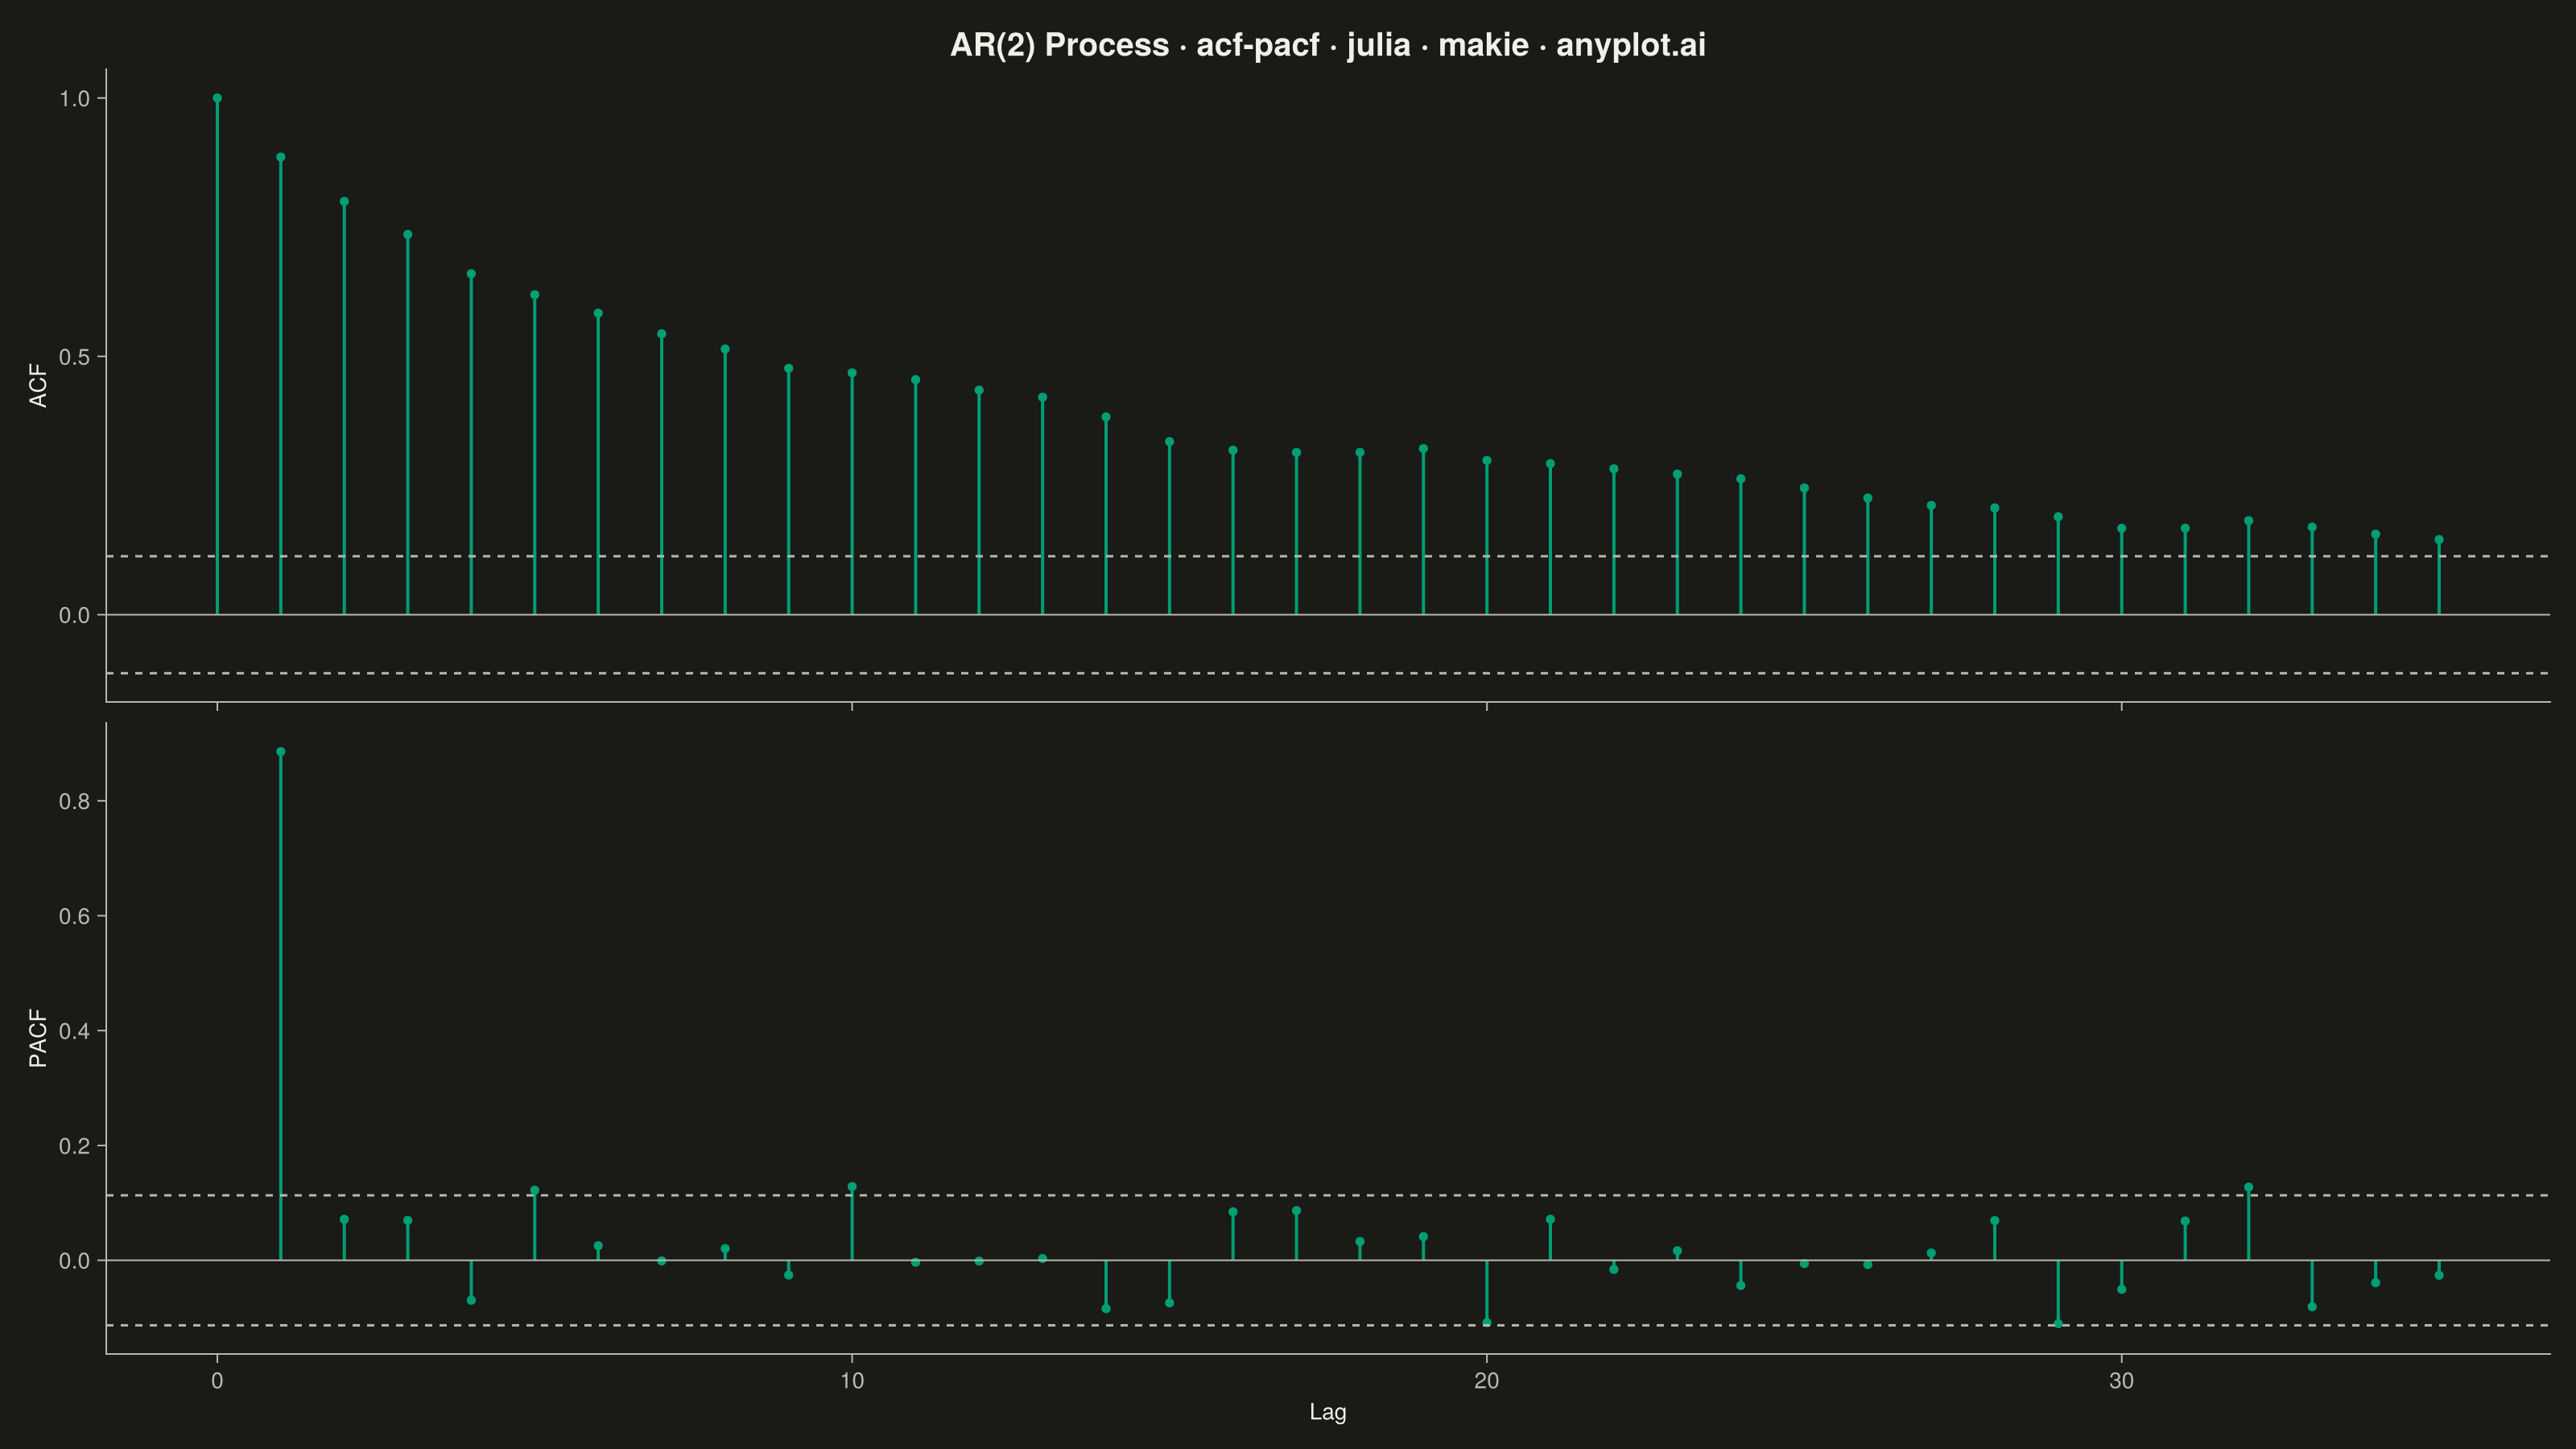
Displays the autocorrelation function (ACF) and partial autocorrelation function (PACF) of a time series as vertical stem/bar plots arranged in two vertically stacked subplots. Each lag is represented by a vertical line from zero to the correlation value, with horizontal dashed lines indicating 95% confidence bounds. These plots are essential for identifying the order of AR and MA components in ARIMA modeling and for diagnosing residual independence.
# anyplot.ai
# acf-pacf: Autocorrelation and Partial Autocorrelation (ACF/PACF) Plot
# Library: makie 0.22.10 | Julia 1.11.9
# Quality: 86/100 | Created: 2026-06-10

using CairoMakie
using Colors
using Random
using Statistics

Random.seed!(42)

# Theme tokens
const THEME     = get(ENV, "ANYPLOT_THEME", "light")
const PAGE_BG   = THEME == "light" ? colorant"#FAF8F1" : colorant"#1A1A17"
const INK       = THEME == "light" ? colorant"#1A1A17" : colorant"#F0EFE8"
const INK_SOFT  = THEME == "light" ? colorant"#4A4A44" : colorant"#B8B7B0"
const IMPRINT_PALETTE = [
    colorant"#009E73", colorant"#C475FD", colorant"#4467A3", colorant"#BD8233",
    colorant"#AE3030", colorant"#2ABCCD", colorant"#954477", colorant"#99B314",
]

# Data: AR(2) time series — monthly economic indicator
# x[t] = 0.7*x[t-1] + 0.2*x[t-2] + noise  (φ₁=0.7, φ₂=0.2)
# PACF cuts off at lag 2; ACF decays as a mixture of exponentials
n_obs = 300
series = zeros(n_obs)
series[1] = randn()
series[2] = 0.7 * series[1] + randn()
for t in 3:n_obs
    series[t] = 0.7 * series[t-1] + 0.2 * series[t-2] + randn()
end

# ACF (lags 0 through max_lag)
max_lag = 35
s_mean = mean(series)
s_var  = sum((v - s_mean)^2 for v in series) / n_obs
acf_vals = [sum((series[i] - s_mean) * (series[i-k] - s_mean) for i in (k+1):n_obs) / (n_obs * s_var)
            for k in 0:max_lag]

# PACF via Levinson-Durbin recursion
phi       = zeros(max_lag, max_lag)
phi[1, 1] = acf_vals[2]
pacf_vals = zeros(max_lag)
pacf_vals[1] = phi[1, 1]
for k in 2:max_lag
    numer = acf_vals[k + 1]
    denom = 1.0
    for j in 1:(k - 1)
        numer -= phi[k-1, j] * acf_vals[k - j + 1]
        denom -= phi[k-1, j] * acf_vals[j + 1]
    end
    phi[k, k] = numer / denom
    for j in 1:(k - 1)
        phi[k, j] = phi[k-1, j] - phi[k, k] * phi[k-1, k-j]
    end
    pacf_vals[k] = phi[k, k]
end

conf_bound = 1.96 / sqrt(n_obs)
acf_lags   = Float64.(0:max_lag)

# Build linesegments! data for ACF: interleaved [x_base, x_tip, ...] pairs per segment
acf_seg_x = vcat([[lag, lag] for lag in acf_lags]...)
acf_seg_y = vcat([[0.0, v]   for v   in acf_vals]...)

# PACF: split lags into significant (|r| > conf_bound) vs. within-bound for visual hierarchy
pacf_sig_idx = findall(v -> abs(v) > conf_bound, pacf_vals)
pacf_ns_idx  = findall(v -> abs(v) <= conf_bound, pacf_vals)

# Muted variant for non-significant PACF lags (same hue, lower opacity)
GREEN_FULL  = IMPRINT_PALETTE[1]
GREEN_MUTED = RGBAf(GREEN_FULL.r, GREEN_FULL.g, GREEN_FULL.b, 0.38f0)

function make_segs(idx, vals)
    xs = vcat([[Float64(i), Float64(i)] for i in idx]...)
    ys = vcat([[0.0, vals[i]] for i in idx]...)
    xs, ys
end

# Figure
fig = Figure(
    size            = (1600, 900),
    fontsize        = 14,
    backgroundcolor = PAGE_BG,
)

# ACF axis (top)
ax_acf = Axis(
    fig[1, 1];
    title             = "AR(2) Process · acf-pacf · julia · makie · anyplot.ai",
    titlesize         = 20,
    titlecolor        = INK,
    ylabel            = "ACF",
    ylabelsize        = 14,
    ylabelcolor       = INK,
    xticklabelsize    = 12,
    yticklabelsize    = 12,
    xticklabelcolor   = INK_SOFT,
    yticklabelcolor   = INK_SOFT,
    xtickcolor        = INK_SOFT,
    ytickcolor        = INK_SOFT,
    backgroundcolor   = PAGE_BG,
    topspinevisible   = false,
    rightspinevisible = false,
    leftspinecolor    = INK_SOFT,
    bottomspinecolor  = INK_SOFT,
    xgridvisible      = false,
    ygridvisible      = true,
    ygridcolor        = RGBAf(INK.r, INK.g, INK.b, 0.12f0),
)

# PACF axis (bottom)
ax_pacf = Axis(
    fig[2, 1];
    xlabel            = "Lag",
    ylabel            = "PACF",
    xlabelsize        = 14,
    ylabelsize        = 14,
    xlabelcolor       = INK,
    ylabelcolor       = INK,
    xticklabelsize    = 12,
    yticklabelsize    = 12,
    xticklabelcolor   = INK_SOFT,
    yticklabelcolor   = INK_SOFT,
    xtickcolor        = INK_SOFT,
    ytickcolor        = INK_SOFT,
    backgroundcolor   = PAGE_BG,
    topspinevisible   = false,
    rightspinevisible = false,
    leftspinecolor    = INK_SOFT,
    bottomspinecolor  = INK_SOFT,
    xgridvisible      = false,
    ygridvisible      = true,
    ygridcolor        = RGBAf(INK.r, INK.g, INK.b, 0.12f0),
)

linkxaxes!(ax_acf, ax_pacf)
ax_acf.xticklabelsvisible = false
ax_acf.xlabelvisible      = false

# ACF stems, tips, and reference lines
linesegments!(ax_acf, acf_seg_x, acf_seg_y;
    color = GREEN_FULL, linewidth = 2.0)
scatter!(ax_acf, acf_lags, acf_vals;
    color = GREEN_FULL, markersize = 8, strokewidth = 0)
hlines!(ax_acf, [0.0]; color = INK_SOFT, linewidth = 1.0)
hlines!(ax_acf, [conf_bound, -conf_bound];
    color = INK_SOFT, linestyle = :dash, linewidth = 1.5)

# PACF: within-bound lags (muted) drawn first, then significant lags on top
if !isempty(pacf_ns_idx)
    ns_sx, ns_sy = make_segs(pacf_ns_idx, pacf_vals)
    linesegments!(ax_pacf, ns_sx, ns_sy; color = GREEN_MUTED, linewidth = 1.5)
    scatter!(ax_pacf, Float64.(pacf_ns_idx), pacf_vals[pacf_ns_idx];
        color = GREEN_MUTED, markersize = 7, strokewidth = 0)
end
if !isempty(pacf_sig_idx)
    sig_sx, sig_sy = make_segs(pacf_sig_idx, pacf_vals)
    linesegments!(ax_pacf, sig_sx, sig_sy; color = GREEN_FULL, linewidth = 2.5)
    scatter!(ax_pacf, Float64.(pacf_sig_idx), pacf_vals[pacf_sig_idx];
        color = GREEN_FULL, markersize = 9, strokewidth = 0)
end
hlines!(ax_pacf, [0.0]; color = INK_SOFT, linewidth = 1.0)
hlines!(ax_pacf, [conf_bound, -conf_bound];
    color = INK_SOFT, linestyle = :dash, linewidth = 1.5)

rowgap!(fig.layout, 1, 20)

save("plot-$(THEME).png", fig; px_per_unit = 2)
Runnable source as JSON, for any HTTP client: https://api.anyplot.ai/specs/acf-pacf/makie/code. Any spec id and library id listed in llms-full.txt fit the same URL shape; every URL below is complete and callable.
{
  "spec_id": "acf-pacf",
  "language": "julia",
  "library": "makie",
  "page": "https://anyplot.ai/acf-pacf/julia/makie",
  "hub": "https://anyplot.ai/acf-pacf",
  "code_json": "https://api.anyplot.ai/specs/acf-pacf/makie/code",
  "spec_json": "https://api.anyplot.ai/specs/acf-pacf",
  "render_light_png": "https://storage.googleapis.com/anyplot-images/plots/acf-pacf/julia/makie/plot-light.png",
  "render_dark_png": "https://storage.googleapis.com/anyplot-images/plots/acf-pacf/julia/makie/plot-dark.png",
  "quality_score": 86.0,
  "license": "MIT",
  "guide": "https://anyplot.ai/llms.txt"
}
Part of Autocorrelation and Partial Autocorrelation (ACF/PACF) Plot on anyplot.ai.