The same plot in 14 other libraries — JavaScript: Chart.js, D3.js, Apache ECharts, MUI X Charts; Python: Altair, Bokeh, lets-plot, Matplotlib, Plotly, plotnine, Pygal, Seaborn; R: ggplot2; Julia: Makie.jl. Compare all 15 side by side: Autocorrelation and Partial Autocorrelation (ACF/PACF) Plot in Python, R, Julia and JavaScript.
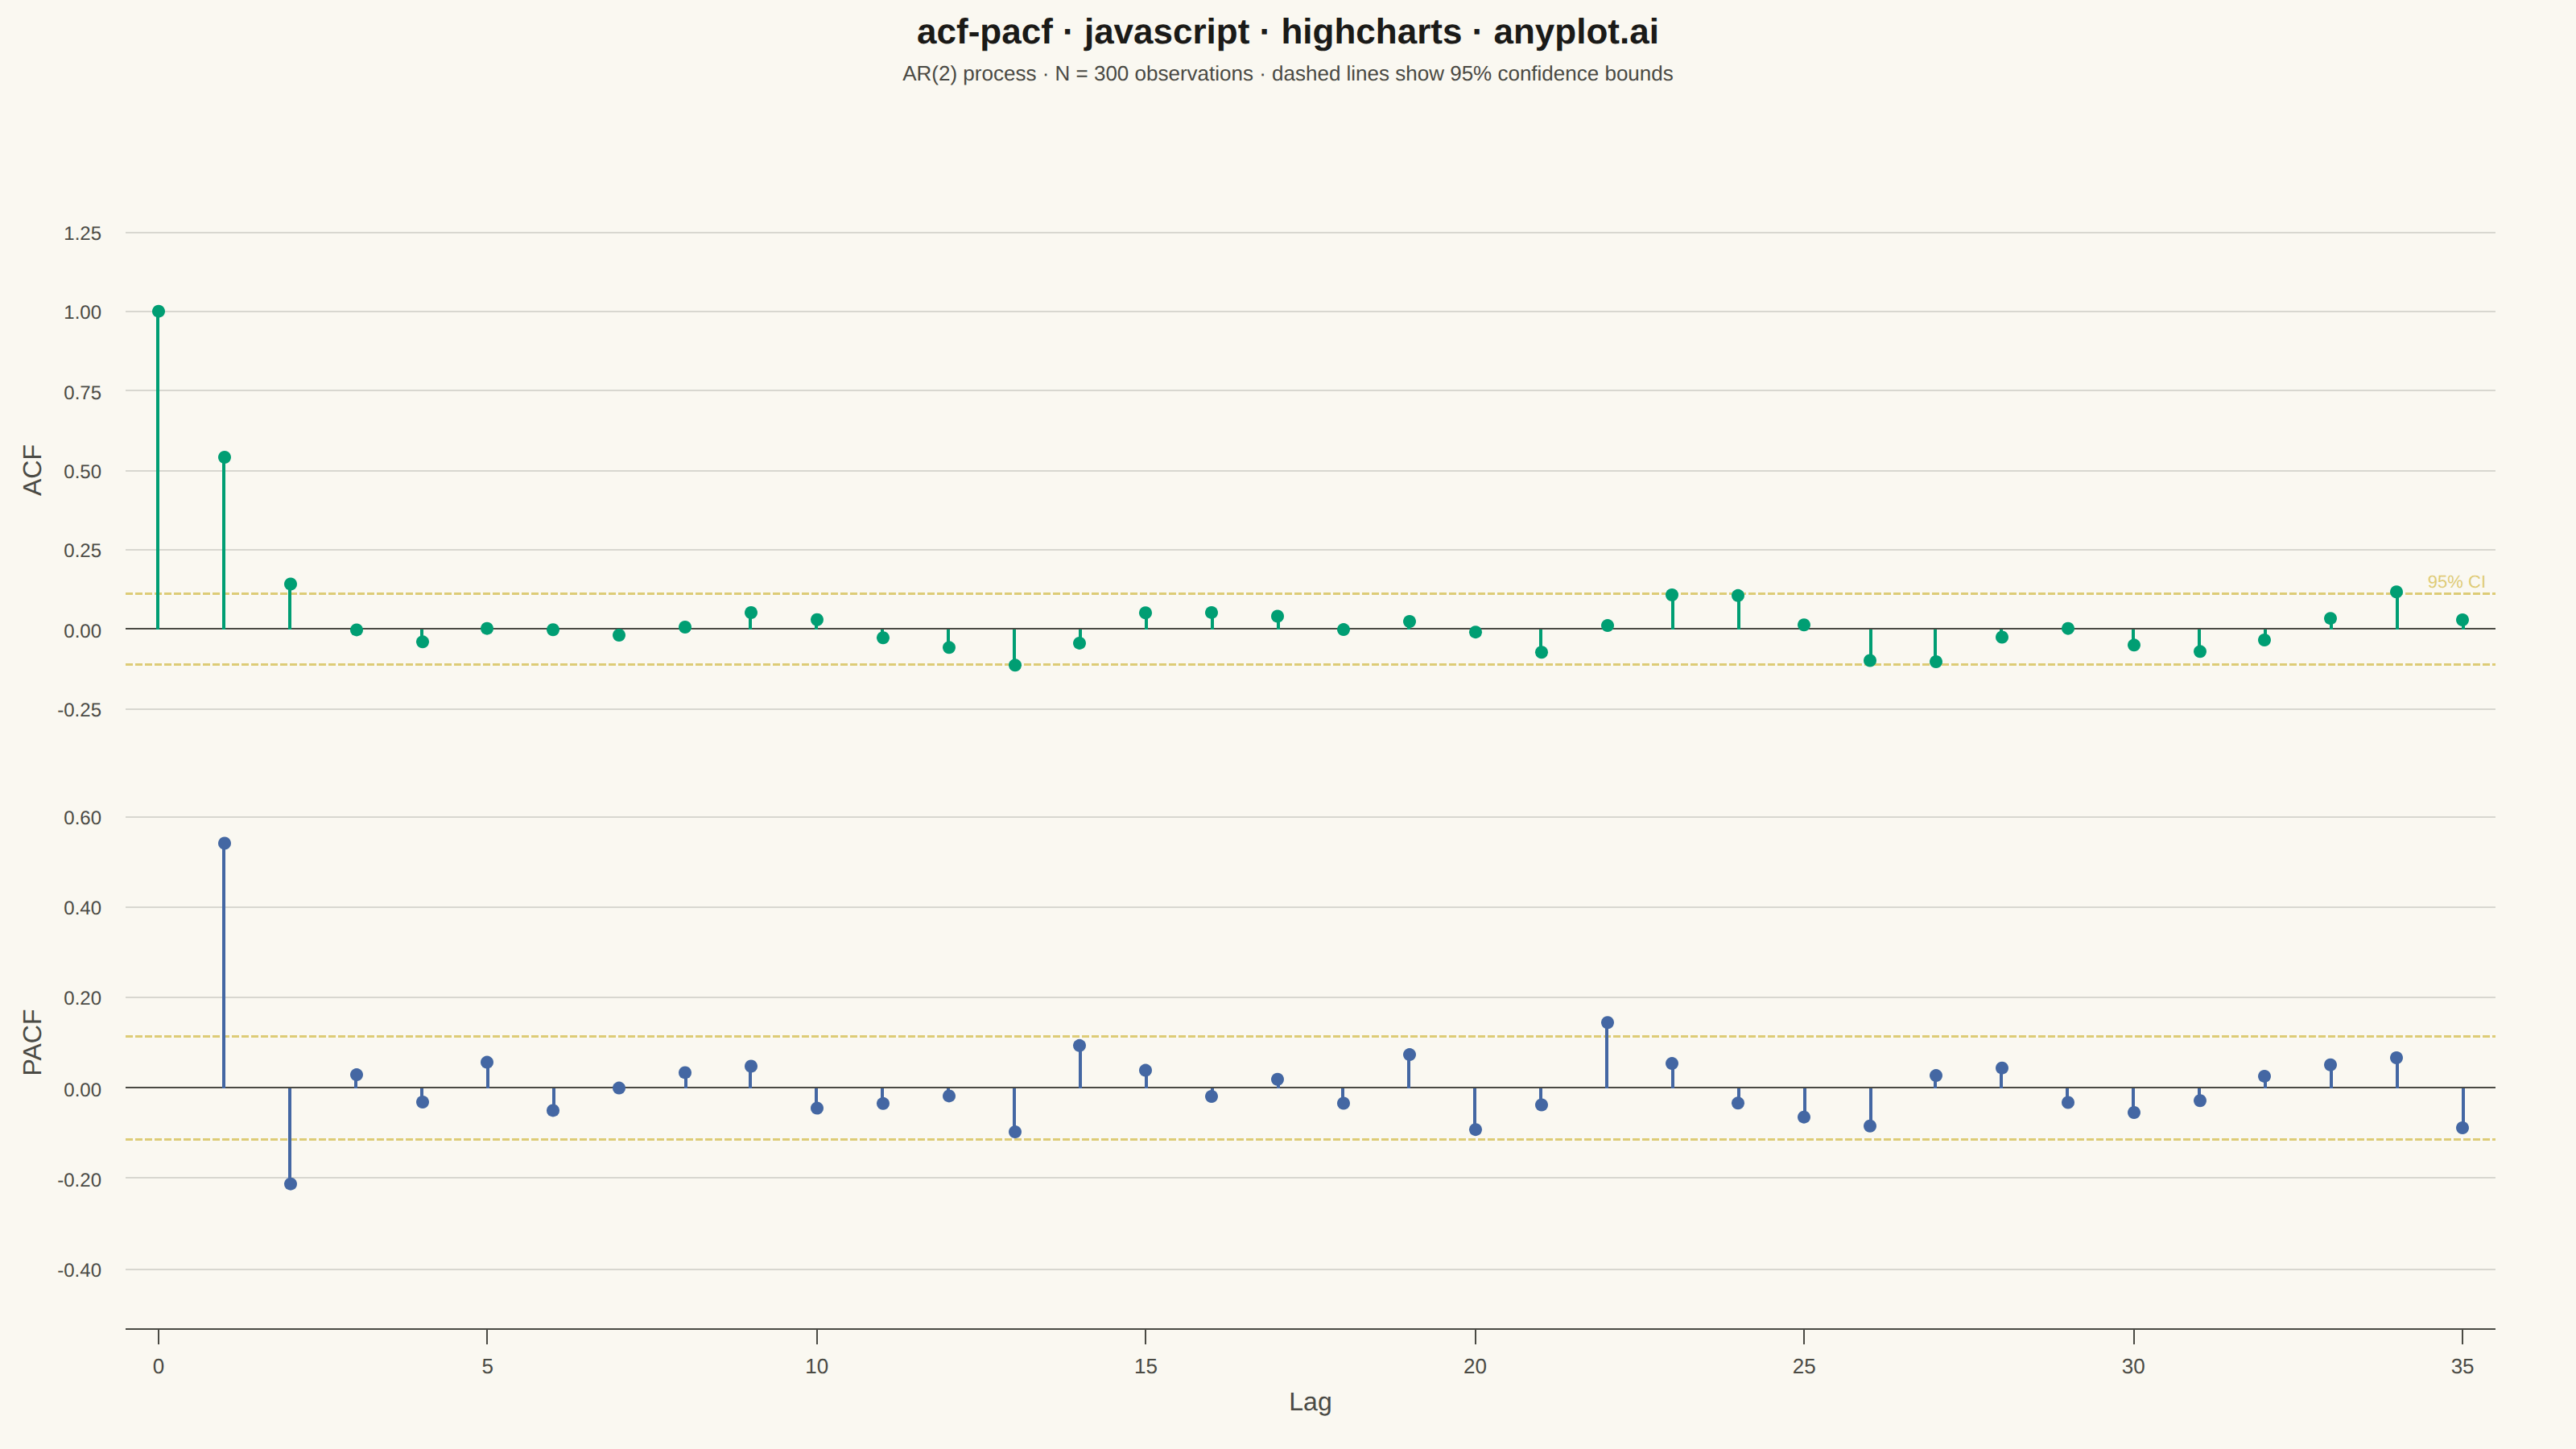
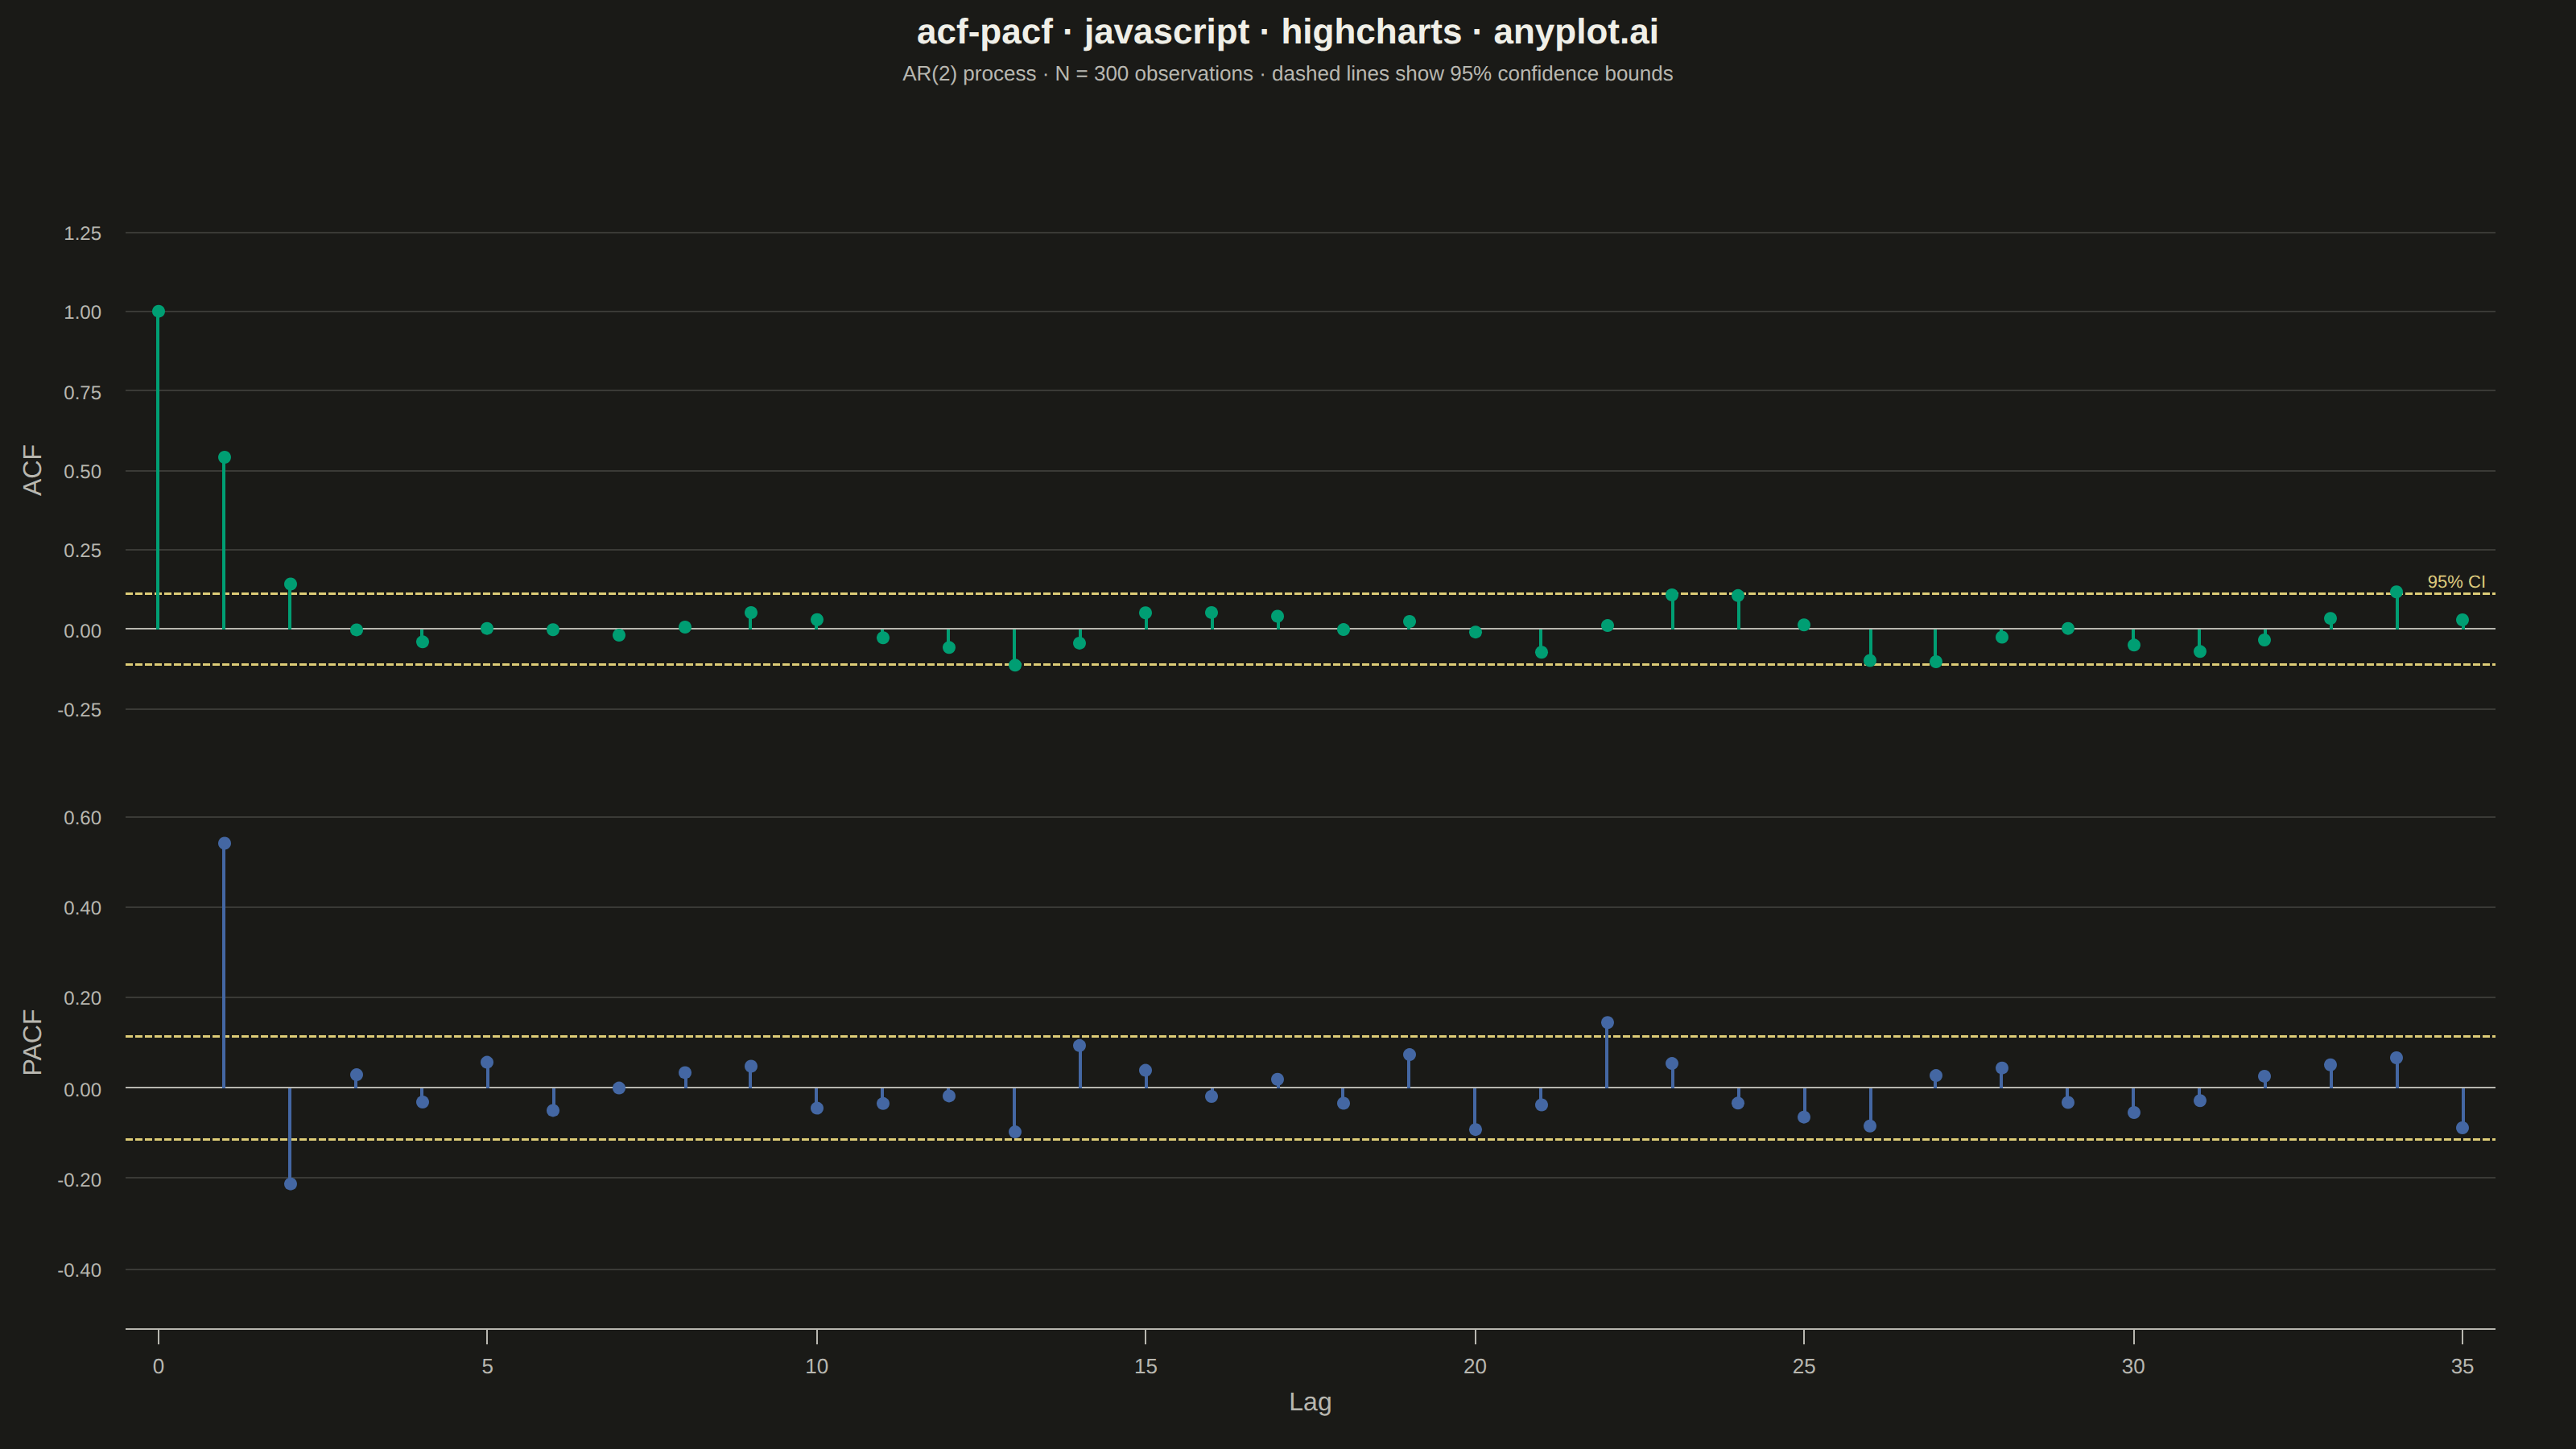
Displays the autocorrelation function (ACF) and partial autocorrelation function (PACF) of a time series as vertical stem/bar plots arranged in two vertically stacked subplots. Each lag is represented by a vertical line from zero to the correlation value, with horizontal dashed lines indicating 95% confidence bounds. These plots are essential for identifying the order of AR and MA components in ARIMA modeling and for diagnosing residual independence.
// anyplot.ai
// acf-pacf: Autocorrelation and Partial Autocorrelation (ACF/PACF) Plot
// Library: highcharts 12.6.0 | JavaScript 22.22.3
// Quality: 90/100 | Created: 2026-06-10
//# anyplot-orientation: landscape

const t = window.ANYPLOT_TOKENS;

// Reproducible RNG: LCG seed=42 + Box-Muller transform
function makeLCG(seed) {
  let s = seed >>> 0;
  return () => { s = (Math.imul(1664525, s) + 1013904223) >>> 0; return s / 4294967296; };
}
function makeNormal(lcg) {
  return () => {
    const u1 = lcg() + 1e-10, u2 = lcg();
    return Math.sqrt(-2 * Math.log(u1)) * Math.cos(2 * Math.PI * u2);
  };
}

// AR(2) time series: X_t = 0.7 X_{t-1} − 0.2 X_{t-2} + ε_t  (N=300)
// PACF cutoff after lag 2 reveals the AR(2) order clearly
const N = 300;
const randn = makeNormal(makeLCG(42));
const tsSeries = new Array(N).fill(0);
for (let i = 2; i < N; i++) {
  tsSeries[i] = 0.7 * tsSeries[i - 1] - 0.2 * tsSeries[i - 2] + randn();
}

// ACF: sample autocorrelation for lags 0..maxLag
function computeACF(x, maxLag) {
  const n = x.length;
  const mu = x.reduce((a, b) => a + b, 0) / n;
  const v  = x.reduce((s, xi) => s + (xi - mu) ** 2, 0) / n;
  const r = [1.0];
  for (let h = 1; h <= maxLag; h++) {
    let c = 0;
    for (let i = 0; i < n - h; i++) c += (x[i] - mu) * (x[i + h] - mu);
    r.push(c / (n * v));
  }
  return r;
}

// PACF: Durbin–Levinson recursion, returns values for lags 1..maxLag
function computePACF(rho, maxLag) {
  const p = [];
  let phi = [rho[1]];
  p.push(rho[1]);
  for (let k = 2; k <= maxLag; k++) {
    let num = rho[k], den = 1;
    for (let j = 0; j < k - 1; j++) {
      num -= phi[j] * rho[k - 1 - j];
      den -= phi[j] * rho[j + 1];
    }
    const phikk = num / den;
    p.push(phikk);
    const np = new Array(k);
    np[k - 1] = phikk;
    for (let j = 0; j < k - 1; j++) np[j] = phi[j] - phikk * phi[k - 2 - j];
    phi = np;
  }
  return p;
}

const MAX_LAG = 35;
const acfVals  = computeACF(tsSeries, MAX_LAG);    // lags 0..35
const pacfVals = computePACF(acfVals, MAX_LAG);    // lags 1..35
const ci = 1.96 / Math.sqrt(N);                    // 95% confidence bound ≈ 0.113

Highcharts.chart("container", {
  chart: {
    backgroundColor: "transparent",
    animation: false,
    style: { fontFamily: "inherit" },
    marginTop: 85,
    marginBottom: 75,
    marginLeft: 78,
    marginRight: 50
  },
  credits: { enabled: false },
  colors: t.palette,
  title: {
    text: "acf-pacf · javascript · highcharts · anyplot.ai",
    style: { color: t.ink, fontSize: "22px", fontWeight: "600" }
  },
  subtitle: {
    text: "AR(2) process · N = 300 observations · dashed lines show 95% confidence bounds",
    style: { color: t.inkSoft, fontSize: "13px" }
  },
  xAxis: {
    min: 0,
    max: MAX_LAG,
    tickInterval: 5,
    lineColor: t.inkSoft,
    tickColor: t.inkSoft,
    title: { text: "Lag", style: { color: t.inkSoft, fontSize: "16px" } },
    labels: { style: { color: t.inkSoft, fontSize: "13px" } }
  },
  yAxis: [
    {
      top: "8%",
      height: "40%",
      max: 1.15,
      title: { text: "ACF", style: { color: t.inkSoft, fontSize: "16px" } },
      labels: {
        style: { color: t.inkSoft, fontSize: "12px" },
        format: "{value:.2f}"
      },
      gridLineColor: t.grid,
      lineColor: t.inkSoft,
      tickColor: t.inkSoft,
      plotLines: [
        { value: 0, color: t.inkSoft, width: 1, zIndex: 2 },
        {
          value: ci,
          color: t.amber,
          dashStyle: "ShortDash",
          width: 1.5,
          zIndex: 3,
          label: {
            text: "95% CI",
            align: "right",
            x: -6,
            style: { color: t.amber, fontSize: "11px" }
          }
        },
        { value: -ci, color: t.amber, dashStyle: "ShortDash", width: 1.5, zIndex: 3 }
      ]
    },
    {
      top: "57%",
      height: "38%",
      offset: 0,
      title: { text: "PACF", style: { color: t.inkSoft, fontSize: "16px" } },
      labels: {
        style: { color: t.inkSoft, fontSize: "12px" },
        format: "{value:.2f}"
      },
      gridLineColor: t.grid,
      lineColor: t.inkSoft,
      tickColor: t.inkSoft,
      plotLines: [
        { value: 0, color: t.inkSoft, width: 1, zIndex: 2 },
        { value:  ci, color: t.amber, dashStyle: "ShortDash", width: 1.5, zIndex: 3 },
        { value: -ci, color: t.amber, dashStyle: "ShortDash", width: 1.5, zIndex: 3 }
      ]
    }
  ],
  plotOptions: {
    series: { animation: false, enableMouseTracking: false },
    column: { pointWidth: 2, borderWidth: 0, grouping: false, threshold: 0 },
    scatter: { showInLegend: false }
  },
  legend: { enabled: false },
  tooltip: { enabled: false },
  series: [
    {
      name: "ACF",
      type: "column",
      data: acfVals.map((v, i) => ({ x: i, y: v })),
      yAxis: 0,
      color: t.palette[0]
    },
    {
      name: "ACF dots",
      type: "scatter",
      data: acfVals.map((v, i) => ({ x: i, y: v })),
      yAxis: 0,
      color: t.palette[0],
      marker: { radius: 4, symbol: "circle" }
    },
    {
      name: "PACF",
      type: "column",
      data: pacfVals.map((v, i) => ({ x: i + 1, y: v })),
      yAxis: 1,
      color: t.palette[2]
    },
    {
      name: "PACF dots",
      type: "scatter",
      data: pacfVals.map((v, i) => ({ x: i + 1, y: v })),
      yAxis: 1,
      color: t.palette[2],
      marker: { radius: 4, symbol: "circle" }
    }
  ]
});
Runnable source as JSON, for any HTTP client: https://api.anyplot.ai/specs/acf-pacf/highcharts/code. Any spec id and library id listed in llms-full.txt fit the same URL shape; every URL below is complete and callable.
{
  "spec_id": "acf-pacf",
  "language": "javascript",
  "library": "highcharts",
  "page": "https://anyplot.ai/acf-pacf/javascript/highcharts",
  "hub": "https://anyplot.ai/acf-pacf",
  "code_json": "https://api.anyplot.ai/specs/acf-pacf/highcharts/code",
  "spec_json": "https://api.anyplot.ai/specs/acf-pacf",
  "render_light_png": "https://storage.googleapis.com/anyplot-images/plots/acf-pacf/javascript/highcharts/plot-light.png",
  "render_dark_png": "https://storage.googleapis.com/anyplot-images/plots/acf-pacf/javascript/highcharts/plot-dark.png",
  "interactive_light_html": "https://storage.googleapis.com/anyplot-images/plots/acf-pacf/javascript/highcharts/plot-light.html",
  "interactive_dark_html": "https://storage.googleapis.com/anyplot-images/plots/acf-pacf/javascript/highcharts/plot-dark.html",
  "quality_score": 90.0,
  "license": "MIT",
  "guide": "https://anyplot.ai/llms.txt"
}
Part of Autocorrelation and Partial Autocorrelation (ACF/PACF) Plot on anyplot.ai.