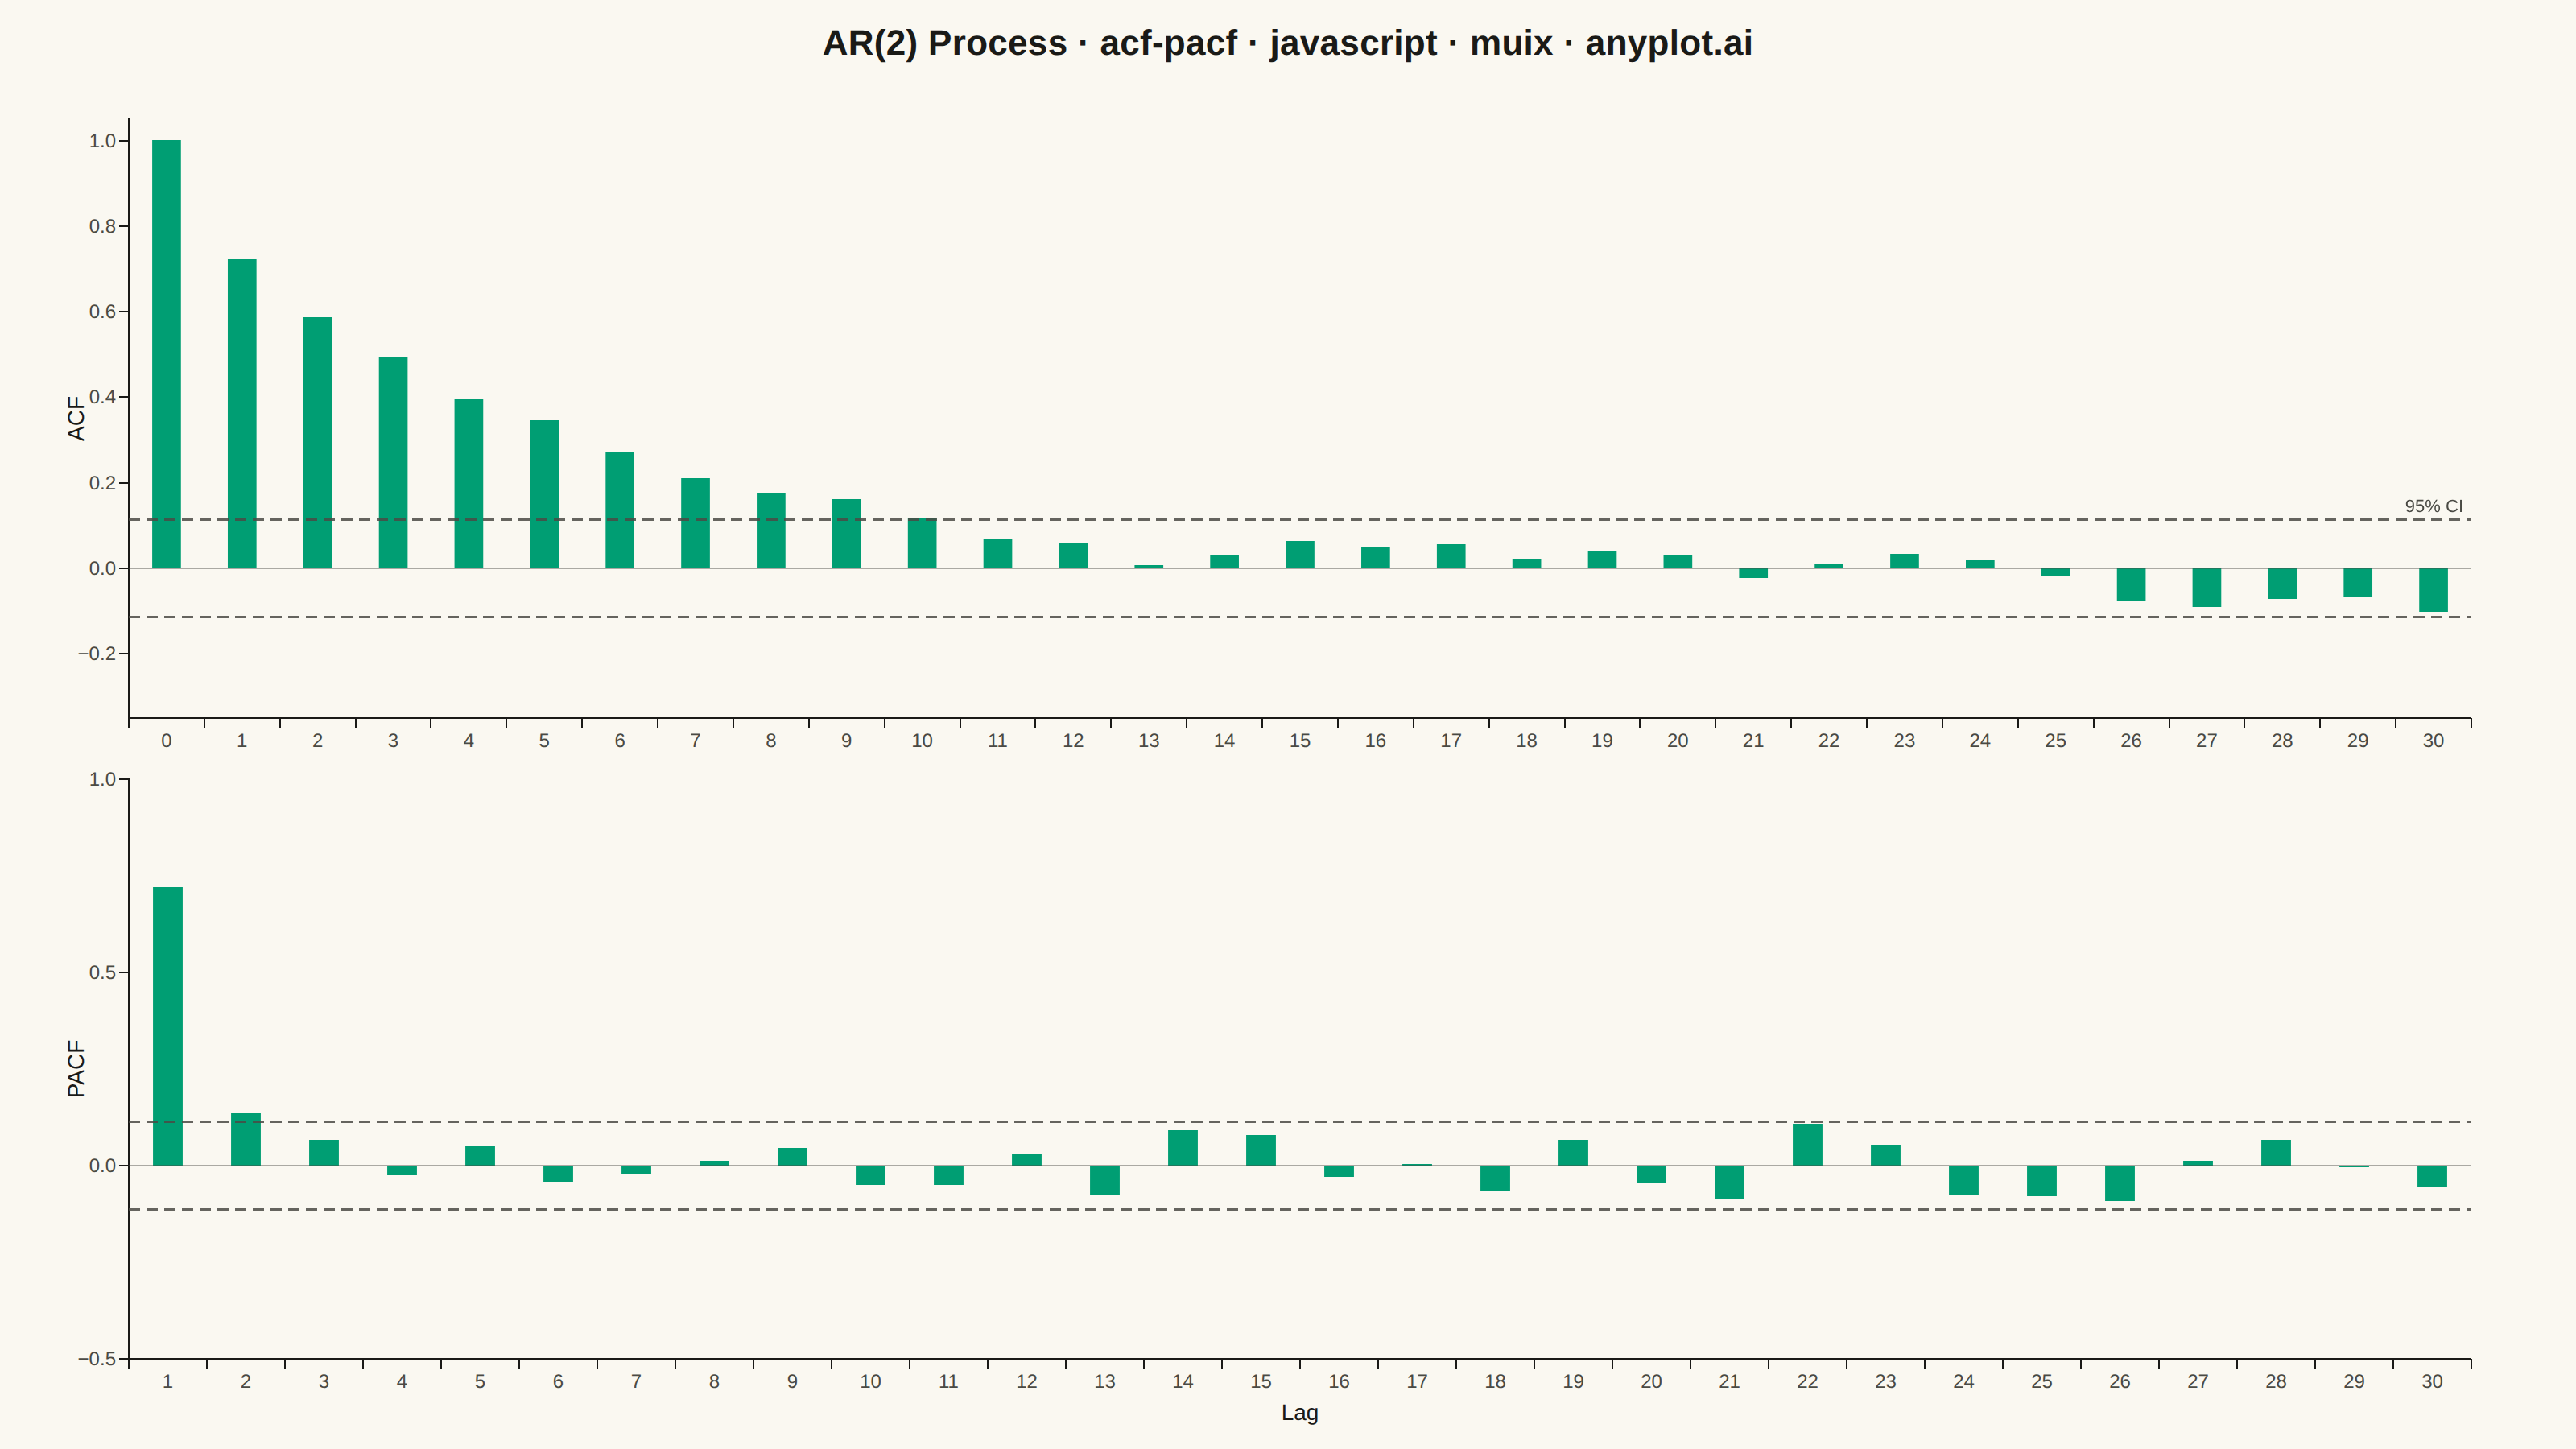
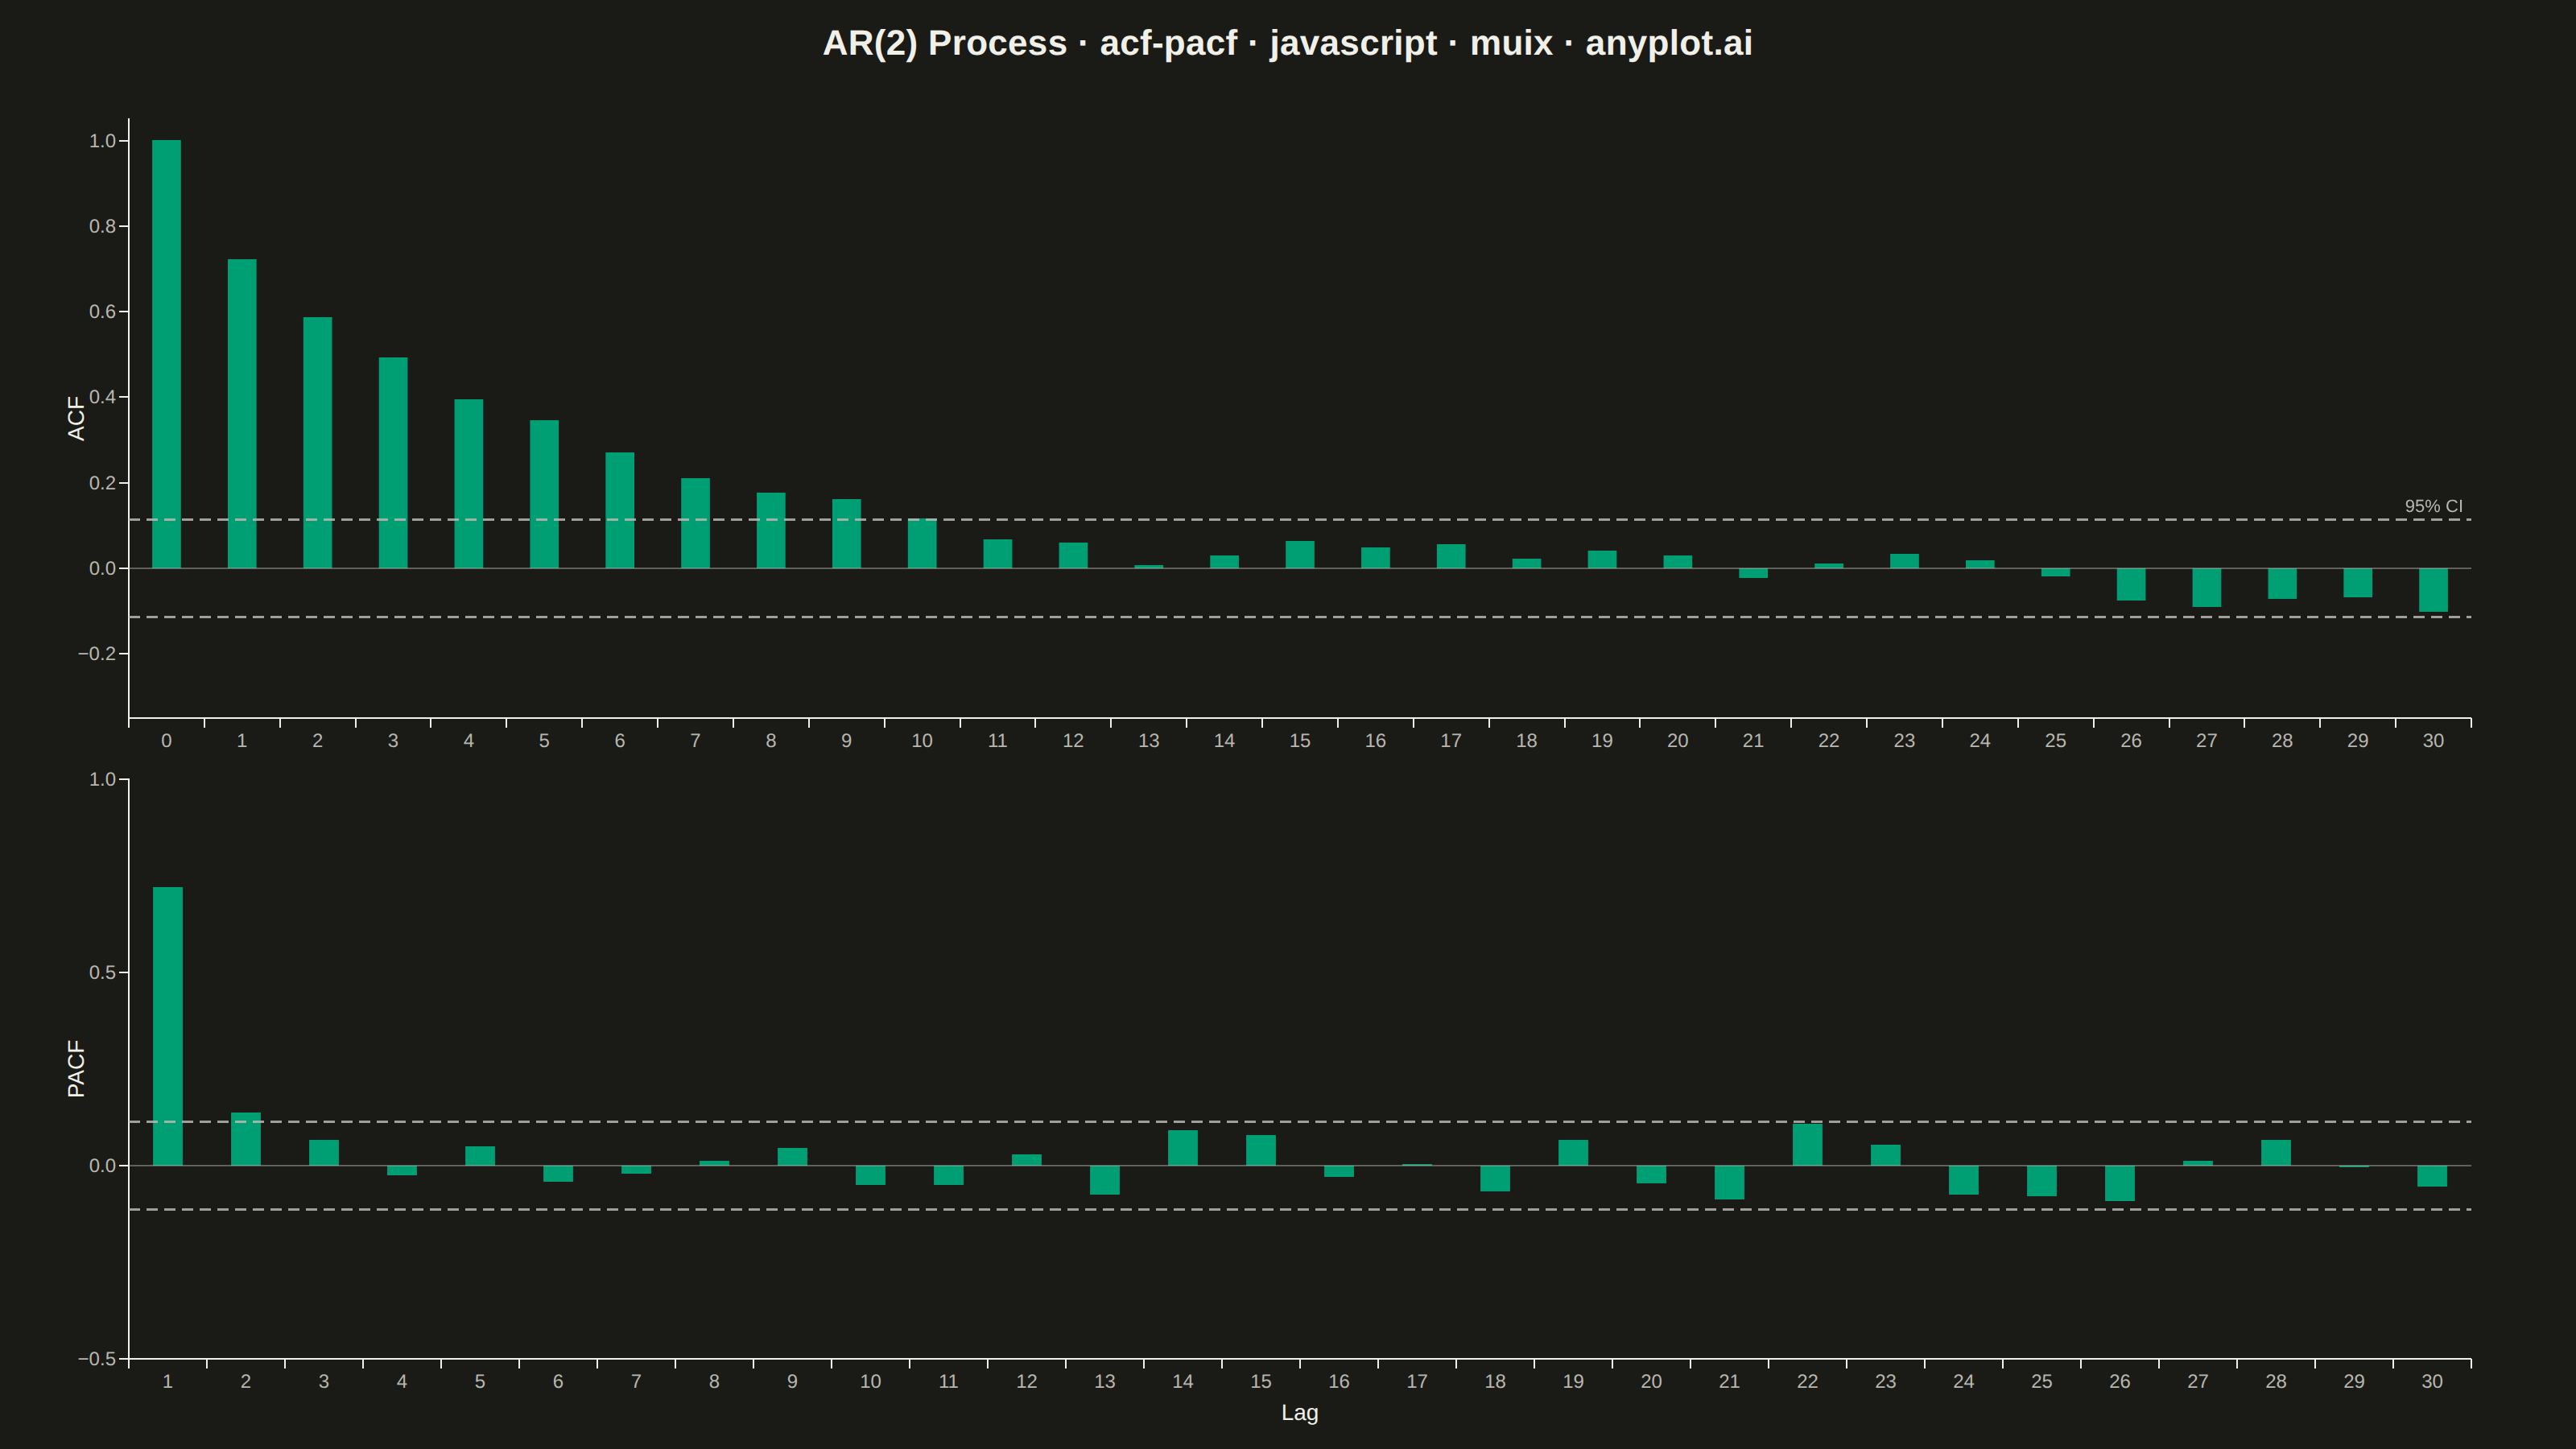
The same plot in 14 other libraries — JavaScript: Chart.js, D3.js, Apache ECharts, Highcharts; Python: Altair, Bokeh, lets-plot, Matplotlib, Plotly, plotnine, Pygal, Seaborn; R: ggplot2; Julia: Makie.jl. Compare all 15 side by side: Autocorrelation and Partial Autocorrelation (ACF/PACF) Plot in Python, R, Julia and JavaScript.
Displays the autocorrelation function (ACF) and partial autocorrelation function (PACF) of a time series as vertical stem/bar plots arranged in two vertically stacked subplots. Each lag is represented by a vertical line from zero to the correlation value, with horizontal dashed lines indicating 95% confidence bounds. These plots are essential for identifying the order of AR and MA components in ARIMA modeling and for diagnosing residual independence.
// anyplot.ai
// acf-pacf: Autocorrelation and Partial Autocorrelation (ACF/PACF) Plot
// Library: muix 9.16.0 | JavaScript 22.23.3
// Quality: 84/100 | Updated: 2026-10-23

import { BarChart } from "@mui/x-charts/BarChart";
import { ChartsReferenceLine } from "@mui/x-charts/ChartsReferenceLine";

const t = window.ANYPLOT_TOKENS;

// Constants
const MAX_LAG = 30; // number of lags shown in both panels
const Y_PAD = 0.15; // share of the value span added above and below each panel

// Columns: set these to your data's column names
const VALUE = "Daily Temperature Anomaly (°C)"; // role: value

// Data: replace this block with your own records, one object per row
// 300 days of temperature anomalies with AR(2) persistence:
// x_t = 0.65 * x_{t-1} + 0.15 * x_{t-2} + e_t
const data = (() => {
  function lcgRng(seed: number) {
    let s = seed >>> 0;
    return () => {
      s = (Math.imul(s, 1664525) + 1013904223) >>> 0;
      return s / 4294967296;
    };
  }

  function randn(rng: () => number) {
    const u = Math.max(rng(), 1e-10);
    return Math.sqrt(-2 * Math.log(u)) * Math.cos(2 * Math.PI * rng());
  }

  const rng = lcgRng(42);
  const count = 300;
  const series = [0, randn(rng) * 0.5];
  for (let i = 2; i < count; i += 1) {
    series.push(0.65 * series[i - 1] + 0.15 * series[i - 2] + randn(rng));
  }
  return series.map((v) => ({ [VALUE]: v }));
})();

// Plot: reads only data and the constants above
const ts = data.map((d) => d[VALUE]);
const N = ts.length;

const mu = ts.reduce((a, b) => a + b, 0) / N;
const cx = ts.map((x) => x - mu);
const c0 = cx.reduce((s, v) => s + v * v, 0) / N;

// Sample ACF for lags 0..MAX_LAG
const rho: number[] = [];
for (let h = 0; h <= MAX_LAG; h += 1) {
  let s = 0;
  for (let i = h; i < N; i += 1) s += cx[i] * cx[i - h];
  rho.push(s / (N * c0));
}

// PACF via the Durbin–Levinson recursion
const pacf = [1, rho[1]];
let phi = [rho[1]];
for (let k = 2; k <= MAX_LAG; k += 1) {
  let num = rho[k];
  let den = 1;
  for (let j = 0; j < k - 1; j += 1) {
    num -= phi[j] * rho[k - 1 - j];
    den -= phi[j] * rho[j + 1];
  }
  const pkk = den !== 0 ? num / den : 0;
  pacf.push(pkk);
  const next = Array(k).fill(0);
  next[k - 1] = pkk;
  for (let j = 0; j < k - 1; j += 1) next[j] = phi[j] - pkk * phi[k - 2 - j];
  phi = next;
}

// 95% CI: +/- 1.96 / sqrt(N)
const CI = 1.96 / Math.sqrt(N);

const round4 = (v: number) => Math.round(v * 10000) / 10000;

// Share the exact 0..MAX_LAG axis across both panels so every lag lines up
// vertically; PACF starts at lag 1 (null at lag 0).
const sharedLags = Array.from({ length: MAX_LAG + 1 }, (_, i) => String(i));
const acfData = rho.map(round4);
const pacfData: (number | null)[] = [null, ...pacf.slice(1).map(round4)];

// Each panel's y range covers its bars and the +/- CI band, padded by Y_PAD.
const acfLo = Math.min(-CI, ...acfData);
const acfHi = Math.max(CI, ...acfData);
const acfLimits = { min: acfLo - Y_PAD * (acfHi - acfLo), max: acfHi + Y_PAD * (acfHi - acfLo) };
const pacfVals = pacfData.filter((v): v is number => v != null);
const pacfLo = Math.min(-CI, ...pacfVals);
const pacfHi = Math.max(CI, ...pacfVals);
const pacfLimits = { min: pacfLo - Y_PAD * (pacfHi - pacfLo), max: pacfHi + Y_PAD * (pacfHi - pacfLo) };

export default function Chart() {
  const W = window.ANYPLOT_SIZE.width;
  const H = window.ANYPLOT_SIZE.height;

  const TITLE_H = 54;
  const PANEL_H = Math.floor((H - TITLE_H - 6) / 2);

  const barColor = t.palette[0];

  const ciLineStyle = {
    stroke: t.inkSoft,
    strokeDasharray: "7 4",
    strokeWidth: 1.5,
    strokeOpacity: 0.85,
  };

  const zeroLineStyle = {
    stroke: t.inkSoft,
    strokeWidth: 0.9,
    strokeOpacity: 0.55,
  };

  const tickStyle = { fontSize: 14, fill: t.inkSoft };
  const labelStyle = { fontSize: 15, fill: t.ink };

  const axisLineSx = {
    "& .MuiChartsAxis-line": { stroke: t.inkSoft },
    "& .MuiChartsAxis-tick": { stroke: t.inkSoft },
  };

  const xAxisBase = {
    scaleType: "band" as const,
    categoryGapRatio: 0.9,
    tickLabelStyle: tickStyle,
  };

  const yAxisBase = {
    width: 72,
    tickMinStep: 0.25,
    tickLabelStyle: tickStyle,
    labelStyle,
  };

  return (
    <div
      style={{
        width: W,
        height: H,
        background: t.pageBg,
        display: "flex",
        flexDirection: "column",
        fontFamily: "'Roboto', 'Helvetica Neue', Arial, sans-serif",
      }}
    >
      <div
        style={{
          height: TITLE_H,
          display: "flex",
          alignItems: "center",
          justifyContent: "center",
          fontSize: 22,
          fontWeight: 600,
          color: t.ink,
          letterSpacing: 0.15,
        }}
      >
        Daily Temperature Anomaly · acf-pacf · javascript · muix · anyplot.ai
      </div>

      {/* ACF panel */}
      <div style={{ height: PANEL_H, flexShrink: 0 }}>
        <BarChart
          width={W}
          height={PANEL_H}
          skipAnimation
          disableHitArea
          hideLegend
          colors={[barColor]}
          xAxis={[{ ...xAxisBase, height: 36, data: sharedLags }]}
          yAxis={[{ ...yAxisBase, label: "ACF", ...acfLimits }]}
          series={[{ data: acfData, label: "ACF" }]}
          margin={{ top: 18, bottom: 12, left: 60, right: 65 }}
          sx={axisLineSx}
        >
          <ChartsReferenceLine
            y={CI}
            lineStyle={ciLineStyle}
            label="95% CI"
            labelStyle={{ fontSize: 11, fill: t.inkSoft }}
            labelAlign="end"
          />
          <ChartsReferenceLine y={-CI} lineStyle={ciLineStyle} />
          <ChartsReferenceLine y={0} lineStyle={zeroLineStyle} />
        </BarChart>
      </div>

      {/* PACF panel */}
      <div style={{ flex: 1 }}>
        <BarChart
          width={W}
          height={PANEL_H}
          skipAnimation
          disableHitArea
          hideLegend
          colors={[barColor]}
          xAxis={[
            {
              ...xAxisBase,
              height: 54,
              data: sharedLags,
              label: "Lag",
              labelStyle,
            },
          ]}
          yAxis={[{ ...yAxisBase, label: "PACF", ...pacfLimits }]}
          series={[{ data: pacfData, label: "PACF" }]}
          margin={{ top: 12, bottom: 20, left: 60, right: 65 }}
          sx={axisLineSx}
        >
          <ChartsReferenceLine y={CI} lineStyle={ciLineStyle} />
          <ChartsReferenceLine y={-CI} lineStyle={ciLineStyle} />
          <ChartsReferenceLine y={0} lineStyle={zeroLineStyle} />
        </BarChart>
      </div>
    </div>
  );
}
Runnable source as JSON, for any HTTP client: https://api.anyplot.ai/specs/acf-pacf/muix/code. Any spec id and library id listed in llms-full.txt fit the same URL shape; every URL below is complete and callable.
{
  "spec_id": "acf-pacf",
  "language": "javascript",
  "library": "muix",
  "page": "https://anyplot.ai/acf-pacf/javascript/muix",
  "hub": "https://anyplot.ai/acf-pacf",
  "code_json": "https://api.anyplot.ai/specs/acf-pacf/muix/code",
  "spec_json": "https://api.anyplot.ai/specs/acf-pacf",
  "render_light_png": "https://storage.googleapis.com/anyplot-images/plots/acf-pacf/javascript/muix/plot-light.png",
  "render_dark_png": "https://storage.googleapis.com/anyplot-images/plots/acf-pacf/javascript/muix/plot-dark.png",
  "interactive_light_html": "https://storage.googleapis.com/anyplot-images/plots/acf-pacf/javascript/muix/plot-light.html",
  "interactive_dark_html": "https://storage.googleapis.com/anyplot-images/plots/acf-pacf/javascript/muix/plot-dark.html",
  "quality_score": 84.0,
  "license": "MIT",
  "guide": "https://anyplot.ai/llms.txt"
}
Part of Autocorrelation and Partial Autocorrelation (ACF/PACF) Plot on anyplot.ai.