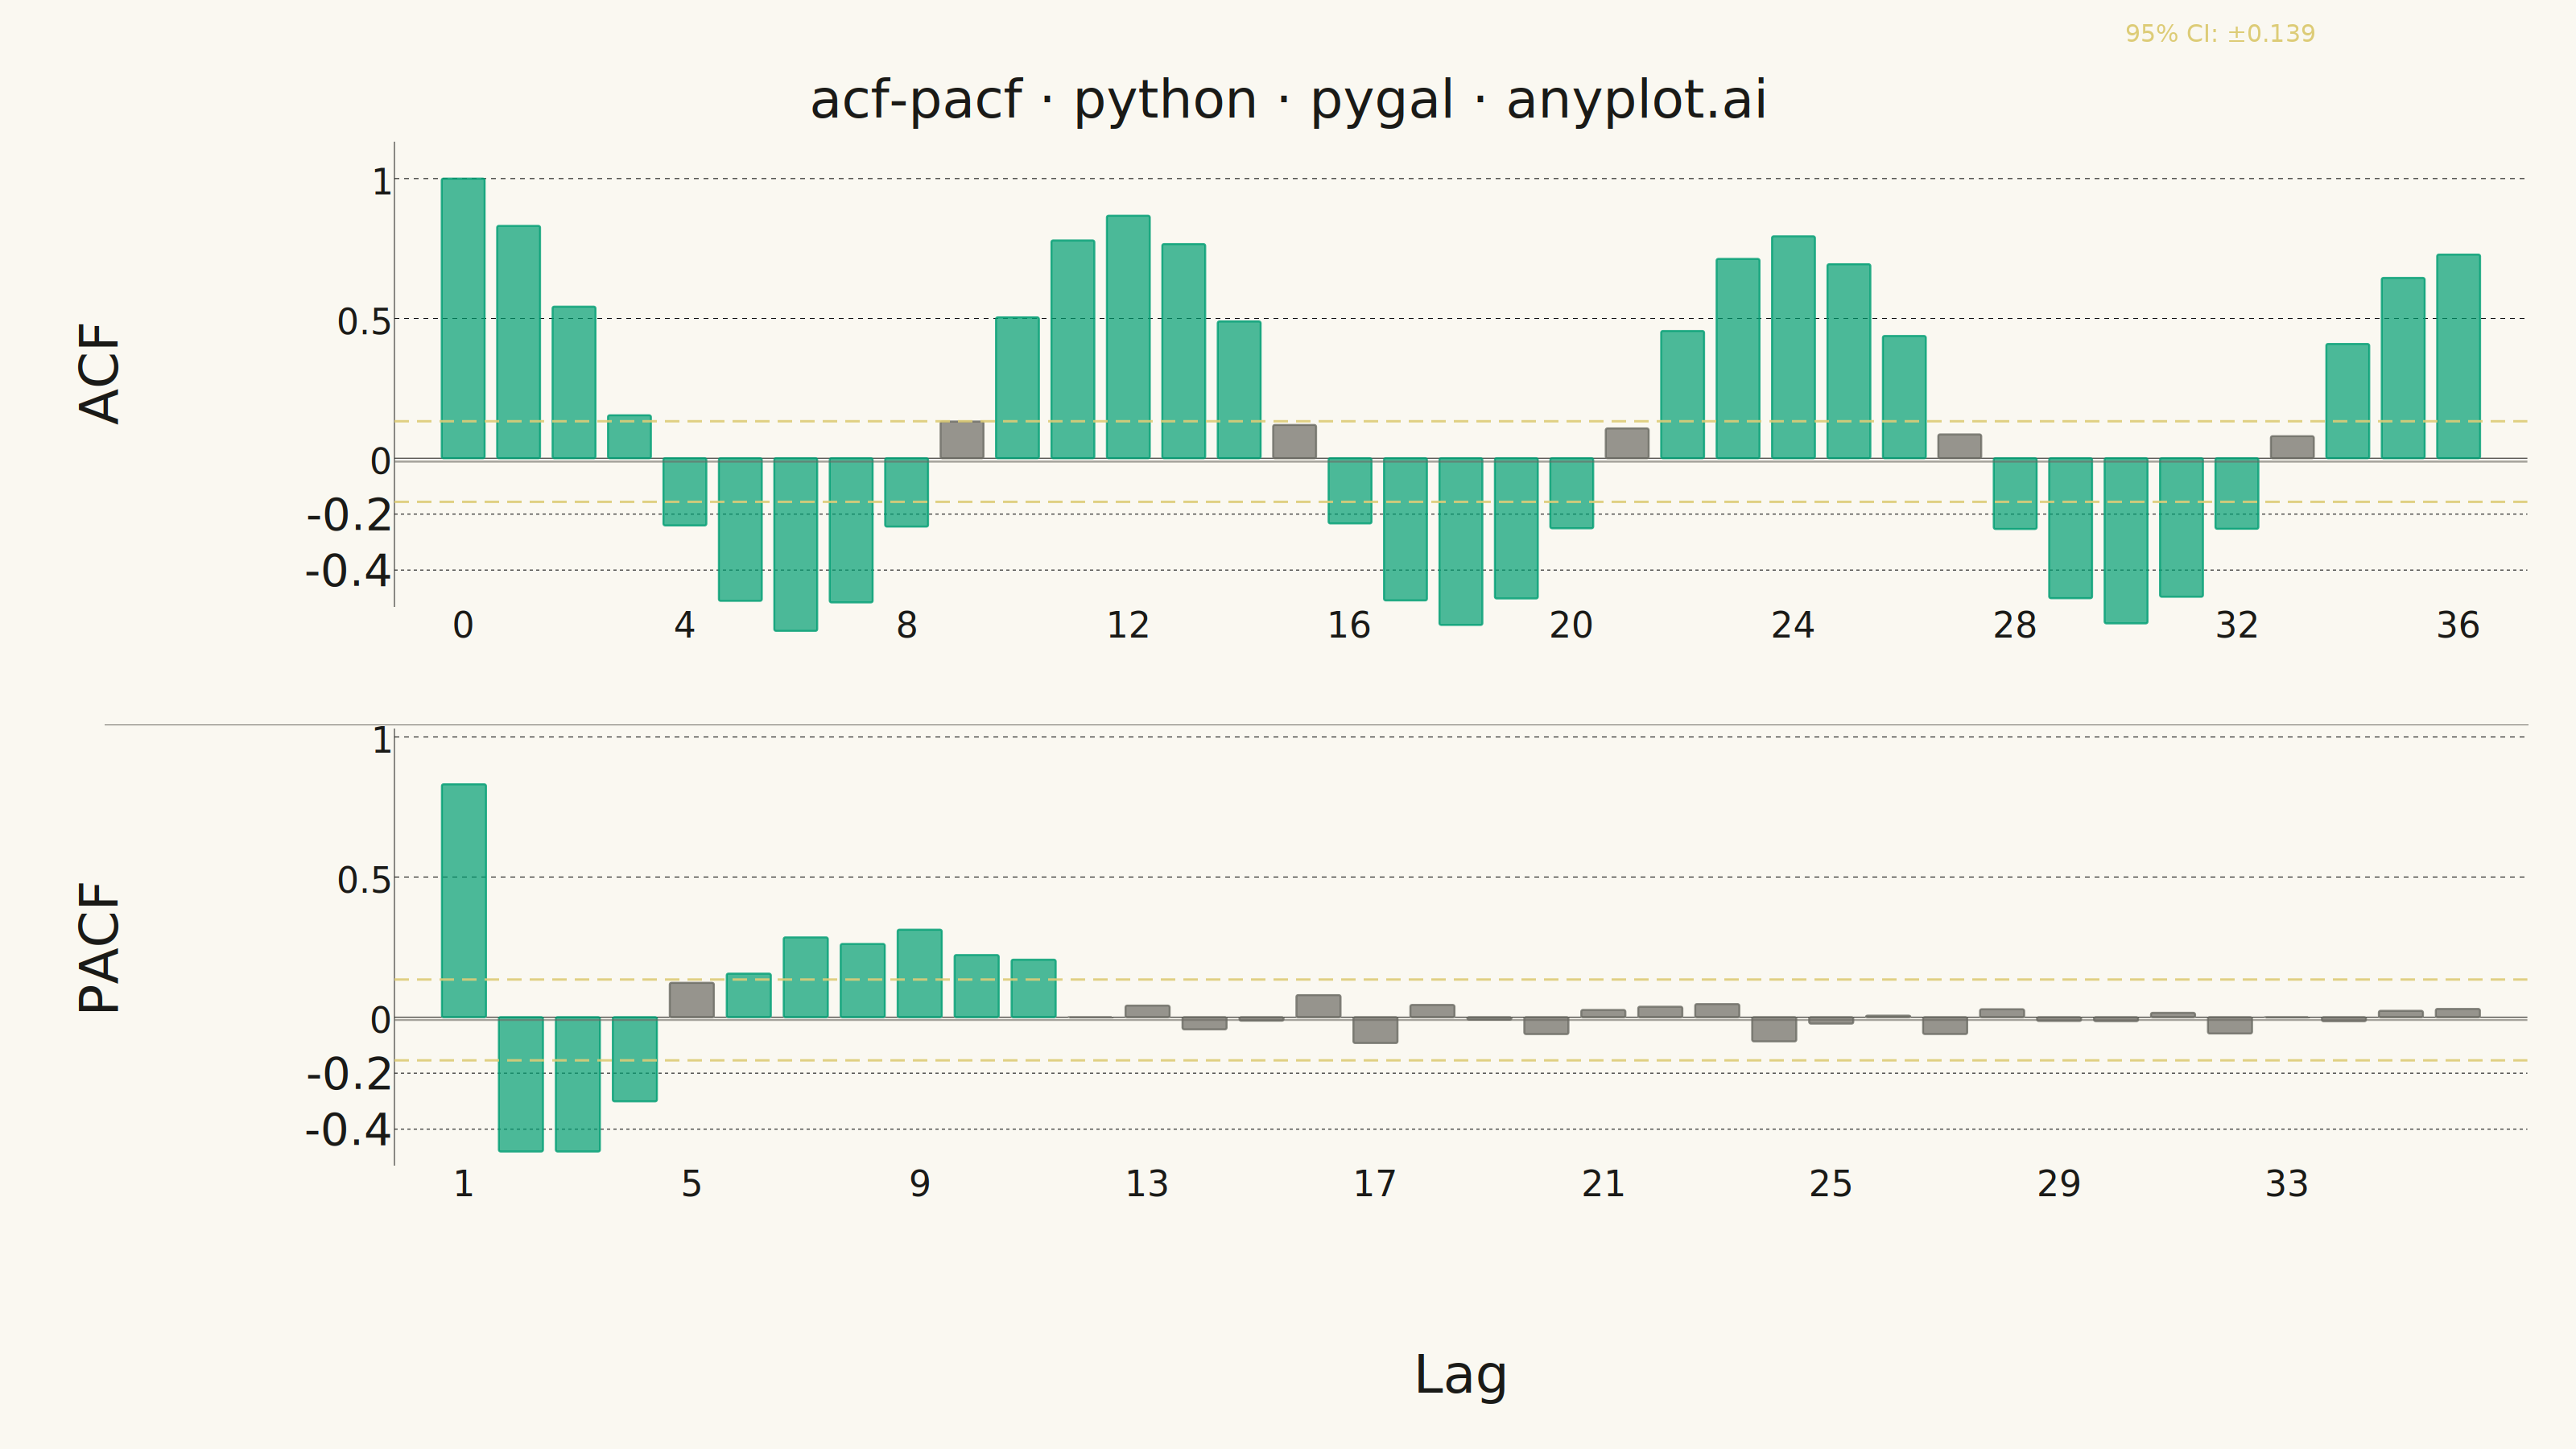
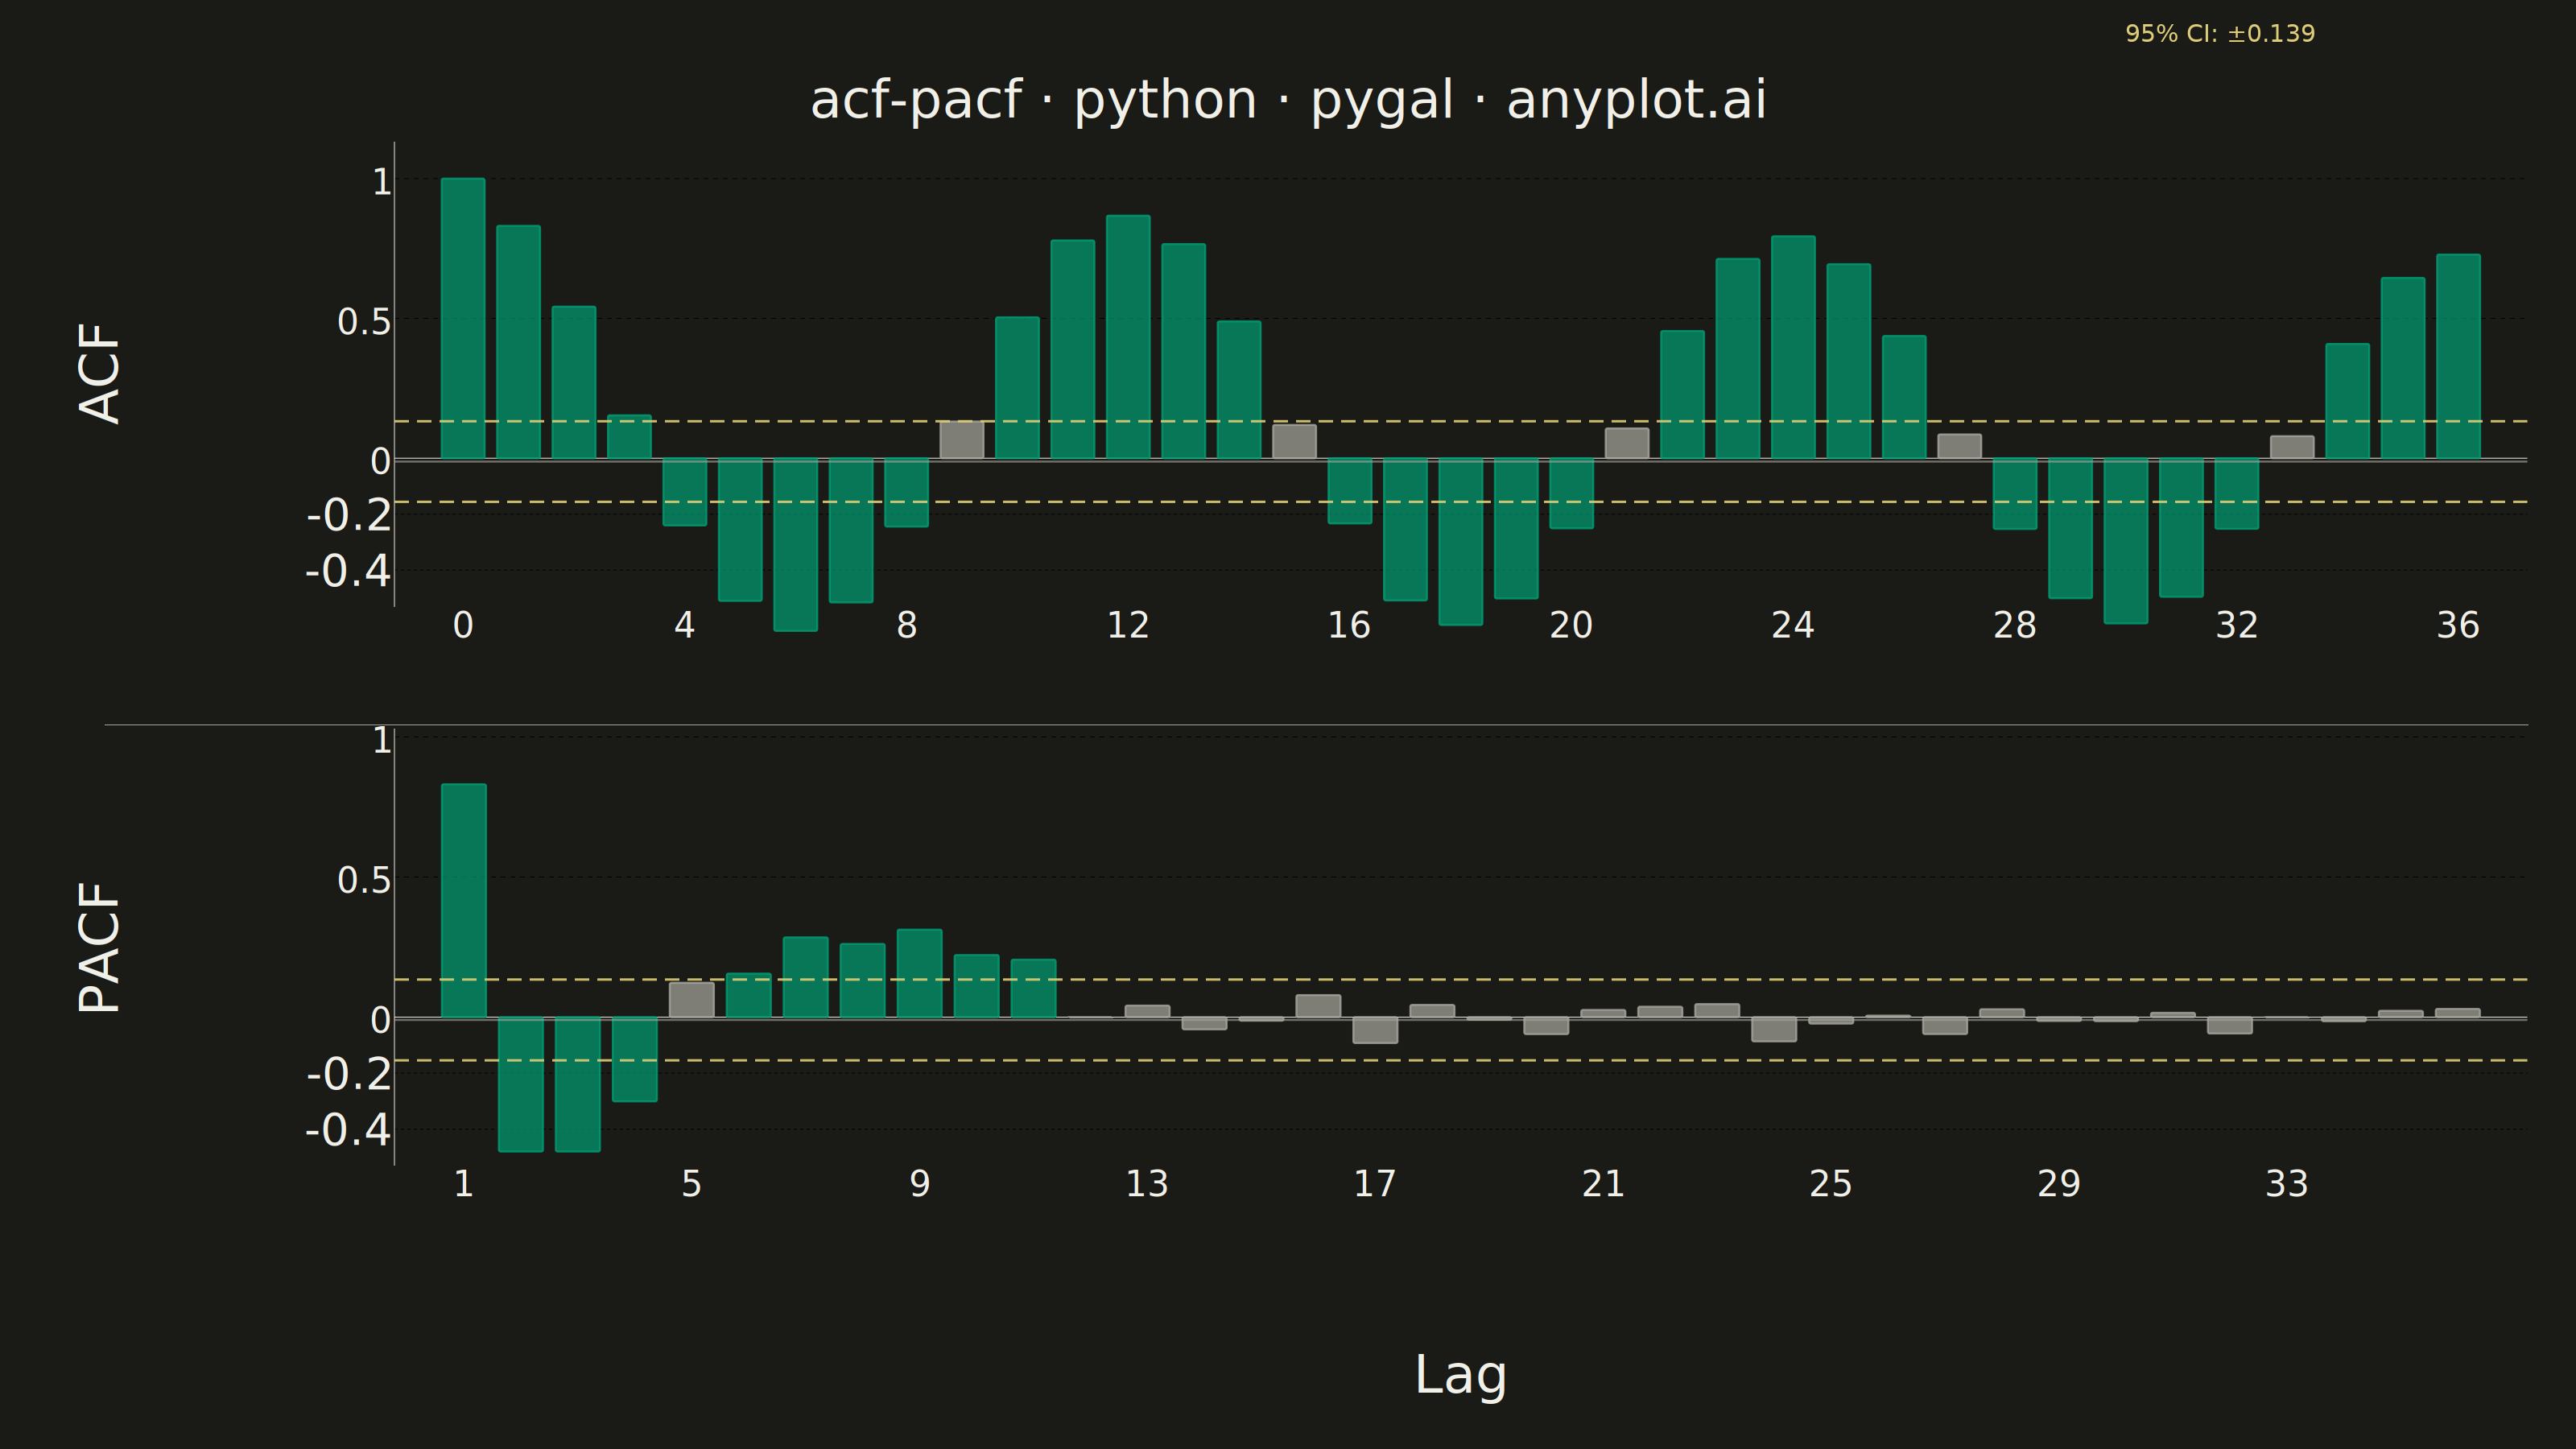
Displays the autocorrelation function (ACF) and partial autocorrelation function (PACF) of a time series as vertical stem/bar plots arranged in two vertically stacked subplots. Each lag is represented by a vertical line from zero to the correlation value, with horizontal dashed lines indicating 95% confidence bounds. These plots are essential for identifying the order of AR and MA components in ARIMA modeling and for diagnosing residual independence.
""" anyplot.ai
acf-pacf: Autocorrelation and Partial Autocorrelation (ACF/PACF) Plot
Library: pygal 3.1.0 | Python 3.13.13
Quality: 85/100 | Updated: 2026-06-10
"""

import os
import sys


# Remove this file's directory from sys.path so `import pygal` resolves to the
# installed package, not this script (which shares the same name).
_this_dir = os.path.dirname(os.path.abspath(__file__))
sys.path = [p for p in sys.path if os.path.abspath(p or ".") != _this_dir]

import io
import xml.etree.ElementTree as ET

import cairosvg
import numpy as np
import pygal
from PIL import Image, ImageDraw, ImageFont
from pygal.style import Style
from statsmodels.tsa.stattools import acf, pacf


# Theme-adaptive tokens (Imprint palette)
THEME = os.getenv("ANYPLOT_THEME", "light")
PAGE_BG = "#FAF8F1" if THEME == "light" else "#1A1A17"
INK = "#1A1A17" if THEME == "light" else "#F0EFE8"
INK_MUTED = "#6B6A63" if THEME == "light" else "#A8A79F"

# Imprint categorical palette — canonical order, theme-independent
IMPRINT_PALETTE = ("#009E73", "#C475FD", "#4467A3", "#BD8233", "#AE3030", "#2ABCCD", "#954477", "#99B314")
ANYPLOT_AMBER = "#DDCC77"  # significance threshold lines (caution/warning role)

# Semantic color roles for this chart
HIGHLIGHT_COLOR = IMPRINT_PALETTE[0]  # #009E73 — significant bars (first series, always)
MUTED_BAR_COLOR = INK_MUTED  # non-significant bars
CONF_LINE_COLOR = ANYPLOT_AMBER  # 95% CI threshold lines
ZERO_LINE_COLOR = INK_MUTED  # zero baseline


def hex_to_rgb(hex_str):
    h = hex_str.lstrip("#")
    return tuple(int(h[i : i + 2], 16) for i in (0, 2, 4))


# Data — synthetic monthly airline-style passenger data with trend and seasonality
np.random.seed(42)
n_obs = 200
t = np.arange(n_obs)
trend = 0.05 * t
seasonal = 10 * np.sin(2 * np.pi * t / 12)
noise = np.random.normal(0, 2, n_obs)
passengers = 100 + trend + seasonal + noise

# ACF/PACF computation
n_lags = 36
acf_values = acf(passengers, nlags=n_lags, fft=True)
pacf_values = pacf(passengers, nlags=n_lags, method="ywm")
conf_bound = 1.96 / np.sqrt(n_obs)

# Style — Imprint palette, theme-adaptive chrome; canvas = 3200×1800 (two 3200×900 panels)
custom_style = Style(
    background=PAGE_BG,
    plot_background=PAGE_BG,
    foreground=INK,
    foreground_strong=INK,
    foreground_subtle=INK_MUTED,
    colors=IMPRINT_PALETTE,
    title_font_size=66,
    label_font_size=56,
    major_label_font_size=44,
    legend_font_size=44,
    value_font_size=36,
    stroke_width=2.5,
    font_family="'Helvetica Neue', 'Helvetica', 'Arial', sans-serif",
    title_font_family="'Helvetica Neue', 'Helvetica', 'Arial', sans-serif",
    label_font_family="'Helvetica Neue', 'Helvetica', 'Arial', sans-serif",
    value_font_family="'Helvetica Neue', 'Helvetica', 'Arial', sans-serif",
)

# Y-axis ranges tailored to data
acf_min, acf_max = -0.5, 1.1
pacf_min, pacf_max = -0.5, 1.0

# Each panel: 3200×900; two panels stacked → 3200×1800 landscape
common_config = {
    "width": 3200,
    "height": 900,
    "style": custom_style,
    "show_legend": False,
    "show_y_guides": True,
    "show_x_guides": False,
    "margin": 20,
    "margin_left": 130,
    "margin_right": 60,
    "spacing": 80,
    "truncate_label": -1,
    "print_values": False,
    "show_minor_x_labels": False,
    "x_labels_major_every": 4,
    "rounded_bars": 2,
}

# ACF chart (top panel)
acf_chart = pygal.Bar(
    **common_config,
    x_title="",
    y_title="ACF",
    title="acf-pacf · python · pygal · anyplot.ai",
    margin_bottom=10,
    margin_top=30,
    range=(acf_min, acf_max),
)
acf_chart.x_labels = [str(i) for i in range(n_lags + 1)]
acf_chart.y_labels = [-0.4, -0.2, 0.0, 0.5, 1.0]
acf_chart.add(
    "ACF",
    [{"value": round(v, 4), "color": HIGHLIGHT_COLOR if abs(v) > conf_bound else MUTED_BAR_COLOR} for v in acf_values],
)

# PACF chart (bottom panel)
pacf_chart = pygal.Bar(
    **common_config, x_title="Lag", y_title="PACF", title="", margin_bottom=70, margin_top=5, range=(pacf_min, pacf_max)
)
pacf_chart.x_labels = [str(i) for i in range(1, n_lags + 1)]
pacf_chart.y_labels = [-0.4, -0.2, 0.0, 0.5, 1.0]
pacf_chart.add(
    "PACF",
    [
        {"value": round(v, 4), "color": HIGHLIGHT_COLOR if abs(v) > conf_bound else MUTED_BAR_COLOR}
        for v in pacf_values[1:]
    ],
)

# SVG namespace registration
ns = "http://www.w3.org/2000/svg"
ET.register_namespace("", ns)
ET.register_namespace("xlink", "http://www.w3.org/1999/xlink")


def _inject_ci_lines(chart, y_min, y_max):
    """Inject CI dashed lines and zero baseline into pygal's SVG (no native reference-line API)."""
    root = ET.fromstring(chart.render())
    plot_group = next((g for g in root.iter(f"{{{ns}}}g") if g.get("class", "") == "plot"), None)
    if plot_group is not None:
        bg_rect = next((r for r in plot_group.iter(f"{{{ns}}}rect") if r.get("class", "") == "background"), None)
        if bg_rect is not None:
            pw, ph = float(bg_rect.get("width")), float(bg_rect.get("height"))
            y_range = y_max - y_min
            # 95% CI bounds (dashed amber lines)
            for cv in [conf_bound, -conf_bound]:
                ly = (y_max - cv) / y_range * ph
                line = ET.SubElement(plot_group, f"{{{ns}}}line")
                line.set("x1", "0")
                line.set("y1", f"{ly:.1f}")
                line.set("x2", str(pw))
                line.set("y2", f"{ly:.1f}")
                line.set("stroke", CONF_LINE_COLOR)
                line.set("stroke-width", "3")
                line.set("stroke-dasharray", "18,10")
                line.set("opacity", "0.9")
            # Zero baseline (muted solid line)
            zy = (y_max - 0) / y_range * ph
            zline = ET.SubElement(plot_group, f"{{{ns}}}line")
            zline.set("x1", "0")
            zline.set("y1", f"{zy:.1f}")
            zline.set("x2", str(pw))
            zline.set("y2", f"{zy:.1f}")
            zline.set("stroke", ZERO_LINE_COLOR)
            zline.set("stroke-width", "2.5")
            zline.set("opacity", "0.6")
    return root


# Render both panels
panels = []
svg_strings = []
for chart, y_min, y_max in [(acf_chart, acf_min, acf_max), (pacf_chart, pacf_min, pacf_max)]:
    root = _inject_ci_lines(chart, y_min, y_max)
    svg_bytes = ET.tostring(root)
    svg_strings.append(ET.tostring(root, encoding="unicode"))
    png_data = cairosvg.svg2png(bytestring=svg_bytes, output_width=3200, output_height=900)
    img = Image.open(io.BytesIO(png_data)).convert("RGB")
    img = img.resize((3200, 900), Image.LANCZOS)
    panels.append(img)

# Compose 3200×1800 landscape canvas
combined = Image.new("RGB", (3200, 1800), hex_to_rgb(PAGE_BG))
combined.paste(panels[0], (0, 0))
combined.paste(panels[1], (0, 900))

# Subtle divider between panels
draw = ImageDraw.Draw(combined)
draw.line([(130, 900), (3140, 900)], fill=hex_to_rgb(INK_MUTED), width=1)

# CI annotation in upper-right margin
try:
    font = ImageFont.truetype("/usr/share/fonts/truetype/dejavu/DejaVuSans.ttf", 30)
except OSError:
    font = ImageFont.load_default()
draw.text((2640, 24), f"95% CI: ±{conf_bound:.3f}", fill=CONF_LINE_COLOR, font=font)

combined.save(f"plot-{THEME}.png", dpi=(300, 300))

# Interactive HTML output (pygal renders interactive SVG charts)
html_content = (
    "<!DOCTYPE html>\n<html>\n<head>\n"
    "    <title>acf-pacf · python · pygal · anyplot.ai</title>\n"
    "    <style>\n"
    f"        body {{ font-family: 'Helvetica Neue', sans-serif; background: {PAGE_BG}; color: {INK}; margin: 0; padding: 20px; }}\n"
    "        .container { max-width: 1200px; margin: 0 auto; }\n"
    "        .chart { width: 100%; margin: 10px 0; }\n"
    "    </style>\n</head>\n<body>\n"
    "    <div class='container'>\n"
    f"        <div class='chart'>{svg_strings[0]}</div>\n"
    f"        <div class='chart'>{svg_strings[1]}</div>\n"
    "    </div>\n</body>\n</html>"
)

with open(f"plot-{THEME}.html", "w") as f:
    f.write(html_content)
Runnable source as JSON, for any HTTP client: https://api.anyplot.ai/specs/acf-pacf/pygal/code. Any spec id and library id listed in llms-full.txt fit the same URL shape; every URL below is complete and callable.
{
  "spec_id": "acf-pacf",
  "language": "python",
  "library": "pygal",
  "page": "https://anyplot.ai/acf-pacf/python/pygal",
  "hub": "https://anyplot.ai/acf-pacf",
  "code_json": "https://api.anyplot.ai/specs/acf-pacf/pygal/code",
  "spec_json": "https://api.anyplot.ai/specs/acf-pacf",
  "render_light_png": "https://storage.googleapis.com/anyplot-images/plots/acf-pacf/python/pygal/plot-light.png",
  "render_dark_png": "https://storage.googleapis.com/anyplot-images/plots/acf-pacf/python/pygal/plot-dark.png",
  "interactive_light_html": "https://storage.googleapis.com/anyplot-images/plots/acf-pacf/python/pygal/plot-light.html",
  "interactive_dark_html": "https://storage.googleapis.com/anyplot-images/plots/acf-pacf/python/pygal/plot-dark.html",
  "quality_score": 85.0,
  "license": "MIT",
  "guide": "https://anyplot.ai/llms.txt"
}
Part of Autocorrelation and Partial Autocorrelation (ACF/PACF) Plot on anyplot.ai.