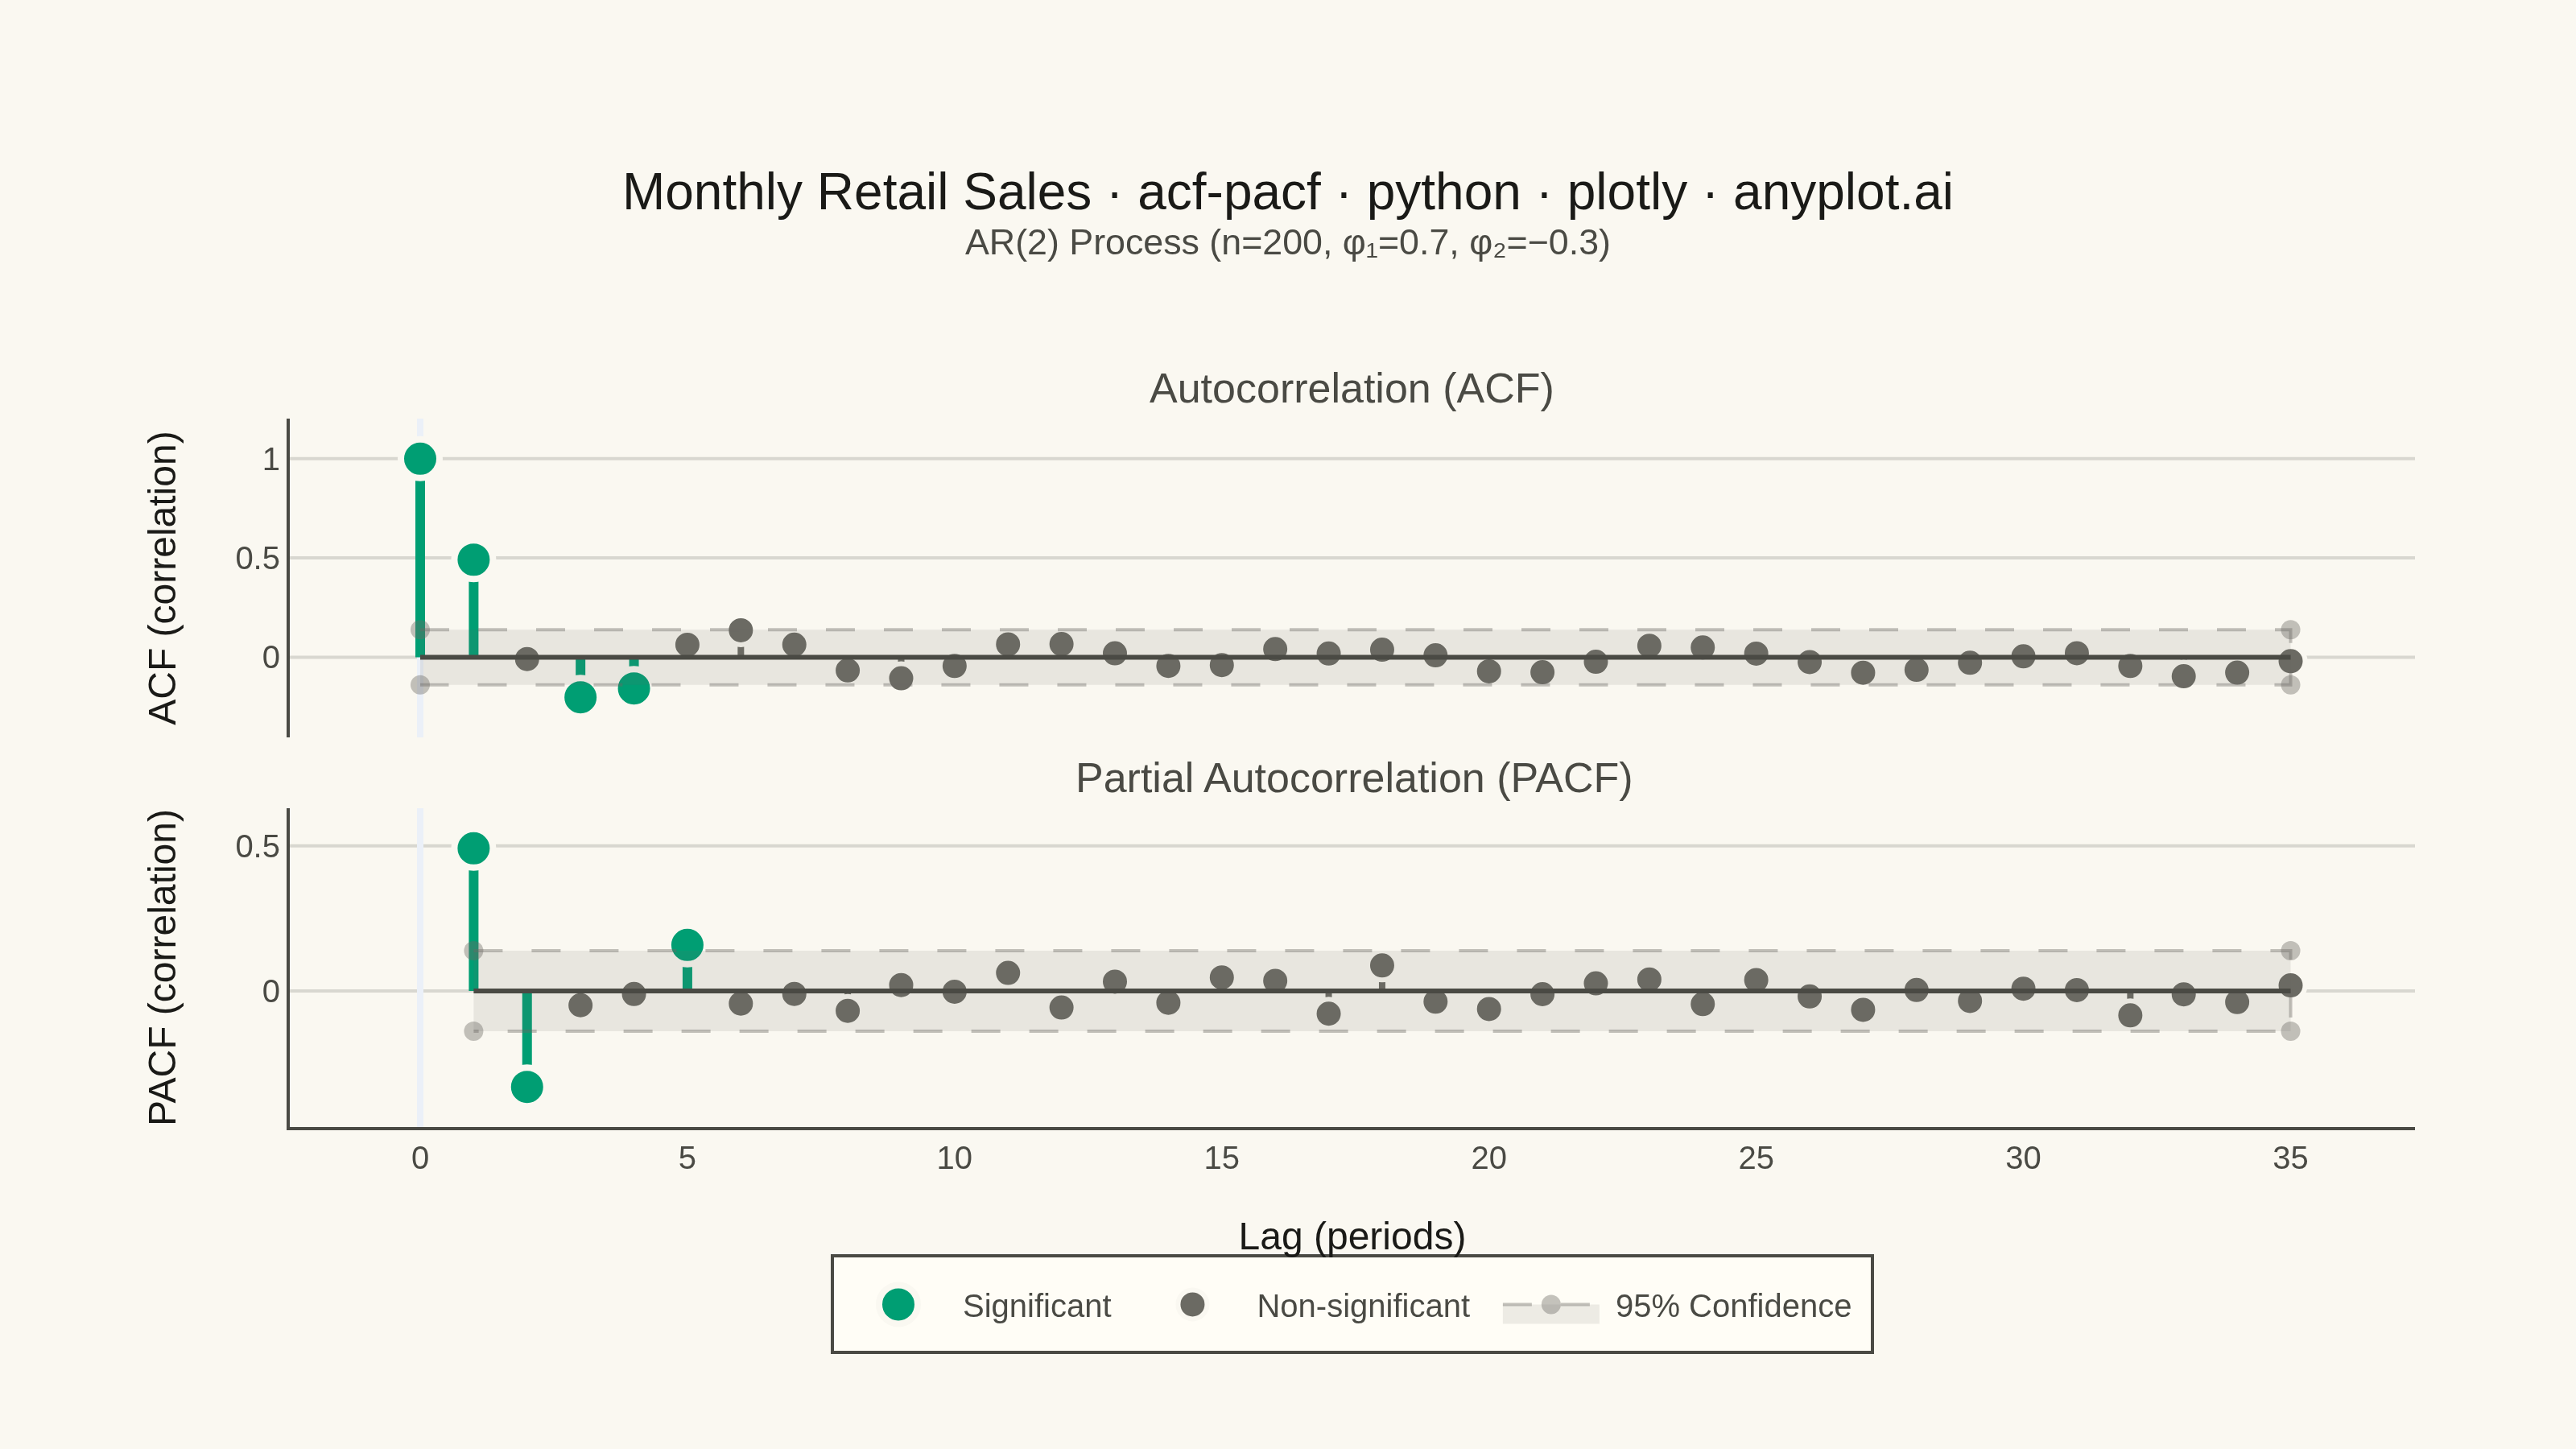
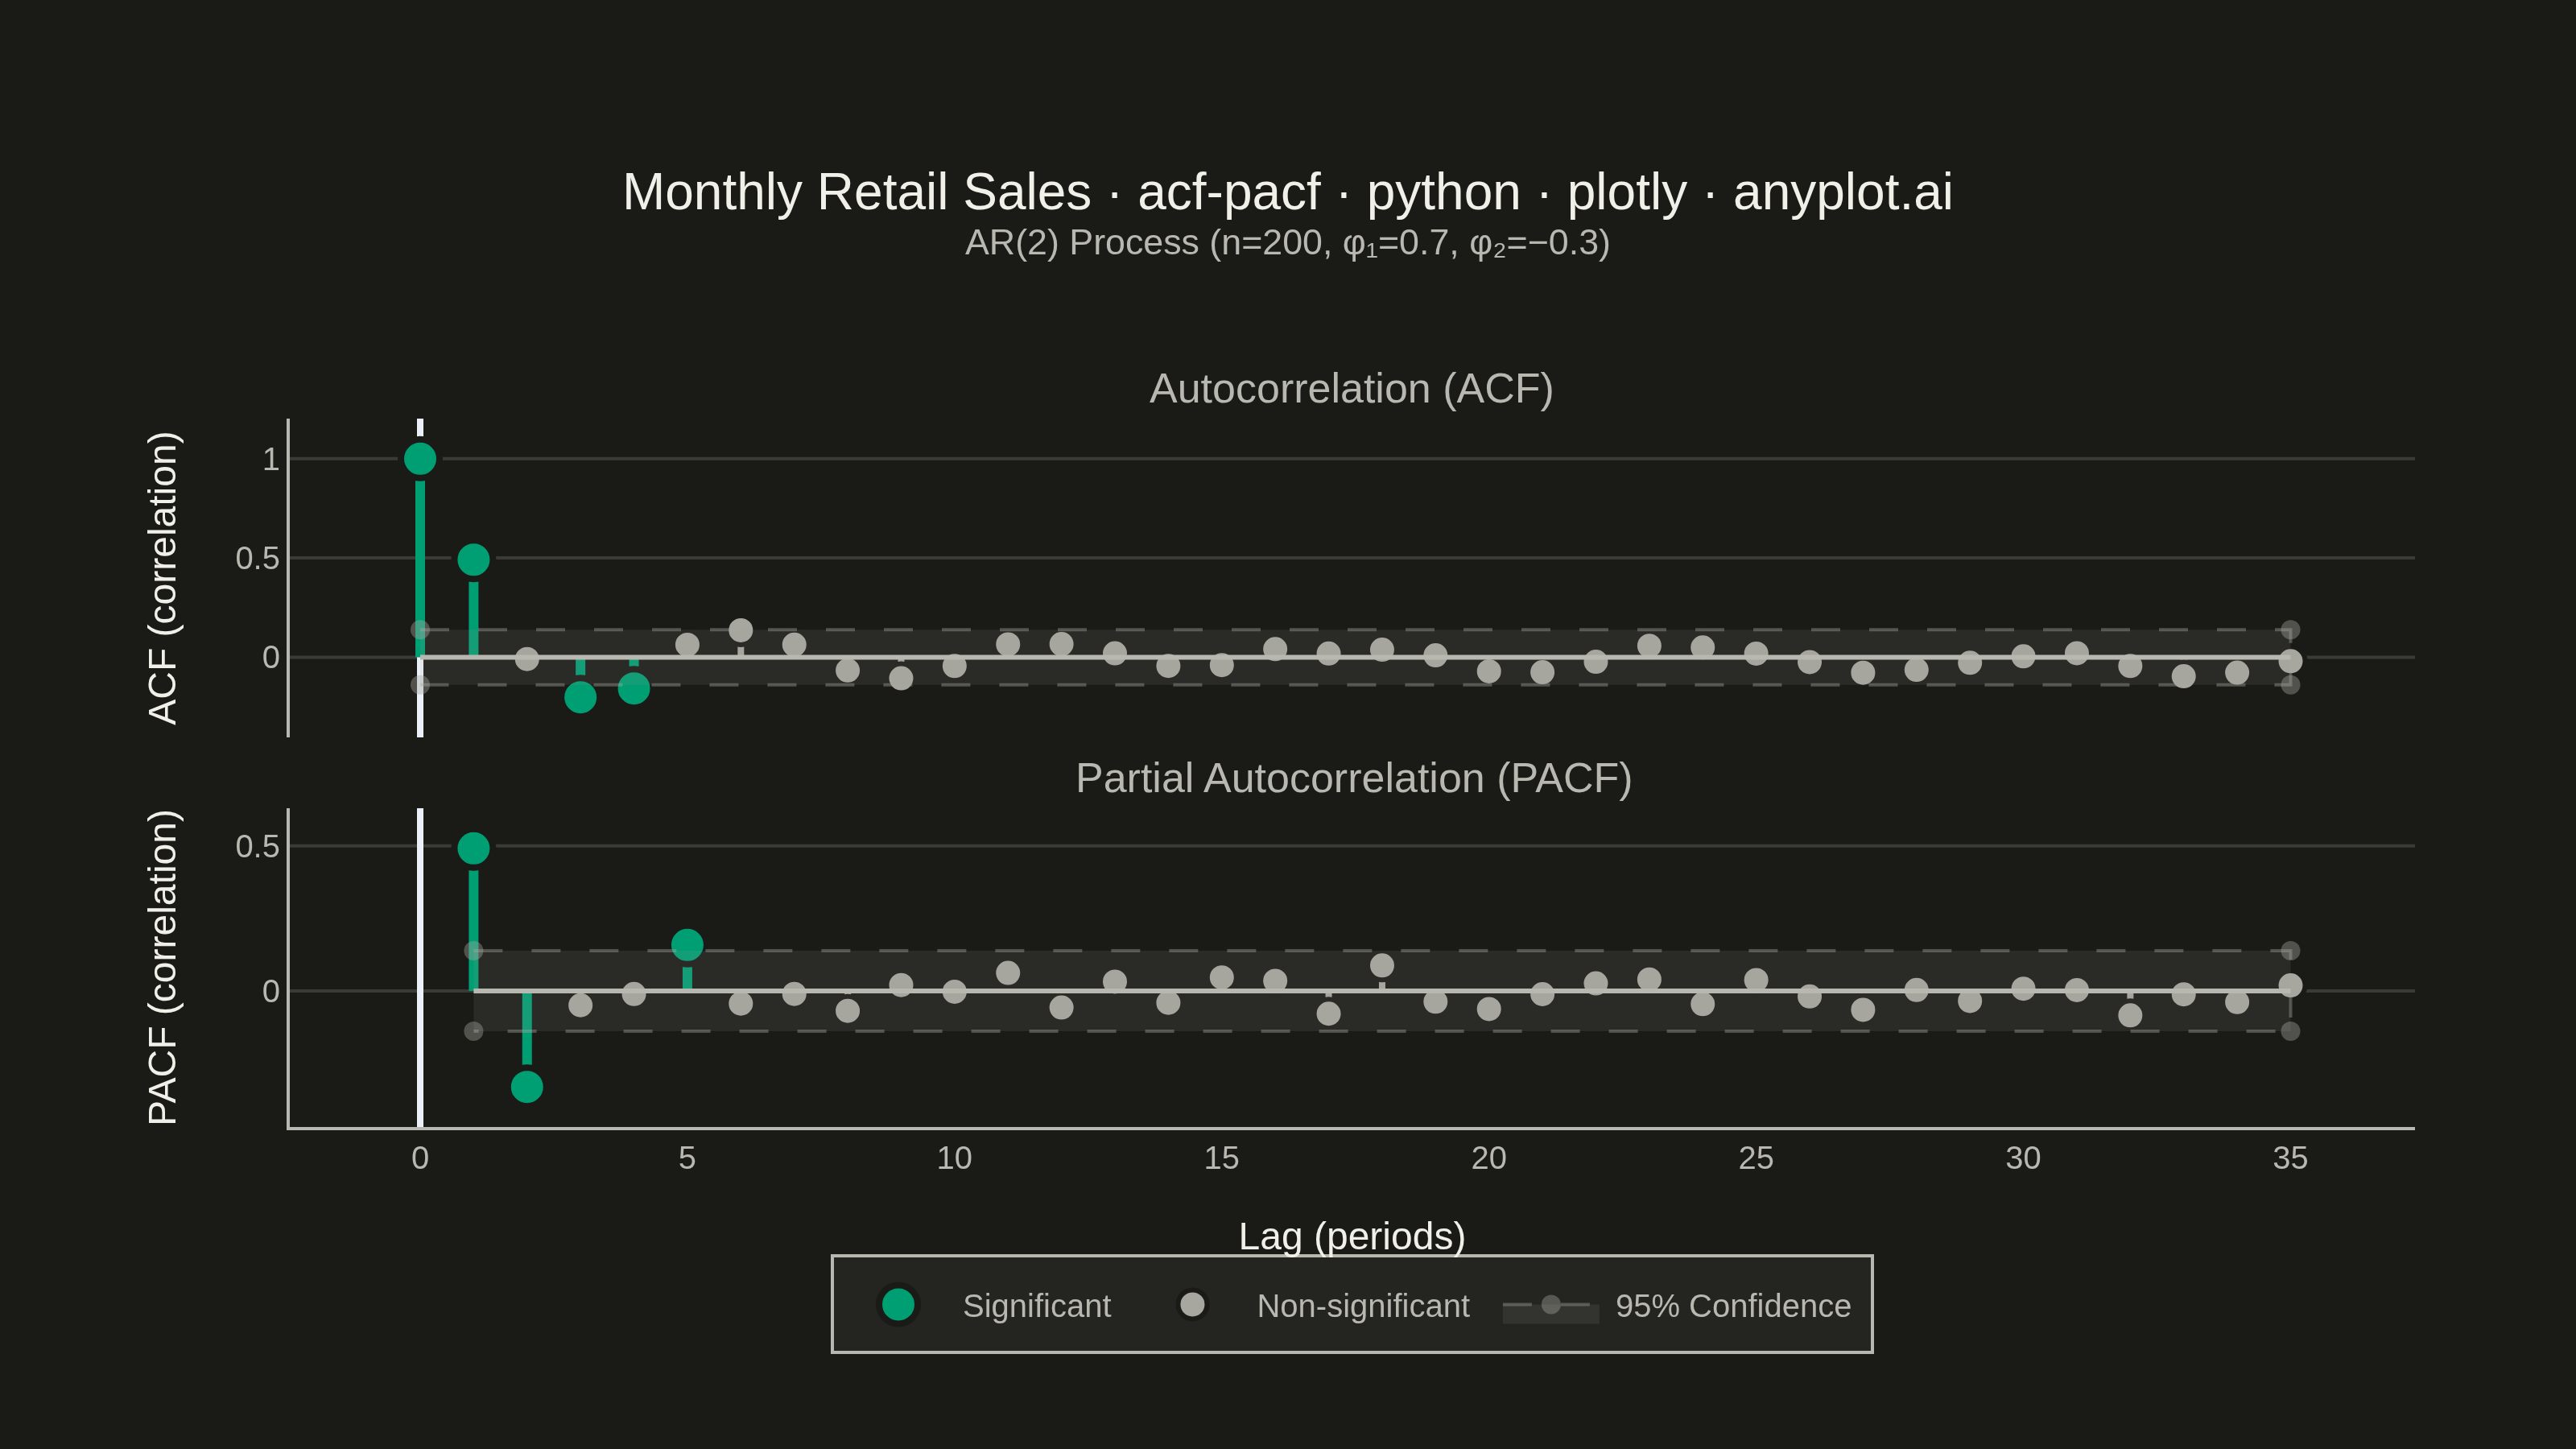
Displays the autocorrelation function (ACF) and partial autocorrelation function (PACF) of a time series as vertical stem/bar plots arranged in two vertically stacked subplots. Each lag is represented by a vertical line from zero to the correlation value, with horizontal dashed lines indicating 95% confidence bounds. These plots are essential for identifying the order of AR and MA components in ARIMA modeling and for diagnosing residual independence.
""" anyplot.ai
acf-pacf: Autocorrelation and Partial Autocorrelation (ACF/PACF) Plot
Library: plotly 6.8.0 | Python 3.13.13
Quality: 91/100 | Updated: 2026-06-10
"""

import os

import numpy as np
import plotly.graph_objects as go
from plotly.subplots import make_subplots


# Theme tokens
THEME = os.getenv("ANYPLOT_THEME", "light")
PAGE_BG = "#FAF8F1" if THEME == "light" else "#1A1A17"
ELEVATED_BG = "#FFFDF6" if THEME == "light" else "#242420"
INK = "#1A1A17" if THEME == "light" else "#F0EFE8"
INK_SOFT = "#4A4A44" if THEME == "light" else "#B8B7B0"
INK_MUTED = "#6B6A63" if THEME == "light" else "#A8A79F"
GRID = "rgba(26,26,23,0.15)" if THEME == "light" else "rgba(240,239,232,0.15)"

# Imprint palette — position 1 for significant lags
BRAND = "#009E73"

# Confidence band fill/border (INK_MUTED at low opacity)
band_fill = "rgba(107,106,99,0.12)" if THEME == "light" else "rgba(168,167,159,0.12)"
band_border = "rgba(107,106,99,0.40)" if THEME == "light" else "rgba(168,167,159,0.40)"

# Data — monthly retail sales AR(2) process
np.random.seed(42)
n_obs = 200
ar1_coeff, ar2_coeff = 0.7, -0.3
series = np.zeros(n_obs)
noise = np.random.normal(0, 1, n_obs)
for t in range(2, n_obs):
    series[t] = ar1_coeff * series[t - 1] + ar2_coeff * series[t - 2] + noise[t]

# Compute ACF
n_lags = 35
series_centered = series - np.mean(series)
variance = np.sum(series_centered**2)
acf_values = np.array(
    [np.sum(series_centered[: n_obs - k] * series_centered[k:]) / variance for k in range(n_lags + 1)]
)

# Compute PACF via Durbin-Levinson recursion
pacf_values = np.zeros(n_lags + 1)
pacf_values[0] = 1.0
pacf_values[1] = acf_values[1]
phi = np.zeros((n_lags + 1, n_lags + 1))
phi[1, 1] = acf_values[1]
for k in range(2, n_lags + 1):
    num = acf_values[k] - np.sum(phi[k - 1, 1:k] * acf_values[k - 1 : 0 : -1])
    den = 1.0 - np.sum(phi[k - 1, 1:k] * acf_values[1:k])
    phi[k, k] = num / den if abs(den) > 1e-12 else 0.0
    for j in range(1, k):
        phi[k, j] = phi[k - 1, j] - phi[k, k] * phi[k - 1, k - j]
    pacf_values[k] = phi[k, k]

conf_bound = 1.96 / np.sqrt(n_obs)
lags_acf = np.arange(0, n_lags + 1)
lags_pacf = np.arange(1, n_lags + 1)
pacf_plot = pacf_values[1:]

acf_significant = np.abs(acf_values) > conf_bound
pacf_significant = np.abs(pacf_plot) > conf_bound

# Build stem coords using None separators (one trace per class, not per stem)
acf_sig_x, acf_sig_y, acf_nsig_x, acf_nsig_y = [], [], [], []
for lag, val, sig in zip(lags_acf, acf_values, acf_significant, strict=False):
    (acf_sig_x if sig else acf_nsig_x).extend([int(lag), int(lag), None])
    (acf_sig_y if sig else acf_nsig_y).extend([0, float(val), None])

pacf_sig_x, pacf_sig_y, pacf_nsig_x, pacf_nsig_y = [], [], [], []
for lag, val, sig in zip(lags_pacf, pacf_plot, pacf_significant, strict=False):
    (pacf_sig_x if sig else pacf_nsig_x).extend([int(lag), int(lag), None])
    (pacf_sig_y if sig else pacf_nsig_y).extend([0, float(val), None])

# Plot
fig = make_subplots(
    rows=2,
    cols=1,
    shared_xaxes=True,
    vertical_spacing=0.10,
    subplot_titles=["Autocorrelation (ACF)", "Partial Autocorrelation (PACF)"],
)

hover_tpl = "Lag %{x}<br>Correlation: %{y:.3f}<extra></extra>"

# ACF stems (row 1)
if acf_sig_x:
    fig.add_trace(
        go.Scatter(
            x=acf_sig_x,
            y=acf_sig_y,
            mode="lines",
            line={"color": BRAND, "width": 3},
            showlegend=False,
            hoverinfo="skip",
        ),
        row=1,
        col=1,
    )
if acf_nsig_x:
    fig.add_trace(
        go.Scatter(
            x=acf_nsig_x,
            y=acf_nsig_y,
            mode="lines",
            line={"color": INK_MUTED, "width": 2},
            showlegend=False,
            hoverinfo="skip",
        ),
        row=1,
        col=1,
    )
if np.any(acf_significant):
    fig.add_trace(
        go.Scatter(
            x=lags_acf[acf_significant],
            y=acf_values[acf_significant],
            mode="markers",
            name="Significant",
            marker={"size": 12, "color": BRAND, "line": {"color": PAGE_BG, "width": 2}},
            hovertemplate=hover_tpl,
        ),
        row=1,
        col=1,
    )
if np.any(~acf_significant):
    fig.add_trace(
        go.Scatter(
            x=lags_acf[~acf_significant],
            y=acf_values[~acf_significant],
            mode="markers",
            name="Non-significant",
            marker={"size": 9, "color": INK_MUTED, "line": {"color": PAGE_BG, "width": 1.5}},
            hovertemplate=hover_tpl,
        ),
        row=1,
        col=1,
    )

# PACF stems (row 2)
if pacf_sig_x:
    fig.add_trace(
        go.Scatter(
            x=pacf_sig_x,
            y=pacf_sig_y,
            mode="lines",
            line={"color": BRAND, "width": 3},
            showlegend=False,
            hoverinfo="skip",
        ),
        row=2,
        col=1,
    )
if pacf_nsig_x:
    fig.add_trace(
        go.Scatter(
            x=pacf_nsig_x,
            y=pacf_nsig_y,
            mode="lines",
            line={"color": INK_MUTED, "width": 2},
            showlegend=False,
            hoverinfo="skip",
        ),
        row=2,
        col=1,
    )
if np.any(pacf_significant):
    fig.add_trace(
        go.Scatter(
            x=lags_pacf[pacf_significant],
            y=pacf_plot[pacf_significant],
            mode="markers",
            showlegend=False,
            marker={"size": 12, "color": BRAND, "line": {"color": PAGE_BG, "width": 2}},
            hovertemplate=hover_tpl,
        ),
        row=2,
        col=1,
    )
if np.any(~pacf_significant):
    fig.add_trace(
        go.Scatter(
            x=lags_pacf[~pacf_significant],
            y=pacf_plot[~pacf_significant],
            mode="markers",
            showlegend=False,
            marker={"size": 9, "color": INK_MUTED, "line": {"color": PAGE_BG, "width": 1.5}},
            hovertemplate=hover_tpl,
        ),
        row=2,
        col=1,
    )

# Confidence bands and zero baselines
for row in [1, 2]:
    x_start, x_end = (0, n_lags) if row == 1 else (1, n_lags)
    fig.add_trace(
        go.Scatter(
            x=[x_start, x_end, x_end, x_start],
            y=[conf_bound, conf_bound, -conf_bound, -conf_bound],
            fill="toself",
            fillcolor=band_fill,
            line={"color": band_border, "width": 1, "dash": "dash"},
            showlegend=(row == 1),
            name="95% Confidence",
            hoverinfo="skip",
        ),
        row=row,
        col=1,
    )
    fig.add_trace(
        go.Scatter(
            x=[x_start, x_end],
            y=[0, 0],
            mode="lines",
            line={"color": INK_SOFT, "width": 1.5},
            showlegend=False,
            hoverinfo="skip",
        ),
        row=row,
        col=1,
    )

# Title (length-adaptive font size)
title_str = "Monthly Retail Sales · acf-pacf · python · plotly · anyplot.ai"
subtitle = "AR(2) Process (n=200, φ₁=0.7, φ₂=−0.3)"
n = len(title_str)
title_size = round(16 * (67 / n)) if n > 67 else 16

# Layout
fig.update_layout(
    autosize=False,
    width=800,
    height=450,
    template="plotly_white",
    paper_bgcolor=PAGE_BG,
    plot_bgcolor=PAGE_BG,
    margin={"l": 90, "r": 50, "t": 130, "b": 100},
    title={
        "text": f"{title_str}<br><sup style='color:{INK_SOFT};font-size:11px'>{subtitle}</sup>",
        "font": {"size": title_size, "color": INK},
        "x": 0.5,
        "xanchor": "center",
    },
    legend={
        "orientation": "h",
        "yanchor": "top",
        "y": -0.18,
        "xanchor": "center",
        "x": 0.5,
        "font": {"size": 10, "color": INK_SOFT},
        "bgcolor": ELEVATED_BG,
        "bordercolor": INK_SOFT,
        "borderwidth": 1,
    },
    hoverlabel={"font_size": 13},
)

# Subplot title font
for annotation in fig.layout.annotations:
    annotation.font = {"size": 13, "color": INK_SOFT}

# Y-axes
for row, label in [(1, "ACF (correlation)"), (2, "PACF (correlation)")]:
    fig.update_yaxes(
        title_text=label,
        title_font={"size": 12, "color": INK},
        tickfont={"size": 10, "color": INK_SOFT},
        showgrid=True,
        gridcolor=GRID,
        zeroline=False,
        showline=True,
        linecolor=INK_SOFT,
        row=row,
        col=1,
    )

# X-axes (global then row-specific)
fig.update_xaxes(
    tickfont={"size": 10, "color": INK_SOFT},
    linecolor=INK_SOFT,
    showgrid=False,
    showspikes=True,
    spikecolor=INK_MUTED,
    spikethickness=1,
    spikedash="dot",
    spikemode="across",
)
fig.update_xaxes(showline=True, title_text="Lag (periods)", title_font={"size": 12, "color": INK}, row=2, col=1)
fig.update_xaxes(showline=False, row=1, col=1)

# Save
fig.write_image(f"plot-{THEME}.png", width=800, height=450, scale=4)
fig.write_html(f"plot-{THEME}.html", include_plotlyjs="cdn")
Runnable source as JSON, for any HTTP client: https://api.anyplot.ai/specs/acf-pacf/plotly/code. Any spec id and library id listed in llms-full.txt fit the same URL shape; every URL below is complete and callable.
{
  "spec_id": "acf-pacf",
  "language": "python",
  "library": "plotly",
  "page": "https://anyplot.ai/acf-pacf/python/plotly",
  "hub": "https://anyplot.ai/acf-pacf",
  "code_json": "https://api.anyplot.ai/specs/acf-pacf/plotly/code",
  "spec_json": "https://api.anyplot.ai/specs/acf-pacf",
  "render_light_png": "https://storage.googleapis.com/anyplot-images/plots/acf-pacf/python/plotly/plot-light.png",
  "render_dark_png": "https://storage.googleapis.com/anyplot-images/plots/acf-pacf/python/plotly/plot-dark.png",
  "interactive_light_html": "https://storage.googleapis.com/anyplot-images/plots/acf-pacf/python/plotly/plot-light.html",
  "interactive_dark_html": "https://storage.googleapis.com/anyplot-images/plots/acf-pacf/python/plotly/plot-dark.html",
  "quality_score": 91.0,
  "license": "MIT",
  "guide": "https://anyplot.ai/llms.txt"
}
Part of Autocorrelation and Partial Autocorrelation (ACF/PACF) Plot on anyplot.ai.