The same plot in 14 other libraries — JavaScript: D3.js, Apache ECharts, Highcharts, MUI X Charts; Python: Altair, Bokeh, lets-plot, Matplotlib, Plotly, plotnine, Pygal, Seaborn; R: ggplot2; Julia: Makie.jl. Compare all 15 side by side: Autocorrelation and Partial Autocorrelation (ACF/PACF) Plot in Python, R, Julia and JavaScript.
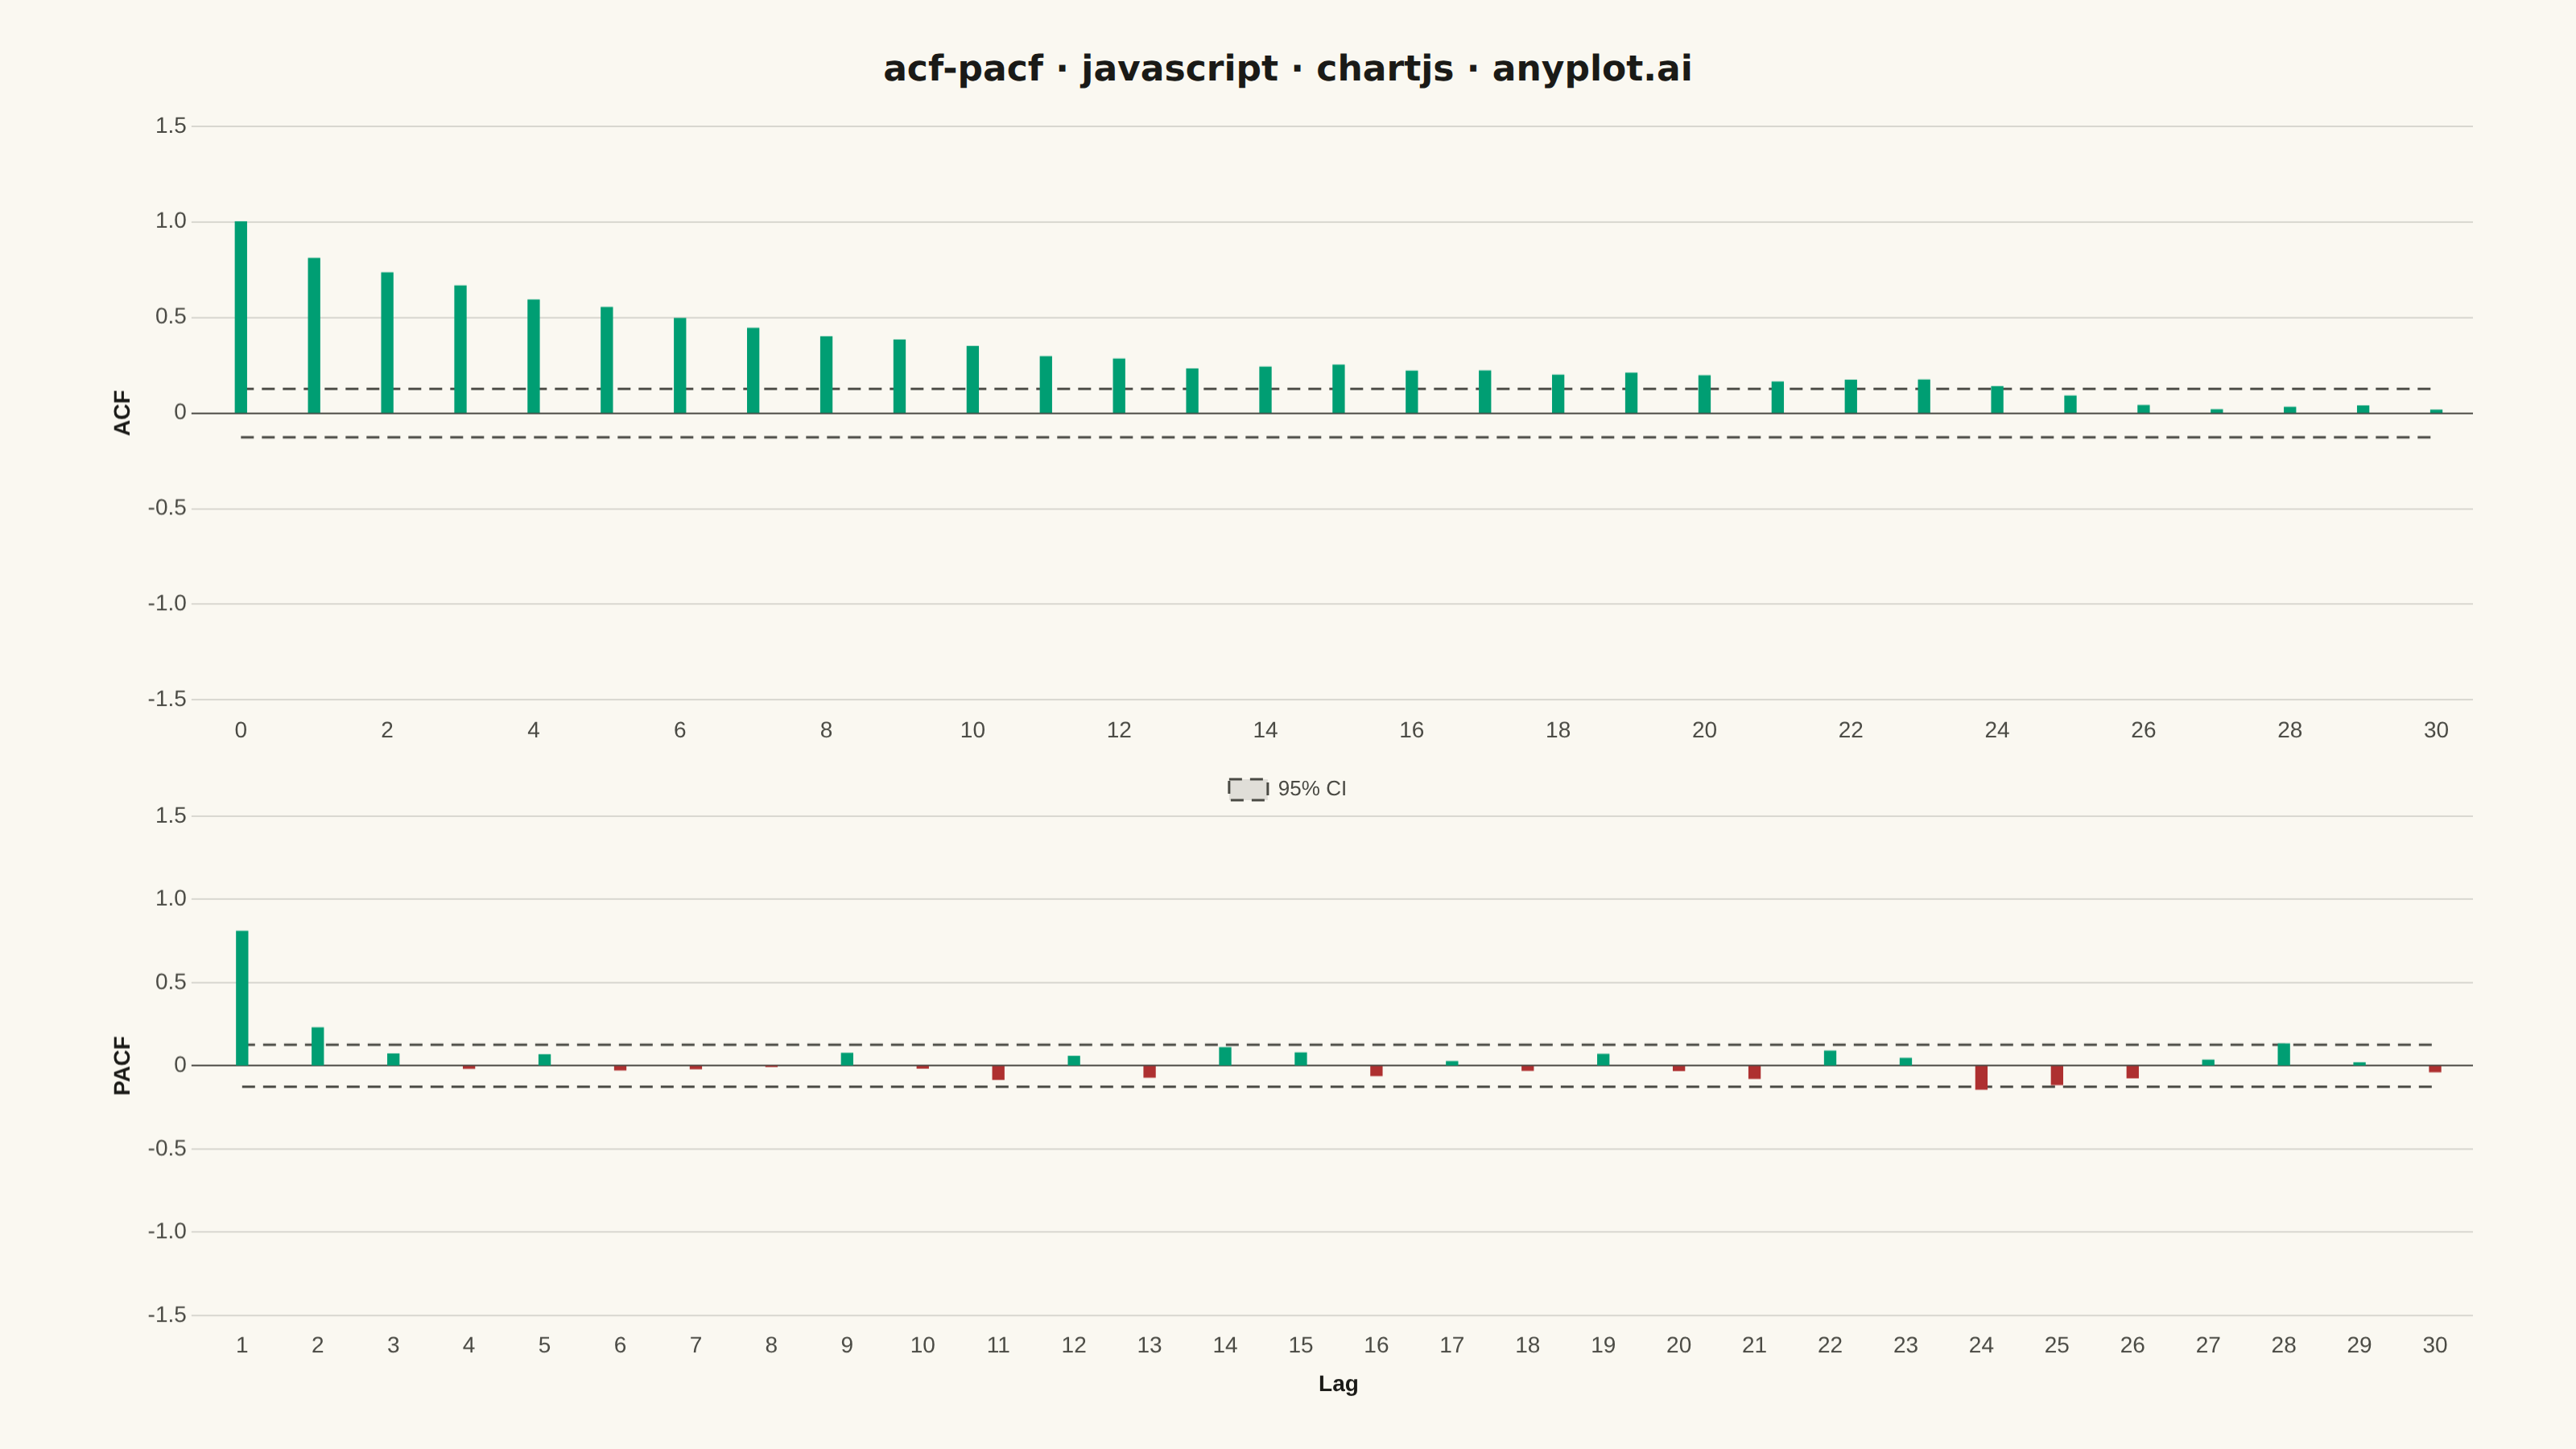
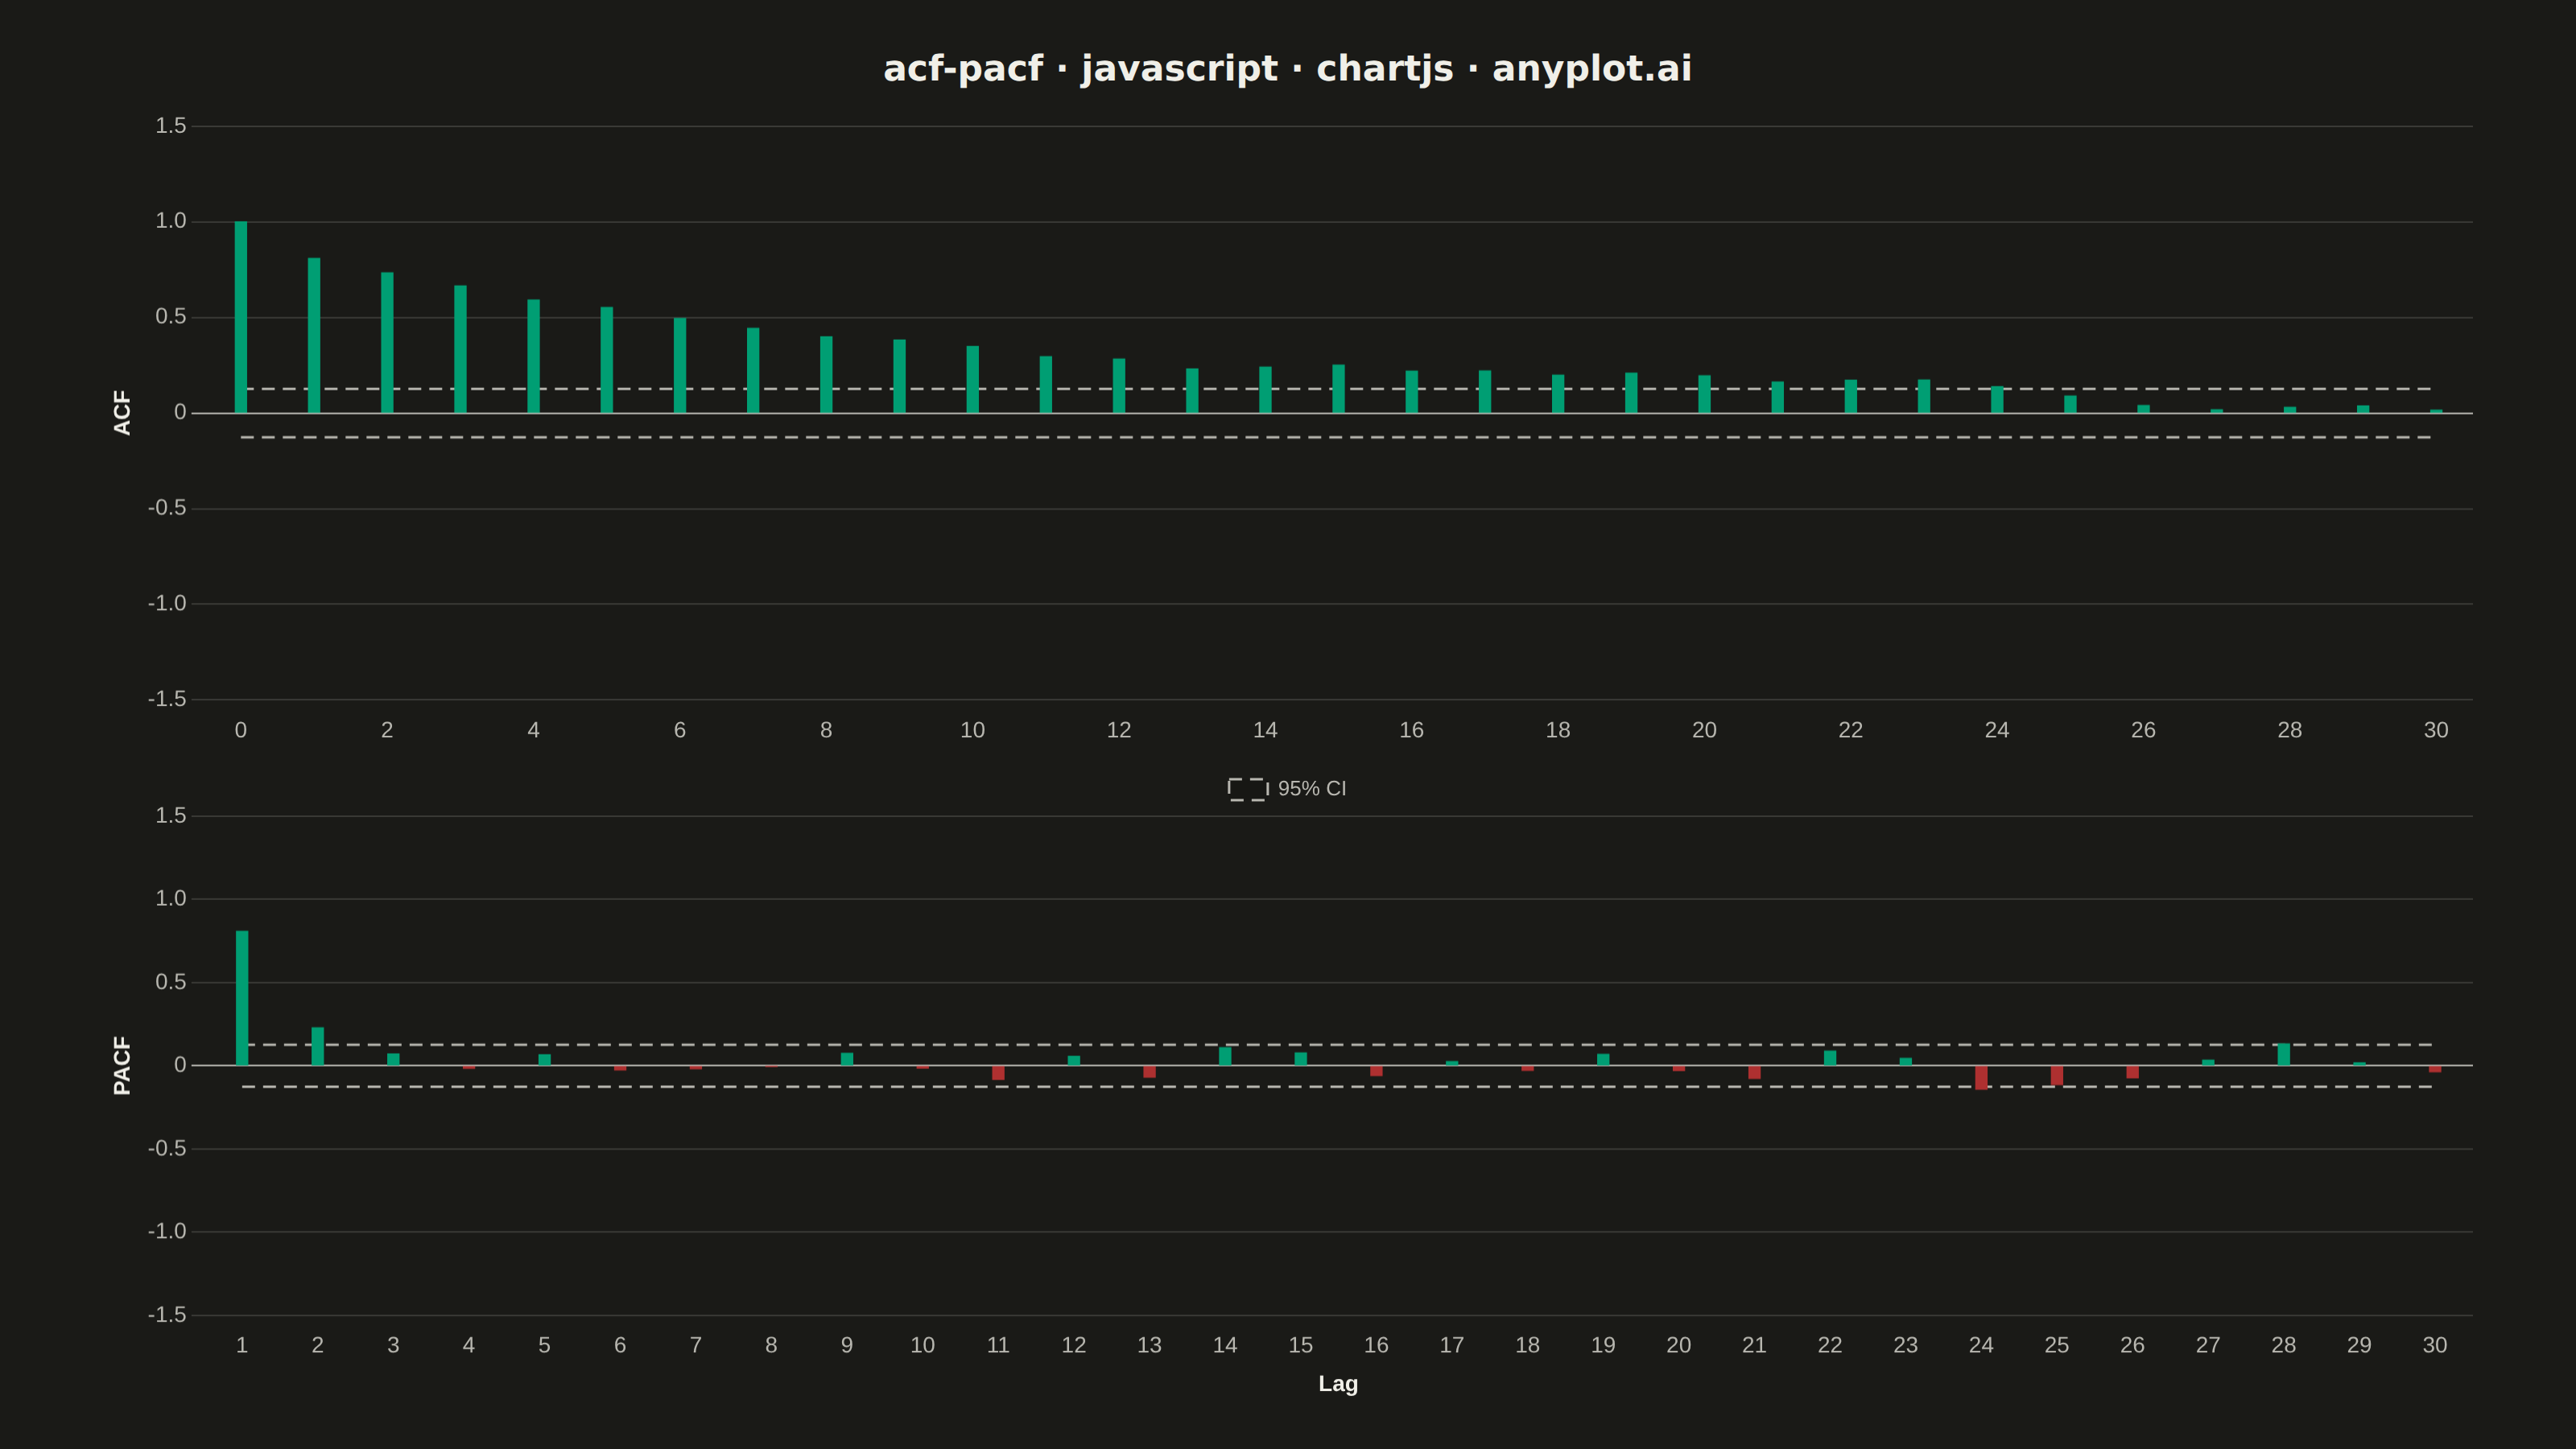
Displays the autocorrelation function (ACF) and partial autocorrelation function (PACF) of a time series as vertical stem/bar plots arranged in two vertically stacked subplots. Each lag is represented by a vertical line from zero to the correlation value, with horizontal dashed lines indicating 95% confidence bounds. These plots are essential for identifying the order of AR and MA components in ARIMA modeling and for diagnosing residual independence.
// anyplot.ai
// acf-pacf: Autocorrelation and Partial Autocorrelation (ACF/PACF) Plot
// Library: chartjs 4.4.7 | JavaScript 22.22.3
// Quality: 84/100 | Created: 2026-06-10

//# anyplot-orientation: landscape

const t = window.ANYPLOT_TOKENS;

// Deterministic LCG for reproducible pseudo-random numbers (no seeded RNG in browser)
let _seed = 42;
function lcgRand() {
  _seed = (Math.imul(1664525, _seed) + 1013904223) >>> 0;
  return _seed / 4294967296;
}
function stdNormal() {
  const u1 = lcgRand() || 1e-10;
  return Math.sqrt(-2 * Math.log(u1)) * Math.cos(2 * Math.PI * lcgRand());
}

// AR(2) process: x_t = 0.7*x_{t-1} + 0.2*x_{t-2} + ε_t
// Classic diagnostic: ACF decays exponentially; PACF cuts off exactly after lag 2
const N = 240;
const series = [stdNormal(), stdNormal()];
for (let i = 2; i < N; i++) {
  series.push(0.7 * series[i - 1] + 0.2 * series[i - 2] + stdNormal());
}

// Sample ACF at lags 0..maxLag (biased estimator, consistent with standard practice)
function computeACF(s, maxLag) {
  const n = s.length;
  const mean = s.reduce((a, b) => a + b, 0) / n;
  const variance = s.reduce((a, b) => a + (b - mean) ** 2, 0) / n;
  return Array.from({ length: maxLag + 1 }, (_, k) => {
    const cov = s
      .slice(0, n - k)
      .reduce((sum, v, i) => sum + (v - mean) * (s[i + k] - mean), 0);
    return cov / (n * variance);
  });
}

// PACF at lags 1..maxLag via Levinson-Durbin recursion
function computePACF(acfVals, maxLag) {
  const result = [acfVals[1]];
  let phi = [acfVals[1]];
  for (let k = 2; k <= maxLag; k++) {
    let num = acfVals[k],
      den = 1;
    for (let j = 0; j < k - 1; j++) {
      num -= phi[j] * acfVals[k - j - 1];
      den -= phi[j] * acfVals[j + 1];
    }
    const phikk = Math.abs(den) < 1e-12 ? 0 : num / den;
    result.push(phikk);
    phi = Array.from({ length: k }, (_, j) =>
      j === k - 1 ? phikk : phi[j] - phikk * phi[k - 2 - j]
    );
  }
  return result;
}

const MAX_LAG = 30;
const acfData = computeACF(series, MAX_LAG); // lags 0..30 (lag 0 = 1.0)
const pacfData = computePACF(acfData, MAX_LAG); // lags 1..30
const CI = 1.96 / Math.sqrt(N); // 95% confidence bound: ±1.96/√N

// Brand green for positive correlations, matte red for negative
const stemColor = (v) => (v >= 0 ? t.palette[0] : t.palette[4]);

// DOM: flex column with overall title + two equal-height chart panes
const container = document.getElementById("container");
container.style.cssText = `
  display: flex; flex-direction: column; gap: 8px;
  background: ${t.pageBg}; padding: 30px 64px 26px;
  box-sizing: border-box;
`;

const titleEl = document.createElement("div");
titleEl.textContent = "acf-pacf · javascript · chartjs · anyplot.ai";
titleEl.style.cssText = `
  color: ${t.ink}; font: 700 22px/1.3 system-ui, -apple-system, sans-serif;
  text-align: center; flex-shrink: 0;
`;
container.appendChild(titleEl);

function makePane() {
  const wrap = document.createElement("div");
  wrap.style.cssText = "flex: 1; position: relative; min-height: 0;";
  const canvas = document.createElement("canvas");
  wrap.appendChild(canvas);
  container.appendChild(wrap);
  return canvas;
}
const acfCanvas = makePane();
const pacfCanvas = makePane();

// Horizontal dashed CI line dataset (same constant value across all lags)
function ciLine(n, val, label) {
  return {
    type: "line",
    label,
    data: new Array(n).fill(val),
    borderColor: t.inkSoft,
    borderDash: [8, 5],
    borderWidth: 1.5,
    pointRadius: 0,
    fill: false,
    tension: 0,
  };
}

// Highlight zero baseline gridline for clear significance reference
const zeroGridColor = (ctx) => (ctx.tick?.value === 0 ? t.inkSoft : t.grid);

// Shared y-axis config for both subplots
function yAxis(label) {
  return {
    ticks: { color: t.inkSoft, font: { size: 14 }, maxTicksLimit: 7 },
    grid: { color: zeroGridColor },
    border: { display: false },
    title: {
      display: true,
      text: label,
      color: t.ink,
      font: { size: 14, weight: "600" },
    },
    suggestedMin: -1.1,
    suggestedMax: 1.15,
  };
}

// Legend: show only the "95% CI" dashed line entry
const legendConfig = {
  labels: {
    color: t.inkSoft,
    font: { size: 13 },
    filter: (item) => item.text === "95% CI",
    boxWidth: 24,
  },
};

// ACF chart — lags 0..30 (lag 0 = 1.0 always included per spec)
new Chart(acfCanvas, {
  type: "bar",
  data: {
    labels: Array.from({ length: MAX_LAG + 1 }, (_, i) => i),
    datasets: [
      {
        label: "ACF",
        data: acfData,
        backgroundColor: acfData.map(stemColor),
        borderWidth: 0,
        barThickness: 7,
      },
      ciLine(MAX_LAG + 1, CI, "95% CI"),
      ciLine(MAX_LAG + 1, -CI, ""),
    ],
  },
  options: {
    responsive: true,
    maintainAspectRatio: false,
    animation: false,
    plugins: {
      title: { display: false },
      legend: { display: false },
    },
    scales: {
      x: {
        ticks: { color: t.inkSoft, font: { size: 14 }, maxTicksLimit: 16 },
        grid: { display: false },
        border: { display: false },
        title: { display: false }, // "Lag" label shown on bottom chart only
      },
      y: yAxis("ACF"),
    },
  },
});

// PACF chart — lags 1..30 (no lag 0 per spec)
new Chart(pacfCanvas, {
  type: "bar",
  data: {
    labels: Array.from({ length: MAX_LAG }, (_, i) => i + 1),
    datasets: [
      {
        label: "PACF",
        data: pacfData,
        backgroundColor: pacfData.map(stemColor),
        borderWidth: 0,
        barThickness: 7,
      },
      ciLine(MAX_LAG, CI, "95% CI"),
      ciLine(MAX_LAG, -CI, ""),
    ],
  },
  options: {
    responsive: true,
    maintainAspectRatio: false,
    animation: false,
    plugins: {
      title: { display: false },
      legend: legendConfig,
    },
    scales: {
      x: {
        ticks: { color: t.inkSoft, font: { size: 14 } },
        grid: { display: false },
        border: { display: false },
        title: {
          display: true,
          text: "Lag",
          color: t.ink,
          font: { size: 14, weight: "600" },
        },
      },
      y: yAxis("PACF"),
    },
  },
});
Runnable source as JSON, for any HTTP client: https://api.anyplot.ai/specs/acf-pacf/chartjs/code. Any spec id and library id listed in llms-full.txt fit the same URL shape; every URL below is complete and callable.
{
  "spec_id": "acf-pacf",
  "language": "javascript",
  "library": "chartjs",
  "page": "https://anyplot.ai/acf-pacf/javascript/chartjs",
  "hub": "https://anyplot.ai/acf-pacf",
  "code_json": "https://api.anyplot.ai/specs/acf-pacf/chartjs/code",
  "spec_json": "https://api.anyplot.ai/specs/acf-pacf",
  "render_light_png": "https://storage.googleapis.com/anyplot-images/plots/acf-pacf/javascript/chartjs/plot-light.png",
  "render_dark_png": "https://storage.googleapis.com/anyplot-images/plots/acf-pacf/javascript/chartjs/plot-dark.png",
  "interactive_light_html": "https://storage.googleapis.com/anyplot-images/plots/acf-pacf/javascript/chartjs/plot-light.html",
  "interactive_dark_html": "https://storage.googleapis.com/anyplot-images/plots/acf-pacf/javascript/chartjs/plot-dark.html",
  "quality_score": 84.0,
  "license": "MIT",
  "guide": "https://anyplot.ai/llms.txt"
}
Part of Autocorrelation and Partial Autocorrelation (ACF/PACF) Plot on anyplot.ai.