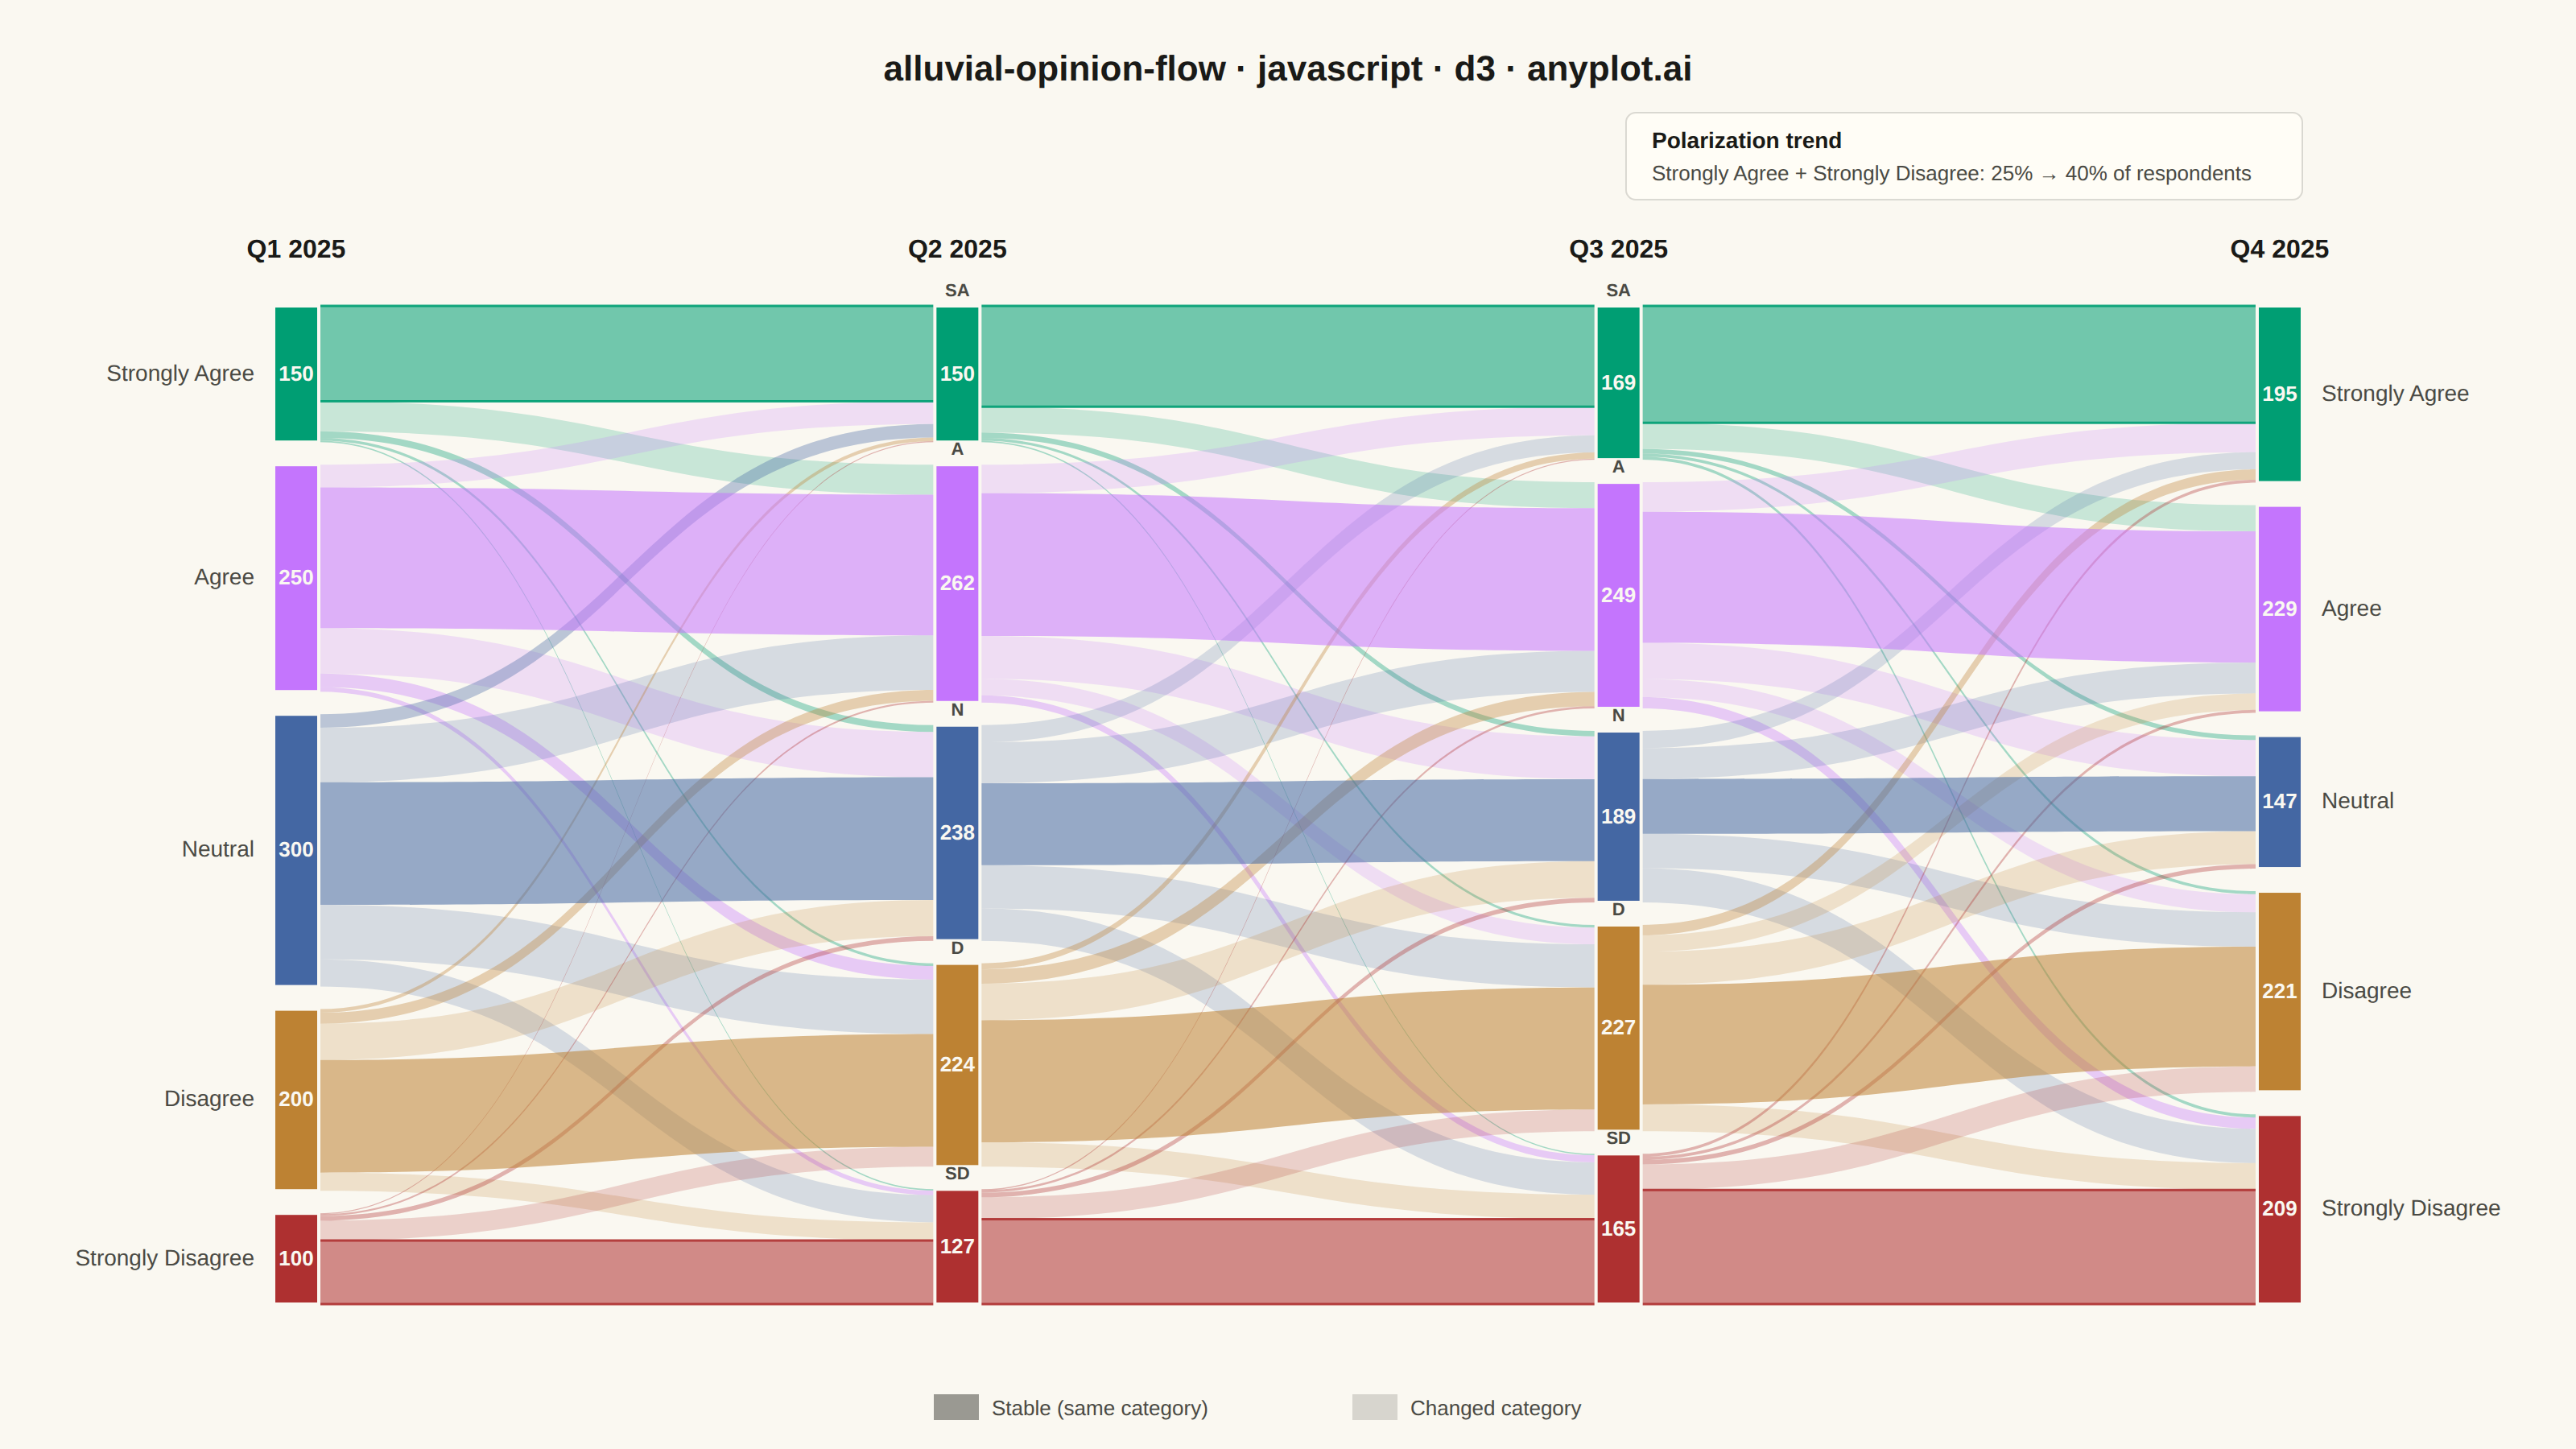
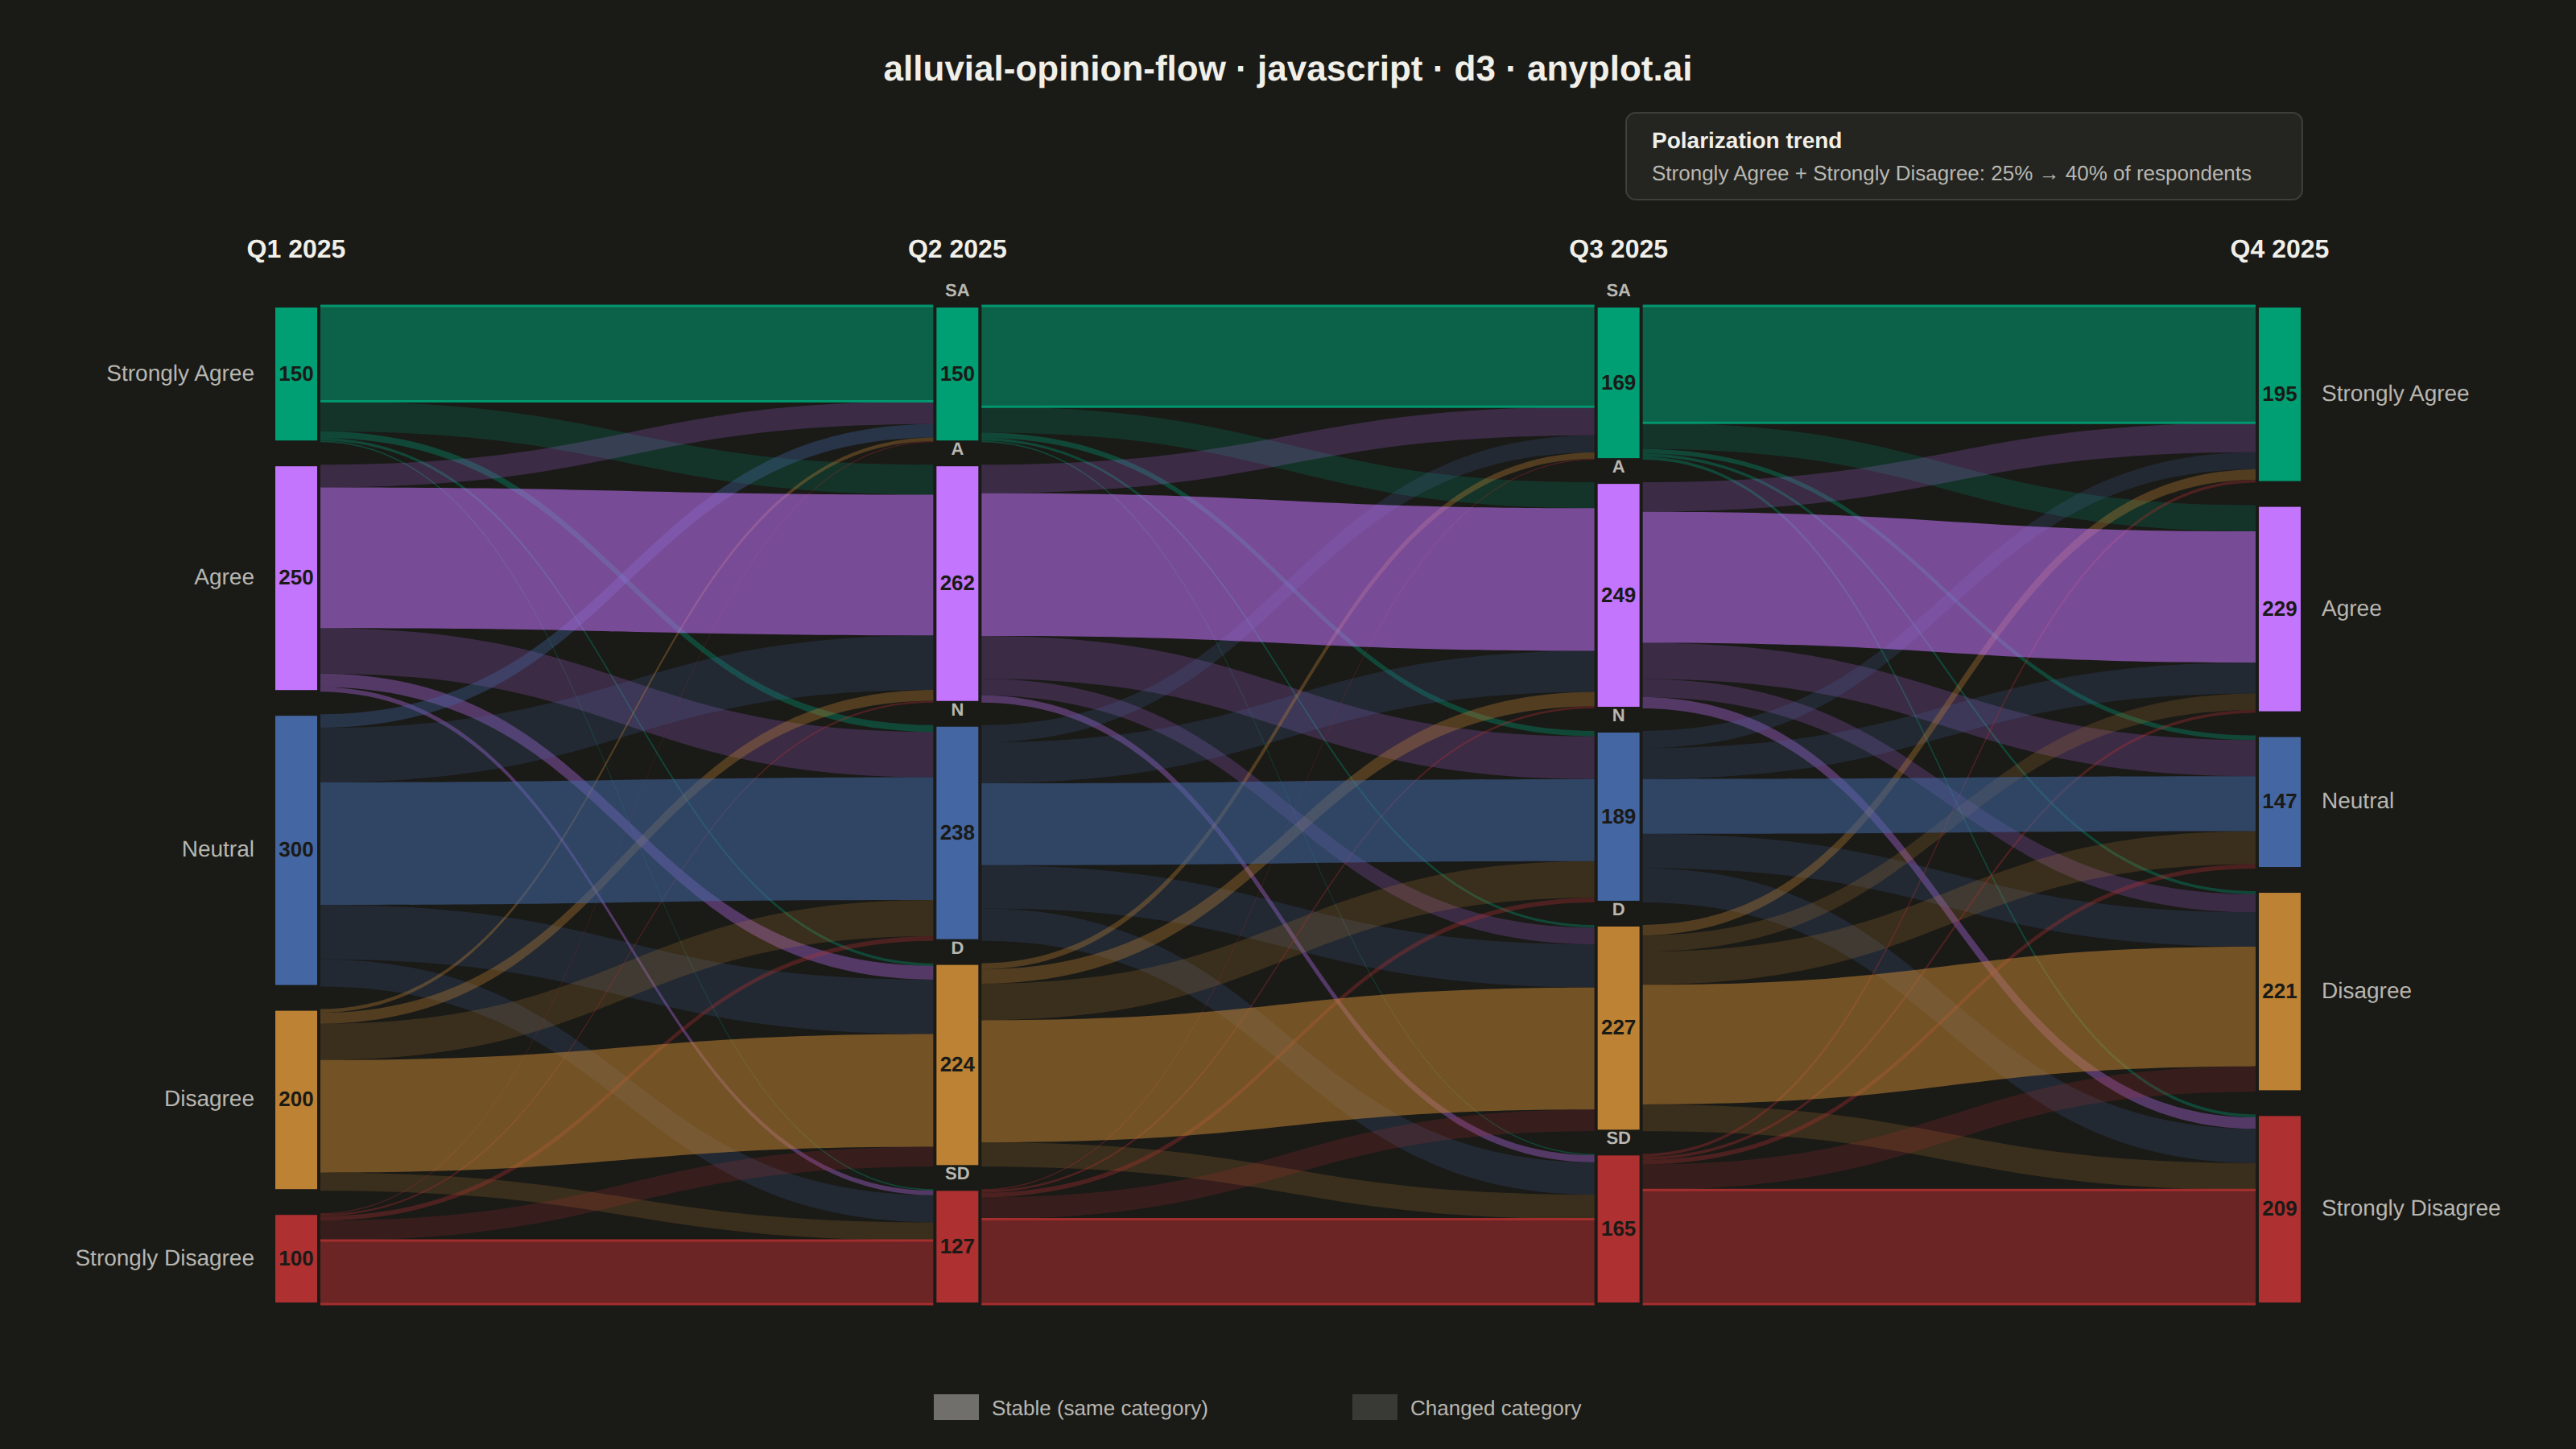
The same plot in 13 other libraries — JavaScript: Apache ECharts, Highcharts, MUI X Charts; Python: Altair, Bokeh, lets-plot, Matplotlib, Plotly, plotnine, Pygal, Seaborn; R: ggplot2; Julia: Makie.jl. Compare all 14 side by side: Opinion Flow Diagram in Python, R, Julia and JavaScript.
An alluvial/Sankey-style diagram showing how opinions or group memberships shift between survey waves or time periods. Flows connect the same response categories across columns, revealing patterns of opinion change, stability, and polarization. Unlike a basic alluvial diagram, this variant emphasizes distinguishing stable respondents from net changers and displays respondent totals per category at each wave.
// anyplot.ai
// alluvial-opinion-flow: Opinion Flow Diagram
// Library: d3 7.9.0 | JavaScript 22.23.2
// Quality: 91/100 | Created: 2026-08-26
//# anyplot-orientation: landscape
// anyplot.ai
// alluvial-opinion-flow: Opinion Flow Diagram
// Library: d3 7.9.0 | JavaScript 22
// Quality: pending | Created: 2026-08-26

const t = window.ANYPLOT_TOKENS;
const { width, height } = window.ANYPLOT_SIZE;

// --- Data (in-memory, deterministic) ----------------------------------------
// Quarterly opinion survey, 1000 respondents, 5-point agreement scale.
const categories = ["Strongly Agree", "Agree", "Neutral", "Disagree", "Strongly Disagree"];
const waveLabels = ["Q1 2025", "Q2 2025", "Q3 2025", "Q4 2025"];
const respondentCounts = [150, 250, 300, 200, 100]; // wave-1 totals, sums to 1000

// Row-stochastic transition matrices (source category share -> target category).
// Neutral is the least "sticky" category and the extremes retain a growing
// share wave over wave, modeling gradual opinion polarization.
const transitionMatrices = [
  [
    [0.7, 0.22, 0.05, 0.02, 0.01],
    [0.1, 0.62, 0.2, 0.06, 0.02],
    [0.05, 0.2, 0.45, 0.2, 0.1],
    [0.02, 0.06, 0.2, 0.62, 0.1],
    [0.01, 0.02, 0.05, 0.22, 0.7],
  ],
  [
    [0.74, 0.19, 0.04, 0.02, 0.01],
    [0.12, 0.6, 0.18, 0.07, 0.03],
    [0.08, 0.19, 0.38, 0.2, 0.15],
    [0.03, 0.07, 0.18, 0.6, 0.12],
    [0.01, 0.02, 0.04, 0.19, 0.74],
  ],
  [
    [0.76, 0.17, 0.03, 0.02, 0.02],
    [0.13, 0.58, 0.16, 0.08, 0.05],
    [0.1, 0.18, 0.32, 0.2, 0.2],
    [0.05, 0.08, 0.16, 0.58, 0.13],
    [0.02, 0.02, 0.03, 0.17, 0.76],
  ],
];

// Derive per-wave category totals and the flow list from the transition chain.
const waveCategoryTotals = [respondentCounts];
const flowLinks = []; // { wave, sourceCat, targetCat, count }
for (let w = 0; w < transitionMatrices.length; w++) {
  const prevTotals = waveCategoryTotals[w];
  const nextTotals = new Array(categories.length).fill(0);
  for (let s = 0; s < categories.length; s++) {
    for (let tgt = 0; tgt < categories.length; tgt++) {
      const count = prevTotals[s] * transitionMatrices[w][s][tgt];
      if (count > 0.5) flowLinks.push({ wave: w, sourceCat: s, targetCat: tgt, count });
      nextTotals[tgt] += count;
    }
  }
  waveCategoryTotals.push(nextTotals);
}

const extremeShareStart = (waveCategoryTotals[0][0] + waveCategoryTotals[0][4]) / 1000;
const extremeShareEnd =
  (waveCategoryTotals[waveCategoryTotals.length - 1][0] +
    waveCategoryTotals[waveCategoryTotals.length - 1][4]) /
  1000;

// --- Layout -------------------------------------------------------------------
const margin = { top: 190, right: 170, bottom: 90, left: 170 };
const iw = width - margin.left - margin.right;
const ih = height - margin.top - margin.bottom;
const nodeWidth = 28;
const catPad = 14;
const columnGap = (iw - nodeWidth) / (waveLabels.length - 1);
const yScale = (ih - catPad * (categories.length - 1)) / 1000;

const color = d3.scaleOrdinal().domain(d3.range(categories.length)).range(t.palette);
const categoryAbbrev = categories.map((name) => name.split(" ").map((w) => w[0]).join(""));
const isExtreme = (c) => c === 0 || c === categories.length - 1;

// Nodes: one block per (wave, category), stacked top-to-bottom in scale order.
const nodes = waveCategoryTotals.map((totals, w) => {
  const x0 = margin.left + w * columnGap;
  let y = margin.top;
  return totals.map((value, c) => {
    const nodeHeight = value * yScale;
    const node = { wave: w, cat: c, value, x0, x1: x0 + nodeWidth, y0: y, y1: y + nodeHeight };
    node.outOffset = node.y0;
    node.inOffset = node.y0;
    y += nodeHeight + catPad;
    return node;
  });
});

// Stack flow ribbons within each node's span in the order they connect.
const ribbons = flowLinks.map((f) => {
  const sourceNode = nodes[f.wave][f.sourceCat];
  const targetNode = nodes[f.wave + 1][f.targetCat];
  const thickness = f.count * yScale;
  const sy0 = sourceNode.outOffset;
  const sy1 = sy0 + thickness;
  const ty0 = targetNode.inOffset;
  const ty1 = ty0 + thickness;
  sourceNode.outOffset = sy1;
  targetNode.inOffset = ty1;
  return { ...f, x0: sourceNode.x1, x1: targetNode.x0, sy0, sy1, ty0, ty1 };
});

const ribbonPath = (d) => {
  const xm = (d.x0 + d.x1) / 2;
  return `M${d.x0},${d.sy0}C${xm},${d.sy0} ${xm},${d.ty0} ${d.x1},${d.ty0}L${d.x1},${d.ty1}C${xm},${d.ty1} ${xm},${d.sy1} ${d.x0},${d.sy1}Z`;
};

// --- SVG mount ----------------------------------------------------------------
const svg = d3.select("#container").append("svg").attr("width", width).attr("height", height);

// --- Title ----------------------------------------------------------------
svg
  .append("text")
  .attr("x", width / 2)
  .attr("y", 50)
  .attr("text-anchor", "middle")
  .attr("fill", t.ink)
  .style("font-size", "22px")
  .style("font-weight", "600")
  .text("alluvial-opinion-flow · javascript · d3 · anyplot.ai");

// --- Polarization callout (net-flow annotation) --------------------------------
const calloutW = 420;
const calloutX = width - margin.right - calloutW;
svg
  .append("rect")
  .attr("x", calloutX)
  .attr("y", 70)
  .attr("width", calloutW)
  .attr("height", 54)
  .attr("rx", 6)
  .attr("fill", t.elevatedBg)
  .attr("stroke", t.grid);
svg
  .append("text")
  .attr("x", calloutX + 16)
  .attr("y", 92)
  .attr("fill", t.ink)
  .style("font-size", "14px")
  .style("font-weight", "600")
  .text("Polarization trend");
svg
  .append("text")
  .attr("x", calloutX + 16)
  .attr("y", 112)
  .attr("fill", t.inkSoft)
  .style("font-size", "13px")
  .text(
    `Strongly Agree + Strongly Disagree: ${Math.round(extremeShareStart * 100)}% → ${Math.round(extremeShareEnd * 100)}% of respondents`
  );

// --- Wave column headers -----------------------------------------------------
svg
  .selectAll(".wave-header")
  .data(nodes.map((col, w) => ({ x: col[0].x0 + nodeWidth / 2, label: waveLabels[w] })))
  .join("text")
  .attr("class", "wave-header")
  .attr("x", (d) => d.x)
  .attr("y", margin.top - 30)
  .attr("text-anchor", "middle")
  .attr("fill", t.ink)
  .style("font-size", "16px")
  .style("font-weight", "600")
  .text((d) => d.label);

// --- Ribbons (flows) ----------------------------------------------------------
// Draw "changed category" ribbons first so the higher-opacity "stable" ribbons
// layer on top, cutting down the crossing clutter around the Neutral band.
const sortedRibbons = ribbons
  .slice()
  .sort((a, b) => (a.sourceCat === a.targetCat ? 1 : 0) - (b.sourceCat === b.targetCat ? 1 : 0));

svg
  .selectAll(".ribbon")
  .data(sortedRibbons)
  .join("path")
  .attr("class", "ribbon")
  .attr("d", ribbonPath)
  .attr("fill", (d) => color(d.sourceCat))
  .attr("fill-opacity", (d) => {
    const stable = d.sourceCat === d.targetCat;
    const base = stable ? 0.55 : 0.2;
    const thin = d.sy1 - d.sy0 < 10;
    return thin ? base + 0.15 : base;
  })
  .attr("stroke", (d) => (d.sourceCat === d.targetCat && isExtreme(d.sourceCat) ? color(d.sourceCat) : "none"))
  .attr("stroke-width", (d) => (d.sourceCat === d.targetCat && isExtreme(d.sourceCat) ? 1.5 : 0))
  .attr("stroke-opacity", 0.9);

// --- Nodes ----------------------------------------------------------------
const nodeFlat = nodes.flat();
svg
  .selectAll(".node")
  .data(nodeFlat)
  .join("rect")
  .attr("class", "node")
  .attr("x", (d) => d.x0)
  .attr("width", nodeWidth)
  .attr("y", (d) => d.y0)
  .attr("height", (d) => d.y1 - d.y0)
  .attr("fill", (d) => color(d.cat))
  .attr("stroke", t.pageBg)
  .attr("stroke-width", 2);

// --- Node value labels (respondent counts) -------------------------------
svg
  .selectAll(".node-label")
  .data(nodeFlat.filter((d) => d.y1 - d.y0 >= 22))
  .join("text")
  .attr("class", "node-label")
  .attr("x", (d) => d.x0 + nodeWidth / 2)
  .attr("y", (d) => (d.y0 + d.y1) / 2 + 4)
  .attr("text-anchor", "middle")
  .attr("fill", t.pageBg)
  .style("font-size", "13px")
  .style("font-weight", "600")
  .text((d) => Math.round(d.value));

// --- Category name labels (first and last wave only) -----------------------
const firstWave = nodes[0];
const lastWave = nodes[nodes.length - 1];
svg
  .selectAll(".label-first")
  .data(firstWave)
  .join("text")
  .attr("class", "label-first")
  .attr("x", (d) => d.x0 - 12)
  .attr("y", (d) => (d.y0 + d.y1) / 2 + 4)
  .attr("text-anchor", "end")
  .attr("fill", t.inkSoft)
  .style("font-size", "14px")
  .text((d) => categories[d.cat]);
svg
  .selectAll(".label-last")
  .data(lastWave)
  .join("text")
  .attr("class", "label-last")
  .attr("x", (d) => d.x1 + 12)
  .attr("y", (d) => (d.y0 + d.y1) / 2 + 4)
  .attr("text-anchor", "start")
  .attr("fill", t.inkSoft)
  .style("font-size", "14px")
  .text((d) => categories[d.cat]);

// --- Category abbreviation tags (interior waves) -----------------------------
// Q1/Q4 get full names beside the column; interior waves get a compact tag
// above each node so color + vertical position aren't the only identity signal.
const interiorNodes = nodes.slice(1, -1).flat();
svg
  .selectAll(".label-interior")
  .data(interiorNodes)
  .join("text")
  .attr("class", "label-interior")
  .attr("x", (d) => d.x0 + nodeWidth / 2)
  .attr("y", (d) => d.y0 - 6)
  .attr("text-anchor", "middle")
  .attr("fill", t.inkSoft)
  .style("font-size", "11px")
  .style("font-weight", "600")
  .text((d) => categoryAbbrev[d.cat]);

// --- Stability legend (opacity encoding) --------------------------------------
const legendY = height - 34;
const legendItems = [
  { label: "Stable (same category)", opacity: 0.55 },
  { label: "Changed category", opacity: 0.2 },
];
const legend = svg
  .selectAll(".legend-item")
  .data(legendItems)
  .join("g")
  .attr("class", "legend-item")
  .attr("transform", (_, i) => `translate(${width / 2 - 220 + i * 260},${legendY})`);
legend
  .append("rect")
  .attr("width", 28)
  .attr("height", 16)
  .attr("fill", t.inkSoft)
  .attr("fill-opacity", (d) => d.opacity);
legend
  .append("text")
  .attr("x", 36)
  .attr("y", 13)
  .attr("fill", t.inkSoft)
  .style("font-size", "13px")
  .text((d) => d.label);
Runnable source as JSON, for any HTTP client: https://api.anyplot.ai/specs/alluvial-opinion-flow/d3/code. Any spec id and library id listed in llms-full.txt fit the same URL shape; every URL below is complete and callable.
{
  "spec_id": "alluvial-opinion-flow",
  "language": "javascript",
  "library": "d3",
  "page": "https://anyplot.ai/alluvial-opinion-flow/javascript/d3",
  "hub": "https://anyplot.ai/alluvial-opinion-flow",
  "code_json": "https://api.anyplot.ai/specs/alluvial-opinion-flow/d3/code",
  "spec_json": "https://api.anyplot.ai/specs/alluvial-opinion-flow",
  "render_light_png": "https://storage.googleapis.com/anyplot-images/plots/alluvial-opinion-flow/javascript/d3/plot-light.png",
  "render_dark_png": "https://storage.googleapis.com/anyplot-images/plots/alluvial-opinion-flow/javascript/d3/plot-dark.png",
  "interactive_light_html": "https://storage.googleapis.com/anyplot-images/plots/alluvial-opinion-flow/javascript/d3/plot-light.html",
  "interactive_dark_html": "https://storage.googleapis.com/anyplot-images/plots/alluvial-opinion-flow/javascript/d3/plot-dark.html",
  "quality_score": 91.0,
  "license": "MIT",
  "guide": "https://anyplot.ai/llms.txt"
}
Part of Opinion Flow Diagram on anyplot.ai.