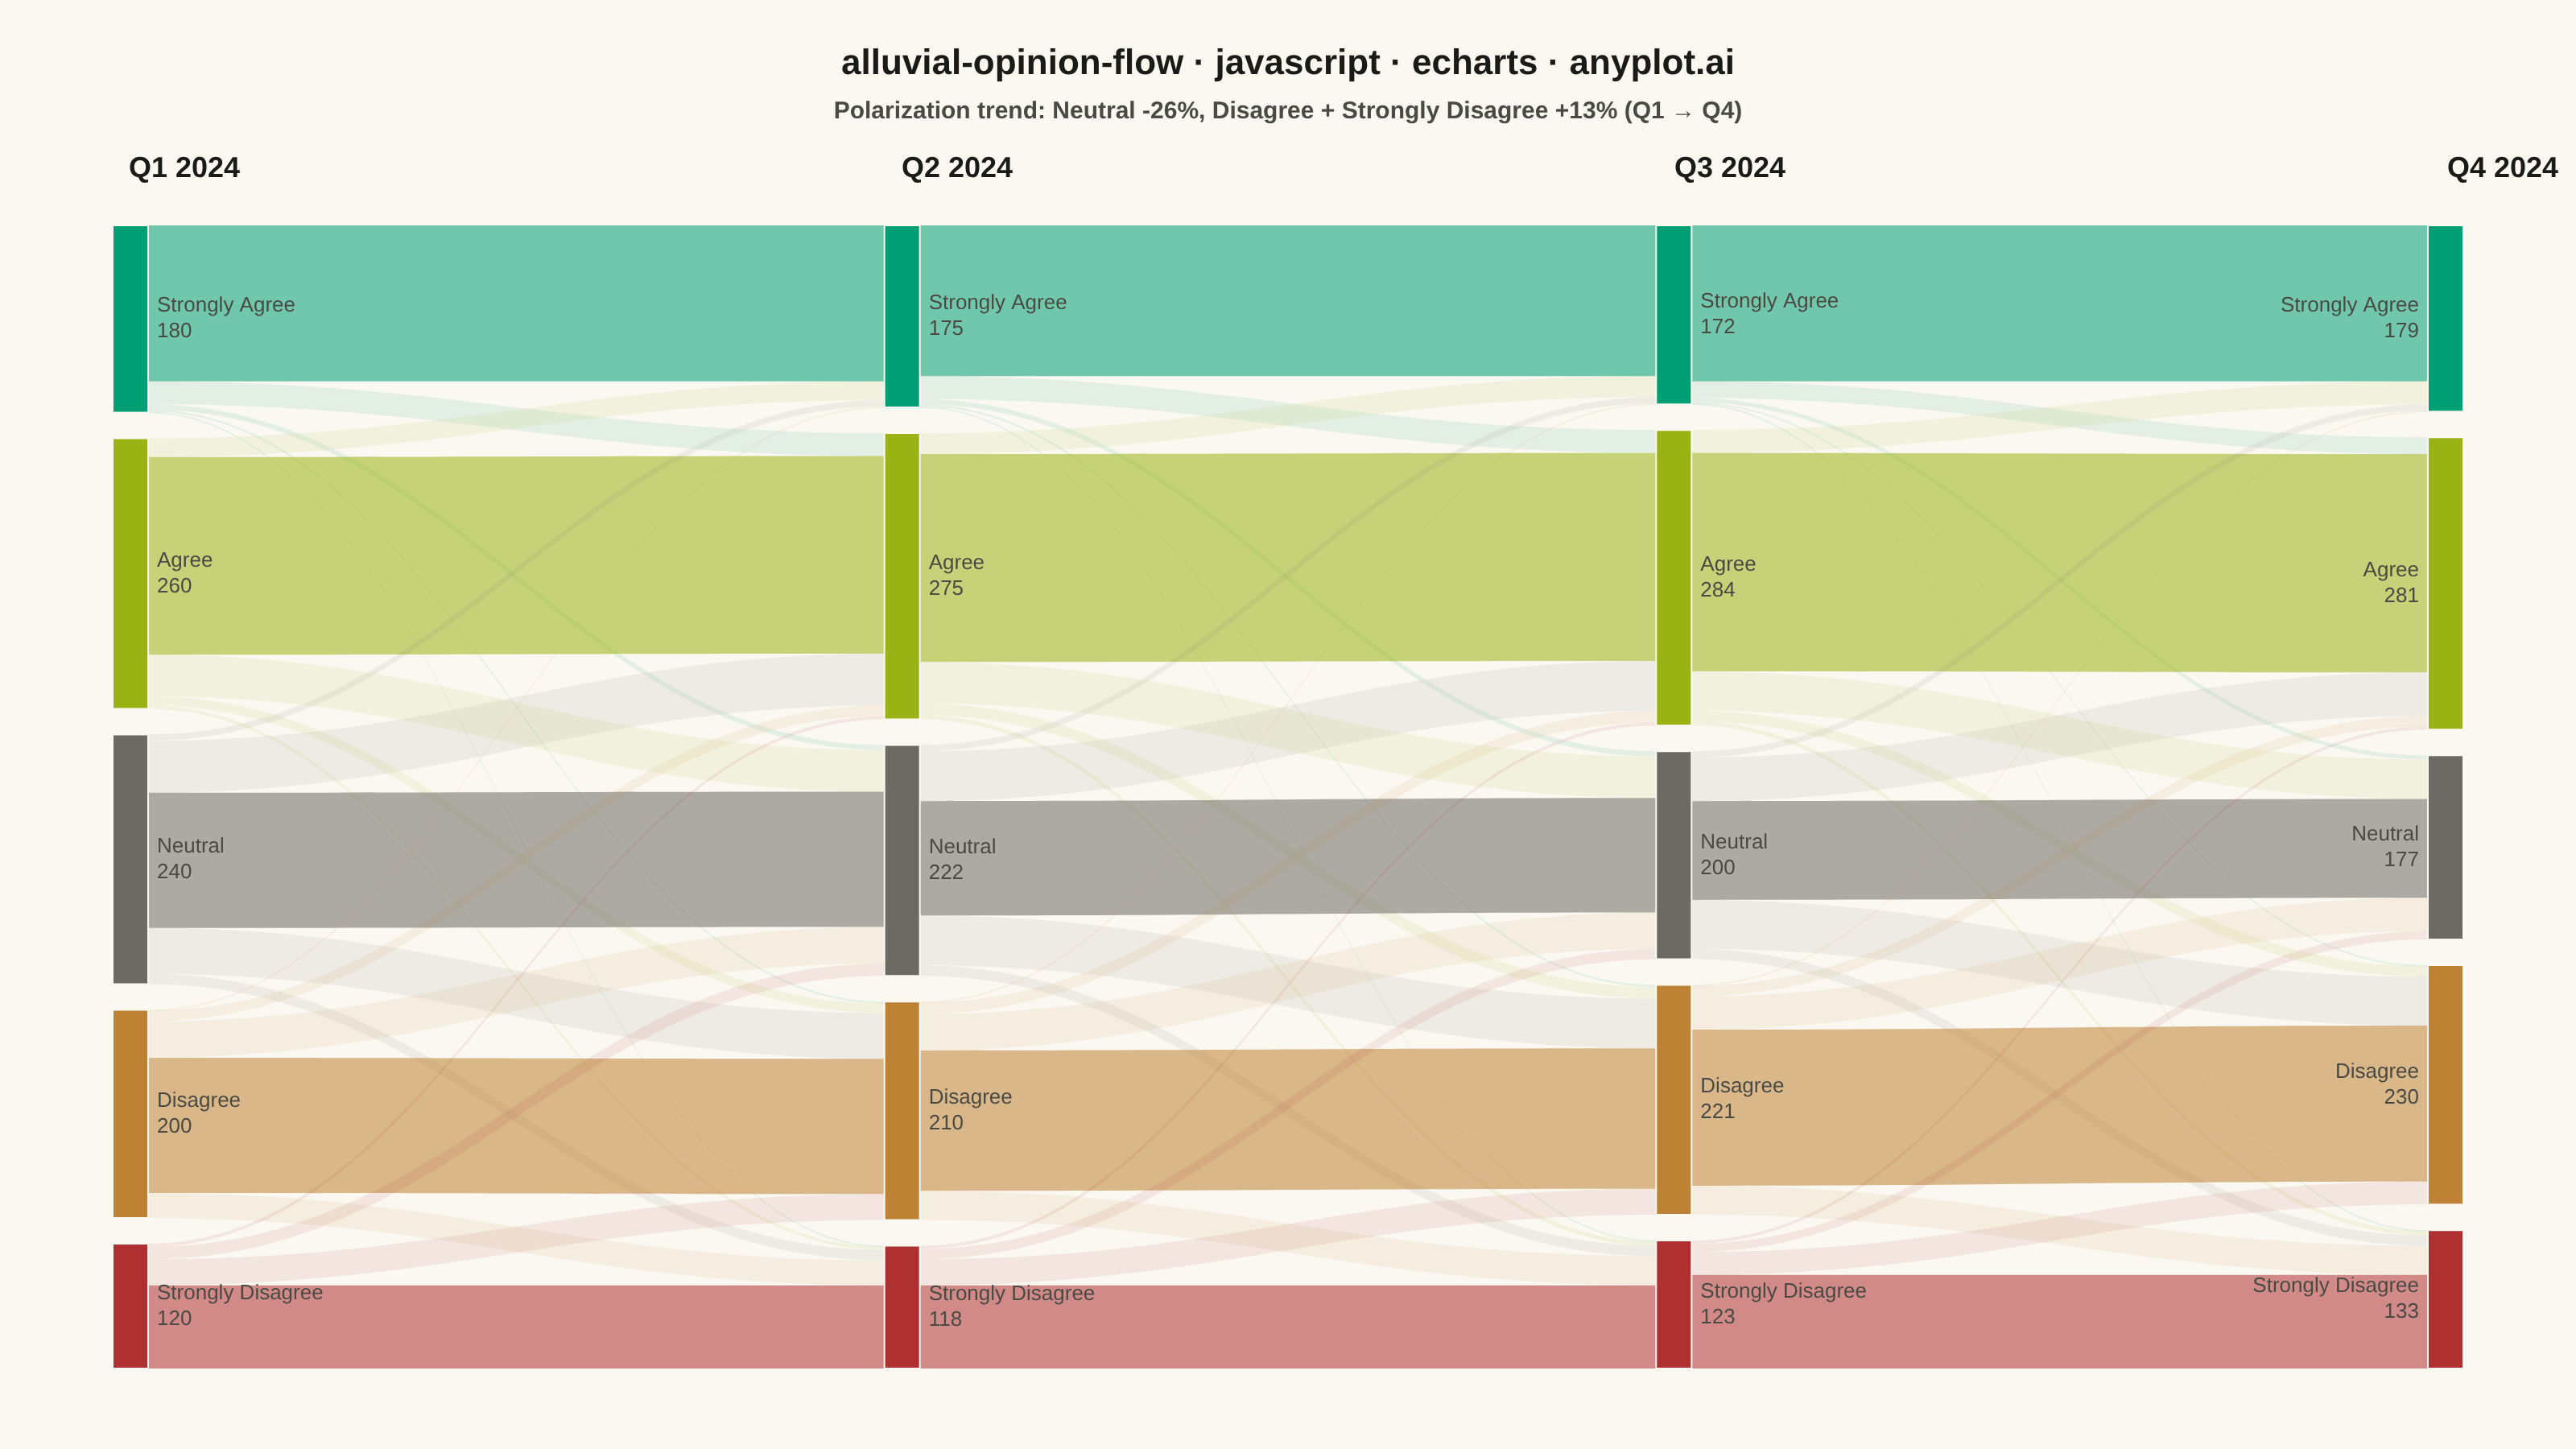
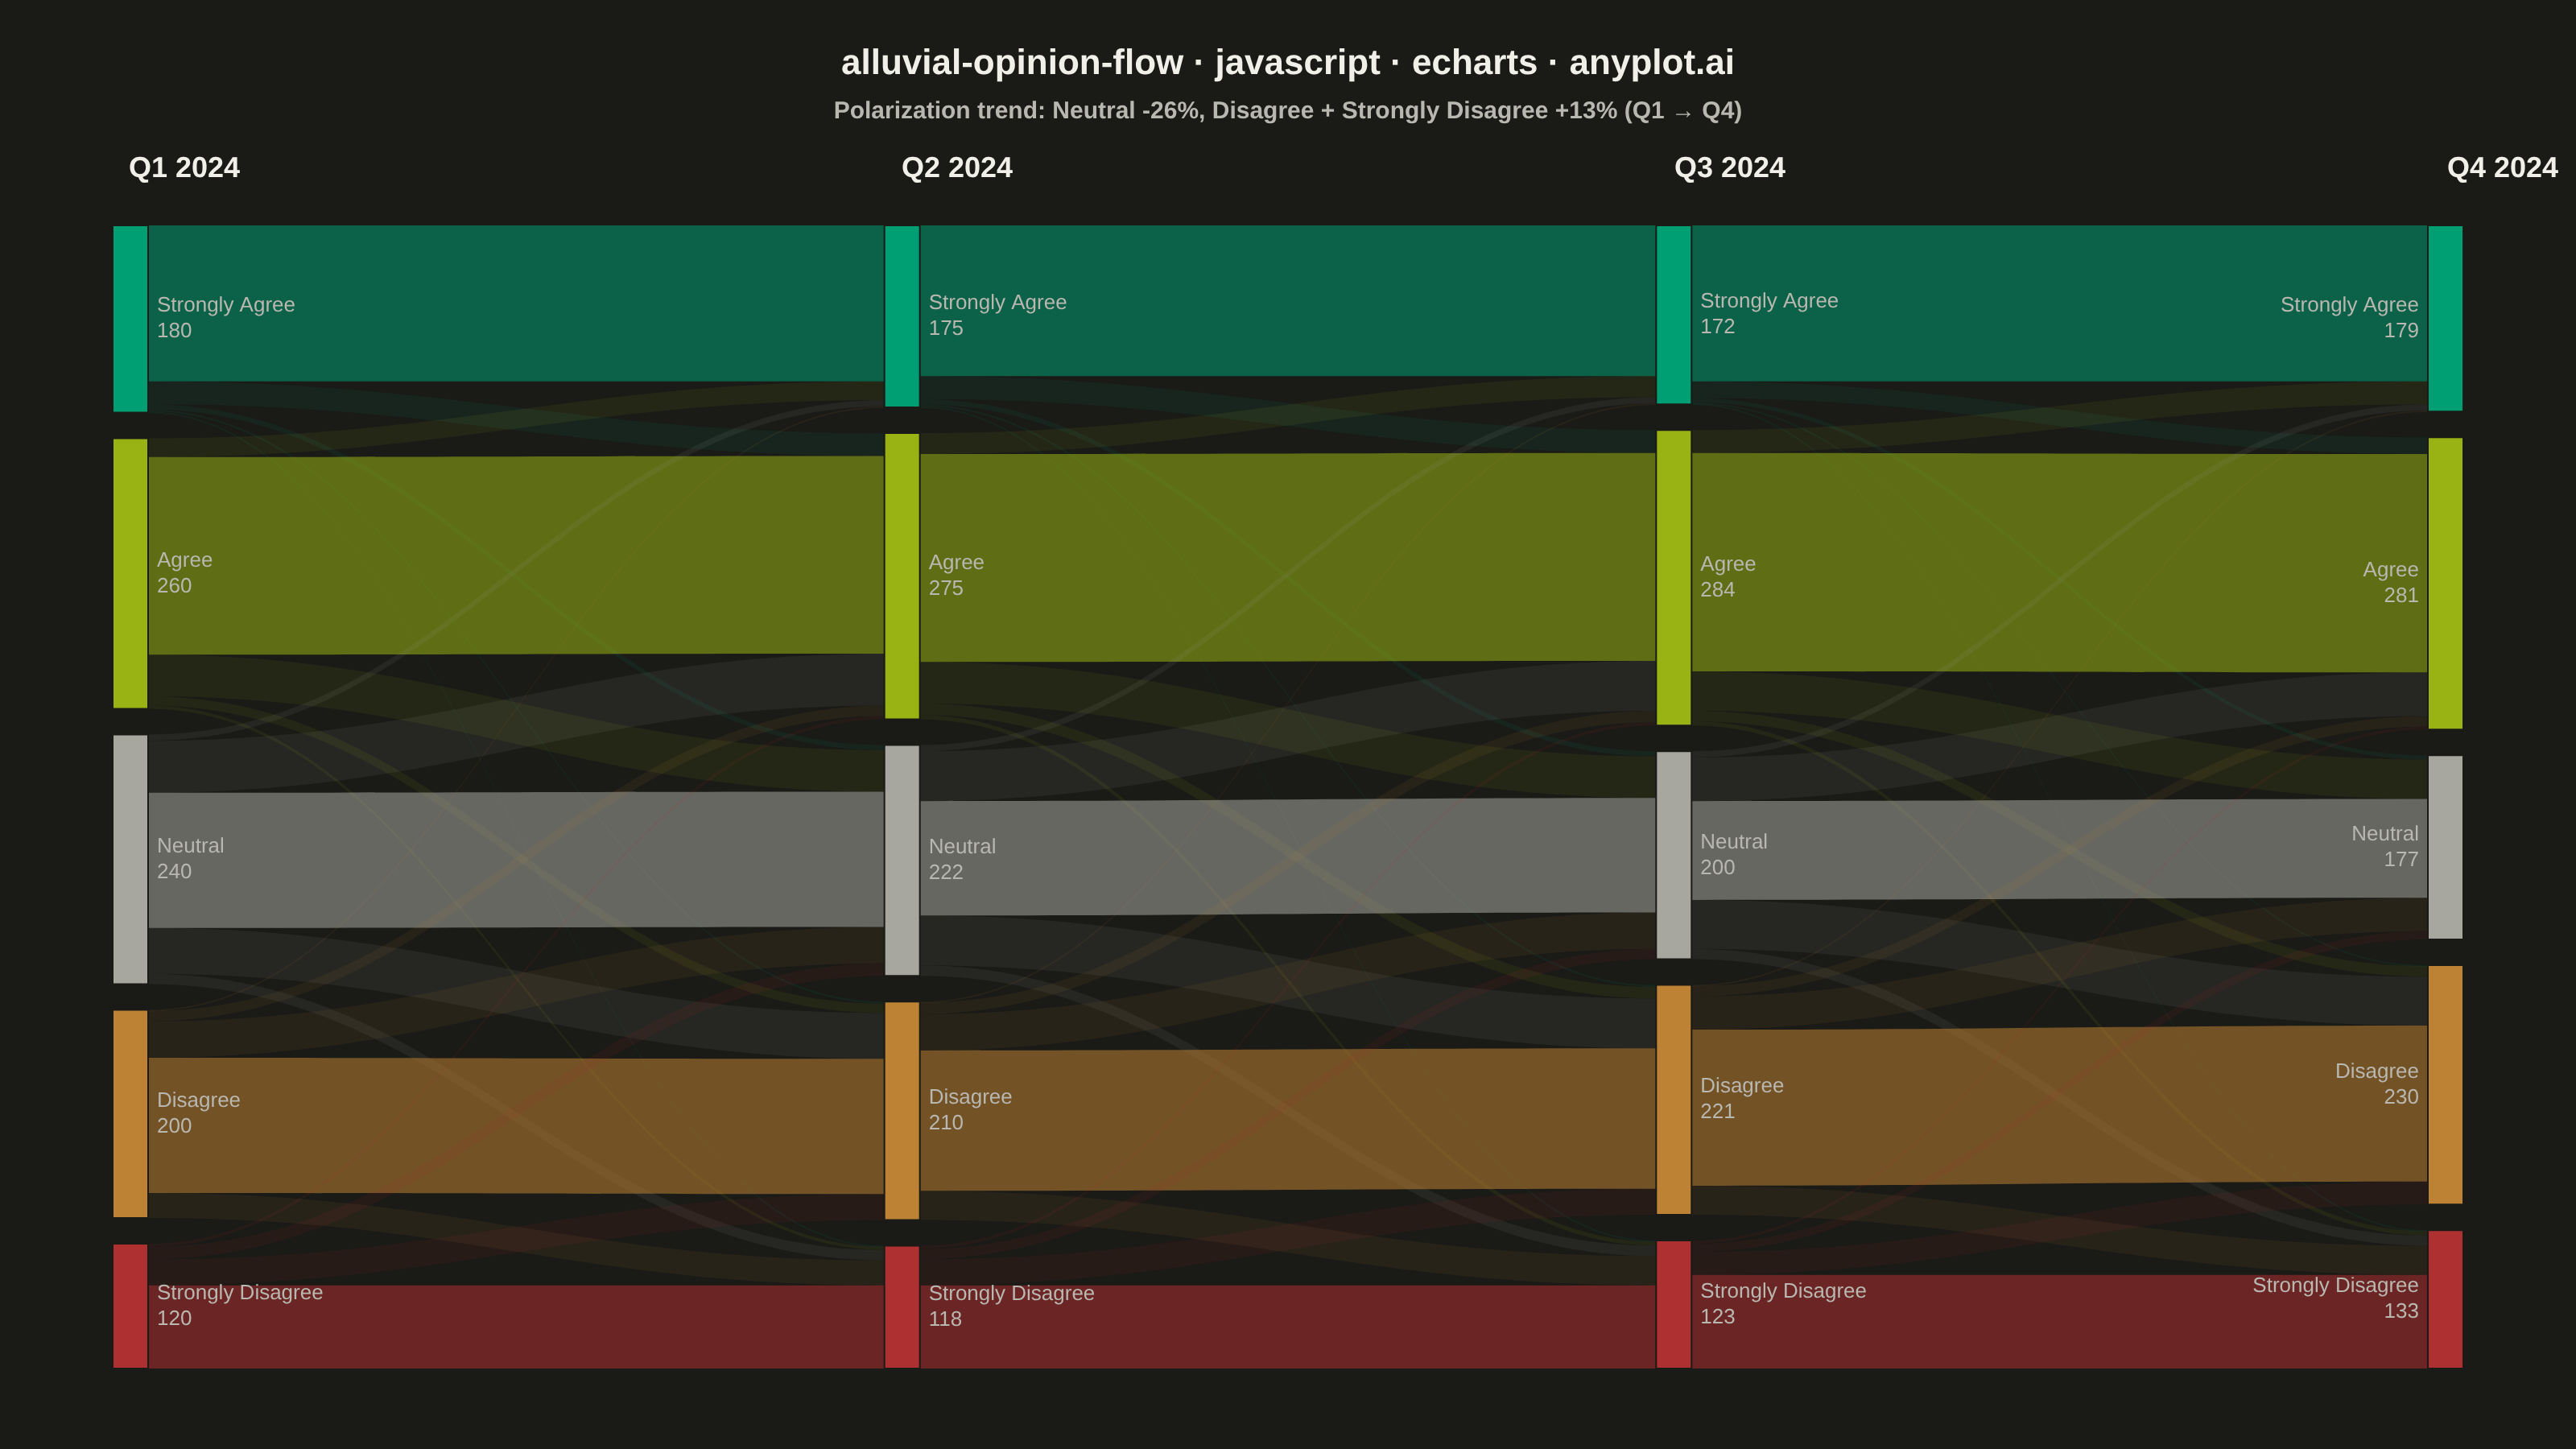
The same plot in 13 other libraries — JavaScript: D3.js, Highcharts, MUI X Charts; Python: Altair, Bokeh, lets-plot, Matplotlib, Plotly, plotnine, Pygal, Seaborn; R: ggplot2; Julia: Makie.jl. Compare all 14 side by side: Opinion Flow Diagram in Python, R, Julia and JavaScript.
An alluvial/Sankey-style diagram showing how opinions or group memberships shift between survey waves or time periods. Flows connect the same response categories across columns, revealing patterns of opinion change, stability, and polarization. Unlike a basic alluvial diagram, this variant emphasizes distinguishing stable respondents from net changers and displays respondent totals per category at each wave.
// anyplot.ai
// alluvial-opinion-flow: Opinion Flow Diagram
// Library: echarts 6.1.0 | JavaScript 22.23.2
// Quality: 92/100 | Created: 2026-08-26

const t = window.ANYPLOT_TOKENS;
const MUTED = t.theme === "light" ? "#6B6A63" : "#A8A79F";

// --- Data: quarterly policy-approval survey, 1000 respondents ---------------
// Sentiment scale colored via the Imprint semantic exception: agree side
// green-family, disagree side red-family, neutral side the muted anchor.
const CATEGORIES = [
  { key: "Strongly Agree", color: t.palette[0] },
  { key: "Agree", color: t.palette[7] },
  { key: "Neutral", color: MUTED },
  { key: "Disagree", color: t.palette[3] },
  { key: "Strongly Disagree", color: t.palette[4] },
];
const WAVES = ["Q1 2024", "Q2 2024", "Q3 2024", "Q4 2024"];

// Respondent counts transitioning between categories, one 5x5 matrix per
// wave-to-wave gap. Rows/cols follow CATEGORIES order. Each row sums to the
// source category's total for that wave.
const TRANSITIONS = [
  [
    [150, 22, 5, 2, 1],
    [18, 190, 40, 9, 3],
    [6, 50, 130, 44, 10],
    [1, 10, 35, 130, 24],
    [0, 3, 12, 25, 80],
  ],
  [
    [145, 22, 5, 2, 1],
    [20, 200, 40, 11, 4],
    [6, 48, 110, 48, 10],
    [1, 11, 35, 135, 28],
    [0, 3, 10, 25, 80],
  ],
  [
    [150, 16, 4, 1, 1],
    [22, 210, 38, 10, 4],
    [6, 42, 95, 47, 10],
    [1, 10, 32, 150, 28],
    [0, 3, 8, 22, 90],
  ],
];

// --- Build nodes + links ------------------------------------------------
// Node "name" is the sankey's unique key (referenced by links), so it embeds
// the wave to stay unique; the visible label is rendered via a formatter
// that shows only the category and its respondent total.
const nodeName = (wave, categoryIndex) => wave + "|" + categoryIndex;

const totals = [[180, 260, 240, 200, 120]];
TRANSITIONS.forEach((matrix) => {
  const next = CATEGORIES.map((_, col) =>
    matrix.reduce((sum, row) => sum + row[col], 0),
  );
  totals.push(next);
});

// Net polarization callout: how the neutral middle and the disagree side
// moved from the first wave to the last — computed from the same totals
// driving the diagram, not a separate hard-coded claim.
const firstTotals = totals[0];
const lastTotals = totals[totals.length - 1];
const pctChange = (from, to) => Math.round(((to - from) / from) * 100);
const neutralPct = pctChange(firstTotals[2], lastTotals[2]);
const disagreeSidePct = pctChange(
  firstTotals[3] + firstTotals[4],
  lastTotals[3] + lastTotals[4],
);
const polarizationCallout =
  `Polarization trend: Neutral ${neutralPct}%, ` +
  `Disagree + Strongly Disagree ${disagreeSidePct >= 0 ? "+" : ""}${disagreeSidePct}% (Q1 → Q4)`;

const nodes = [];
WAVES.forEach((wave, w) => {
  CATEGORIES.forEach((cat, c) => {
    nodes.push({
      name: nodeName(wave, c),
      category: cat.key,
      total: totals[w][c],
      itemStyle: { color: cat.color, borderColor: t.pageBg, borderWidth: 1 },
      label: {
        position: w === WAVES.length - 1 ? "left" : "right",
        formatter: (params) =>
          params.data.category + "\n" + params.data.total.toLocaleString(),
      },
    });
  });
});

const links = [];
TRANSITIONS.forEach((matrix, gap) => {
  const sourceWave = WAVES[gap];
  const targetWave = WAVES[gap + 1];
  matrix.forEach((row, srcIdx) => {
    row.forEach((count, tgtIdx) => {
      if (count === 0) return;
      const stable = srcIdx === tgtIdx;
      links.push({
        source: nodeName(sourceWave, srcIdx),
        target: nodeName(targetWave, tgtIdx),
        value: count,
        lineStyle: {
          color: CATEGORIES[srcIdx].color,
          opacity: stable ? 0.55 : 0.09,
          curveness: 0.42,
        },
      });
    });
  });
});

// --- Init ---------------------------------------------------------------
const chart = echarts.init(document.getElementById("container"));

// --- Column headers (waves), placed above the sankey columns -------------
const headerXPct = [5, 35, 65, 95];
const headerAlign = ["left", "center", "center", "right"];
const graphicHeaders = WAVES.map((wave, i) => ({
  type: "text",
  left: `${headerXPct[i]}%`,
  top: 96,
  style: {
    text: wave,
    fill: t.ink,
    fontSize: 18,
    fontWeight: 600,
    align: headerAlign[i],
  },
}));

// Explicit callout (spec asks to "highlight net flows … to reveal
// polarization trends") so the shrinking-middle / growing-disagreement
// story reads without comparing node totals by eye.
const polarizationAnnotation = {
  type: "text",
  left: "center",
  top: 62,
  style: {
    text: polarizationCallout,
    fill: t.inkSoft,
    fontSize: 15,
    fontWeight: 600,
    align: "center",
  },
};

// --- Option ---------------------------------------------------------------
chart.setOption({
  animation: false,
  backgroundColor: "transparent",
  title: {
    text: "alluvial-opinion-flow · javascript · echarts · anyplot.ai",
    left: "center",
    top: 24,
    textStyle: { color: t.ink, fontSize: 22 },
  },
  graphic: { elements: [polarizationAnnotation, ...graphicHeaders] },
  series: [
    {
      type: "sankey",
      nodes,
      links,
      top: 140,
      bottom: 50,
      left: 70,
      right: 70,
      nodeWidth: 22,
      nodeGap: 16,
      nodeAlign: "justify",
      layoutIterations: 0,
      emphasis: { focus: "adjacency" },
      label: {
        color: t.inkSoft,
        fontSize: 13,
        lineHeight: 16,
      },
      lineStyle: { curveness: 0.42 },
    },
  ],
});
Runnable source as JSON, for any HTTP client: https://api.anyplot.ai/specs/alluvial-opinion-flow/echarts/code. Any spec id and library id listed in llms-full.txt fit the same URL shape; every URL below is complete and callable.
{
  "spec_id": "alluvial-opinion-flow",
  "language": "javascript",
  "library": "echarts",
  "page": "https://anyplot.ai/alluvial-opinion-flow/javascript/echarts",
  "hub": "https://anyplot.ai/alluvial-opinion-flow",
  "code_json": "https://api.anyplot.ai/specs/alluvial-opinion-flow/echarts/code",
  "spec_json": "https://api.anyplot.ai/specs/alluvial-opinion-flow",
  "render_light_png": "https://storage.googleapis.com/anyplot-images/plots/alluvial-opinion-flow/javascript/echarts/plot-light.png",
  "render_dark_png": "https://storage.googleapis.com/anyplot-images/plots/alluvial-opinion-flow/javascript/echarts/plot-dark.png",
  "interactive_light_html": "https://storage.googleapis.com/anyplot-images/plots/alluvial-opinion-flow/javascript/echarts/plot-light.html",
  "interactive_dark_html": "https://storage.googleapis.com/anyplot-images/plots/alluvial-opinion-flow/javascript/echarts/plot-dark.html",
  "quality_score": 92.0,
  "license": "MIT",
  "guide": "https://anyplot.ai/llms.txt"
}
Part of Opinion Flow Diagram on anyplot.ai.