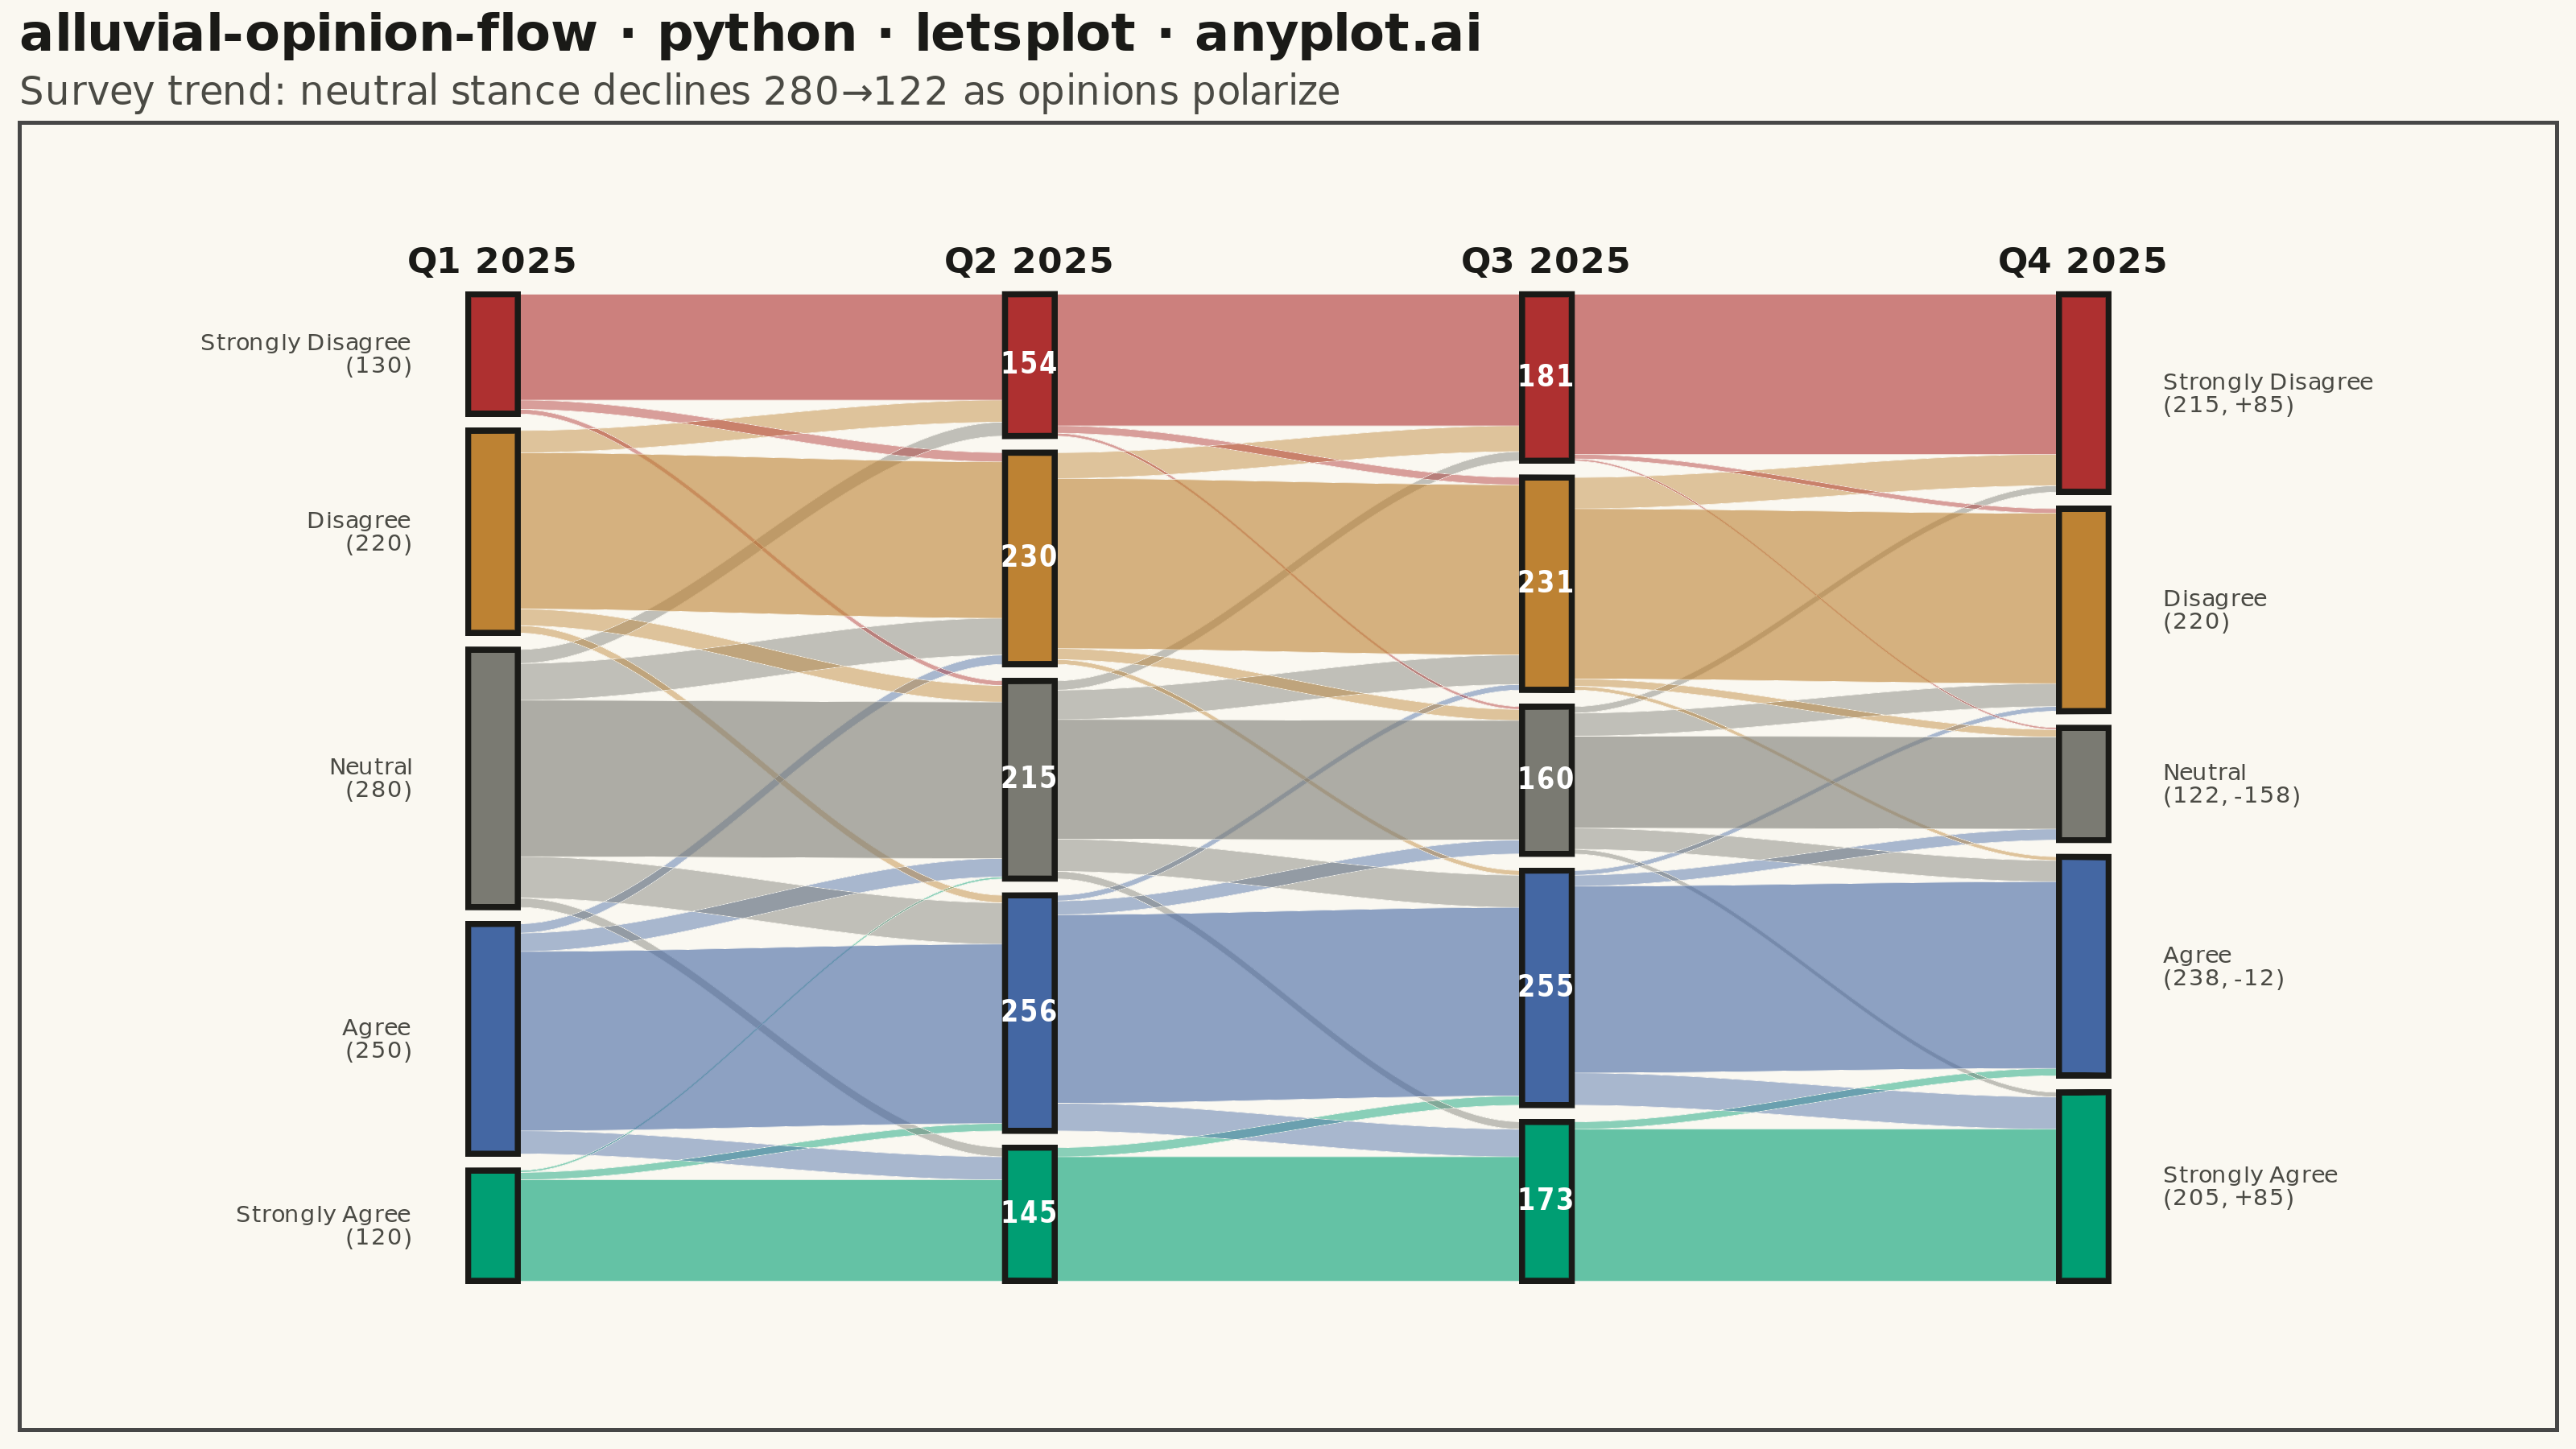
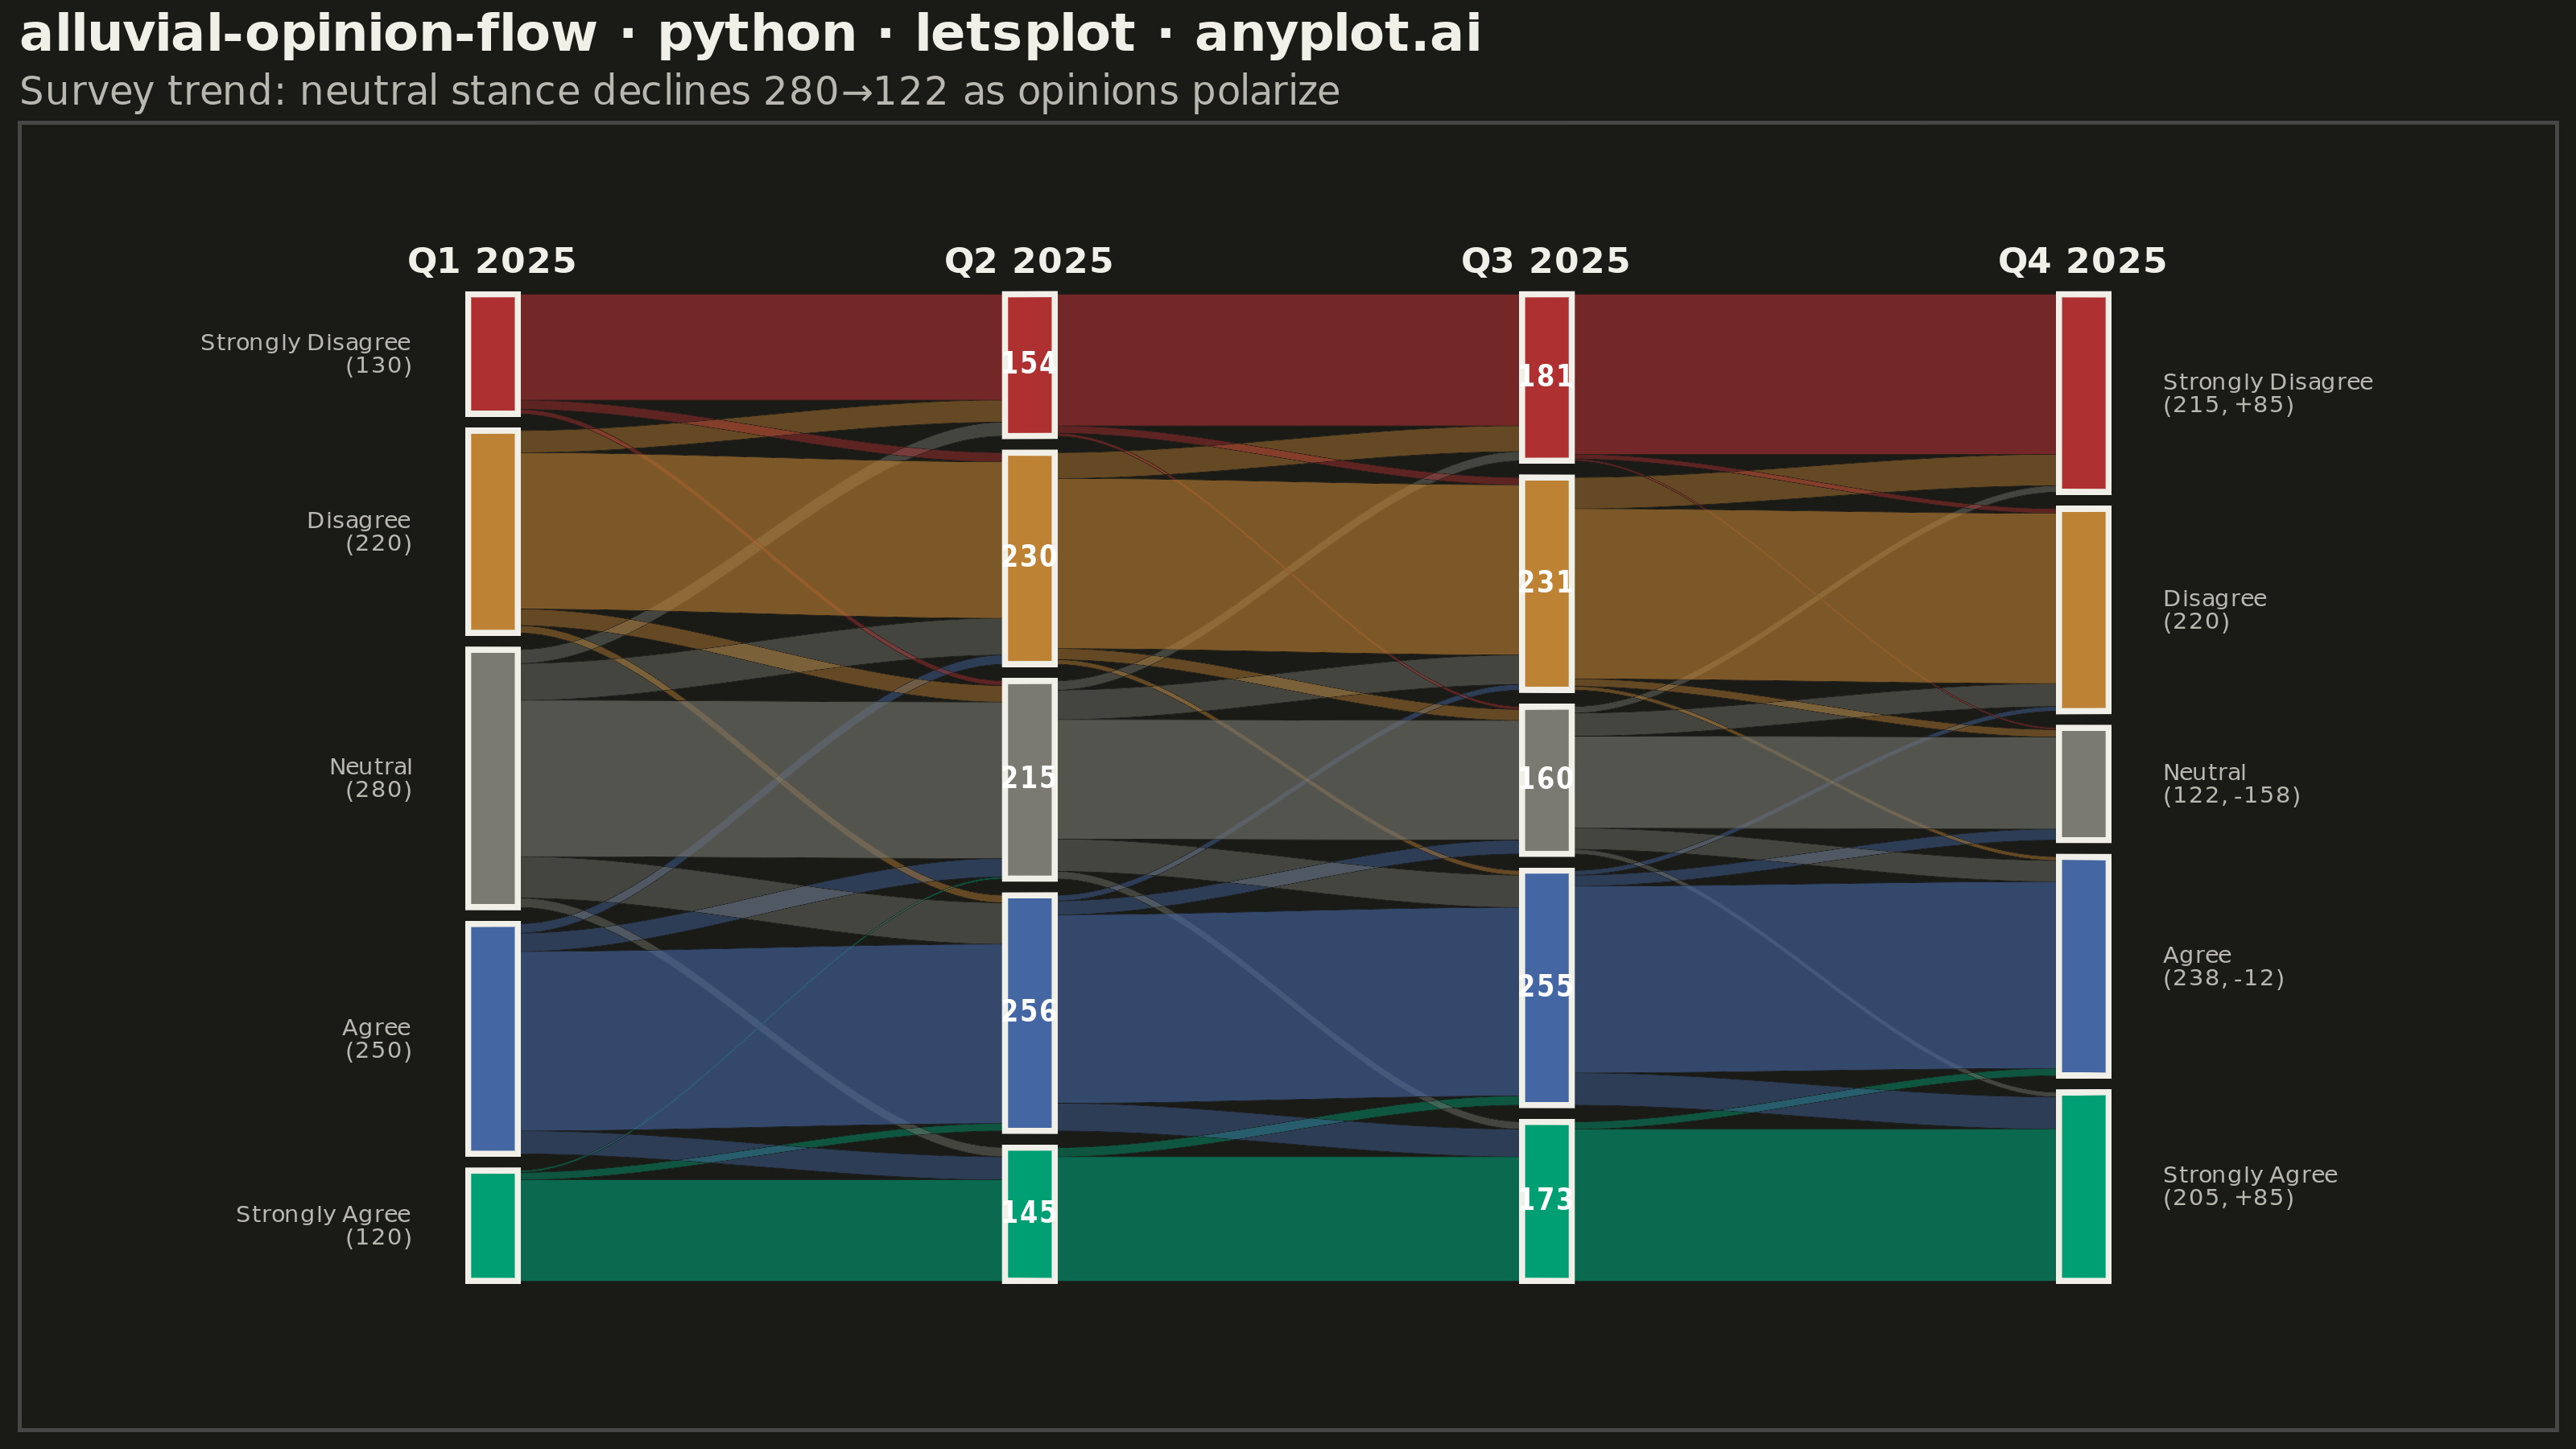
An alluvial/Sankey-style diagram showing how opinions or group memberships shift between survey waves or time periods. Flows connect the same response categories across columns, revealing patterns of opinion change, stability, and polarization. Unlike a basic alluvial diagram, this variant emphasizes distinguishing stable respondents from net changers and displays respondent totals per category at each wave.
""" anyplot.ai
alluvial-opinion-flow: Opinion Flow Diagram
Library: letsplot 4.10.1 | Python 3.13.13
Quality: 89/100 | Updated: 2026-05-30
"""

import os

import numpy as np
import pandas as pd
from lets_plot import (
    LetsPlot,
    aes,
    element_blank,
    element_rect,
    element_text,
    geom_rect,
    geom_ribbon,
    geom_text,
    ggplot,
    ggsize,
    labs,
    layer_tooltips,
    scale_fill_manual,
    scale_x_continuous,
    scale_y_continuous,
    theme,
    theme_minimal,
)
from lets_plot.export import ggsave


LetsPlot.setup_html()

# Theme tokens — Imprint palette chrome, theme-adaptive
THEME = os.getenv("ANYPLOT_THEME", "light")
PAGE_BG = "#FAF8F1" if THEME == "light" else "#1A1A17"
ELEVATED_BG = "#FFFDF6" if THEME == "light" else "#242420"
INK = "#1A1A17" if THEME == "light" else "#F0EFE8"
INK_SOFT = "#4A4A44" if THEME == "light" else "#B8B7B0"
INK_MUTED = "#6B6A63" if THEME == "light" else "#A8A79F"

# Imprint palette — semantic mapping for sentiment categories
# positive → green, leaning positive → blue, neutral → muted, negative → red
category_colors = {
    "Strongly Agree": "#009E73",  # Imprint pos 1: brand green
    "Agree": "#4467A3",  # Imprint pos 3: blue
    "Neutral": "#7A7A72",  # fixed mid-gray, consistent across both themes
    "Disagree": "#BD8233",  # Imprint pos 4: ochre
    "Strongly Disagree": "#AE3030",  # Imprint pos 5: matte red
}

# Survey data: 1000 respondents tracked across 4 quarterly waves (climate policy)
np.random.seed(42)

waves = ["Q1 2025", "Q2 2025", "Q3 2025", "Q4 2025"]
categories = ["Strongly Agree", "Agree", "Neutral", "Disagree", "Strongly Disagree"]

initial_counts = {"Strongly Agree": 120, "Agree": 250, "Neutral": 280, "Disagree": 220, "Strongly Disagree": 130}

# Flows Q1 → Q2
flows_q1_q2 = [
    ("Strongly Agree", "Strongly Agree", 110),
    ("Strongly Agree", "Agree", 8),
    ("Strongly Agree", "Neutral", 2),
    ("Agree", "Strongly Agree", 25),
    ("Agree", "Agree", 195),
    ("Agree", "Neutral", 20),
    ("Agree", "Disagree", 10),
    ("Neutral", "Strongly Agree", 10),
    ("Neutral", "Agree", 45),
    ("Neutral", "Neutral", 170),
    ("Neutral", "Disagree", 40),
    ("Neutral", "Strongly Disagree", 15),
    ("Disagree", "Agree", 8),
    ("Disagree", "Neutral", 18),
    ("Disagree", "Disagree", 170),
    ("Disagree", "Strongly Disagree", 24),
    ("Strongly Disagree", "Neutral", 5),
    ("Strongly Disagree", "Disagree", 10),
    ("Strongly Disagree", "Strongly Disagree", 115),
]

# Flows Q2 → Q3
flows_q2_q3 = [
    ("Strongly Agree", "Strongly Agree", 135),
    ("Strongly Agree", "Agree", 10),
    ("Agree", "Strongly Agree", 30),
    ("Agree", "Agree", 205),
    ("Agree", "Neutral", 15),
    ("Agree", "Disagree", 6),
    ("Neutral", "Strongly Agree", 8),
    ("Neutral", "Agree", 35),
    ("Neutral", "Neutral", 130),
    ("Neutral", "Disagree", 32),
    ("Neutral", "Strongly Disagree", 10),
    ("Disagree", "Agree", 5),
    ("Disagree", "Neutral", 12),
    ("Disagree", "Disagree", 185),
    ("Disagree", "Strongly Disagree", 28),
    ("Strongly Disagree", "Neutral", 3),
    ("Strongly Disagree", "Disagree", 8),
    ("Strongly Disagree", "Strongly Disagree", 143),
]

# Flows Q3 → Q4 (balanced: each category outflow equals its Q3 total 173/255/160/231/181)
flows_q3_q4 = [
    ("Strongly Agree", "Strongly Agree", 165),
    ("Strongly Agree", "Agree", 8),
    ("Agree", "Strongly Agree", 35),
    ("Agree", "Agree", 203),  # +5 vs original to balance Agree outflow (255 total)
    ("Agree", "Neutral", 12),
    ("Agree", "Disagree", 5),
    ("Neutral", "Strongly Agree", 5),
    ("Neutral", "Agree", 23),  # -5 vs original to balance Neutral outflow (160 total)
    ("Neutral", "Neutral", 100),
    ("Neutral", "Disagree", 25),
    ("Neutral", "Strongly Disagree", 7),
    ("Disagree", "Agree", 4),
    ("Disagree", "Neutral", 8),
    ("Disagree", "Disagree", 185),
    ("Disagree", "Strongly Disagree", 34),  # +1 to balance Disagree outflow (231 total)
    ("Strongly Disagree", "Neutral", 2),
    ("Strongly Disagree", "Disagree", 5),
    ("Strongly Disagree", "Strongly Disagree", 174),
]

all_flows = [flows_q1_q2, flows_q2_q3, flows_q3_q4]

# Calculate wave totals
wave_totals = [initial_counts.copy()]
for wave_flows in all_flows:
    totals = dict.fromkeys(categories, 0)
    for _, to_cat, val in wave_flows:
        totals[to_cat] += val
    wave_totals.append(totals)

# Layout parameters
x_positions = [0.10, 0.37, 0.63, 0.90]
node_width = 0.025
node_gap = 0.015
total_respondents = sum(initial_counts.values())

# Node positions per wave
node_positions = []
for wave_idx, totals in enumerate(wave_totals):
    positions = {}
    y_offset = 0.06
    for cat in categories:
        height = totals.get(cat, 0) / total_respondents * 0.82
        positions[cat] = {"y0": y_offset, "y1": y_offset + height, "x": x_positions[wave_idx]}
        y_offset += height + node_gap
    node_positions.append(positions)

# Flow ribbons via smooth hermite interpolation
ribbon_data = []
n_points = 40

for wave_idx, wave_flows in enumerate(all_flows):
    src_positions = node_positions[wave_idx]
    tgt_positions = node_positions[wave_idx + 1]
    x_left = x_positions[wave_idx] + node_width / 2
    x_right = x_positions[wave_idx + 1] - node_width / 2
    src_offsets = dict.fromkeys(categories, 0.0)
    tgt_offsets = dict.fromkeys(categories, 0.0)

    for from_cat, to_cat, val in wave_flows:
        flow_height = val / total_respondents * 0.82
        is_stable = from_cat == to_cat

        src_y0 = src_positions[from_cat]["y0"] + src_offsets[from_cat]
        src_y1 = src_y0 + flow_height
        src_offsets[from_cat] += flow_height

        tgt_y0 = tgt_positions[to_cat]["y0"] + tgt_offsets[to_cat]
        tgt_y1 = tgt_y0 + flow_height
        tgt_offsets[to_cat] += flow_height

        flow_id = f"w{wave_idx}_{from_cat}_{to_cat}"
        stability = "stable" if is_stable else "changed"

        for i in range(n_points + 1):
            t = i / n_points
            x = x_left + t * (x_right - x_left)
            ease = t * t * (3 - 2 * t)
            ymin_val = src_y0 + ease * (tgt_y0 - src_y0)
            ymax_val = src_y1 + ease * (tgt_y1 - src_y1)
            ribbon_data.append(
                {
                    "x": x,
                    "ymin": ymin_val,
                    "ymax": ymax_val,
                    "flow_id": flow_id,
                    "category": from_cat,
                    "stability": stability,
                    "from_cat": from_cat,
                    "to_cat": to_cat,
                    "count": str(val),
                }
            )

df_ribbons = pd.DataFrame(ribbon_data)
df_stable = df_ribbons[df_ribbons["stability"] == "stable"]
df_changed = df_ribbons[df_ribbons["stability"] == "changed"]

# Node rectangles
node_rects = []
for wave_idx, positions in enumerate(node_positions):
    for cat in categories:
        pos = positions[cat]
        node_rects.append(
            {
                "xmin": pos["x"] - node_width / 2,
                "xmax": pos["x"] + node_width / 2,
                "ymin": pos["y0"],
                "ymax": pos["y1"],
                "category": cat,
                "wave": waves[wave_idx],
                "count": str(wave_totals[wave_idx][cat]),
            }
        )

df_nodes = pd.DataFrame(node_rects)

# Labels
label_rows = []

for i, wave in enumerate(waves):
    label_rows.append({"x": x_positions[i], "y": 0.97, "label": wave, "type": "header"})

for cat in categories:
    pos = node_positions[0][cat]
    count = initial_counts[cat]
    label_rows.append(
        {
            "x": x_positions[0] - node_width - 0.015,
            "y": (pos["y0"] + pos["y1"]) / 2,
            "label": f"{cat}\n({count})",
            "type": "left_label",
        }
    )

for cat in categories:
    pos = node_positions[3][cat]
    count = wave_totals[3][cat]
    change = count - initial_counts[cat]
    change_str = f", +{change}" if change > 0 else (f", {change}" if change < 0 else "")
    label_rows.append(
        {
            "x": x_positions[3] + node_width + 0.015,
            "y": (pos["y0"] + pos["y1"]) / 2,
            "label": f"{cat}\n({count}{change_str})",
            "type": "right_label",
        }
    )

for wave_idx in [1, 2]:
    for cat in categories:
        pos = node_positions[wave_idx][cat]
        count = wave_totals[wave_idx][cat]
        height = pos["y1"] - pos["y0"]
        if height > 0.03:
            label_rows.append(
                {
                    "x": x_positions[wave_idx],
                    "y": (pos["y0"] + pos["y1"]) / 2,
                    "label": str(count),
                    "type": "node_count",
                }
            )

df_labels = pd.DataFrame(label_rows)

# Title with length-scaled fontsize (default 16px for scale-based libs)
title = "alluvial-opinion-flow · python · letsplot · anyplot.ai"
n = len(title)
ratio = 67 / n if n > 67 else 1.0
title_size = max(11, round(16 * ratio))

# Plot
plot = (
    ggplot()
    + geom_ribbon(
        aes(x="x", ymin="ymin", ymax="ymax", group="flow_id", fill="category"),
        data=df_changed,
        alpha=0.45,
        color=PAGE_BG,
        size=0.05,
        tooltips=layer_tooltips().line("@from_cat -> @to_cat").line("@count respondents (changed)"),
    )
    + geom_ribbon(
        aes(x="x", ymin="ymin", ymax="ymax", group="flow_id", fill="category"),
        data=df_stable,
        alpha=0.6,
        color=PAGE_BG,
        size=0.05,
        tooltips=layer_tooltips().line("@from_cat (stable)").line("@count respondents"),
    )
    + geom_rect(
        aes(xmin="xmin", xmax="xmax", ymin="ymin", ymax="ymax", fill="category"),
        data=df_nodes,
        color=INK,
        size=0.8,
        tooltips=layer_tooltips().line("@category").line("Wave: @wave").line("Count: @count"),
    )
    + geom_text(
        aes(x="x", y="y", label="label"),
        data=df_labels[df_labels["type"] == "header"],
        size=5.5,
        fontface="bold",
        color=INK,
    )
    + geom_text(
        aes(x="x", y="y", label="label"),
        data=df_labels[df_labels["type"] == "left_label"],
        size=3.6,
        hjust=1,
        color=INK_SOFT,
    )
    + geom_text(
        aes(x="x", y="y", label="label"),
        data=df_labels[df_labels["type"] == "right_label"],
        size=3.6,
        hjust=0,
        color=INK_SOFT,
    )
    + geom_text(
        aes(x="x", y="y", label="label"),
        data=df_labels[df_labels["type"] == "node_count"],
        size=4.0,
        color="white",
        fontface="bold",
    )
    + scale_fill_manual(values=category_colors)
    + labs(title=title, subtitle="Survey trend: neutral stance declines 280→122 as opinions polarize")
    + theme_minimal()
    + theme(
        plot_background=element_rect(fill=PAGE_BG, color=PAGE_BG),
        panel_background=element_rect(fill=PAGE_BG),
        plot_title=element_text(size=title_size, face="bold", color=INK),
        plot_subtitle=element_text(size=12, color=INK_SOFT),
        axis_title=element_blank(),
        axis_text=element_blank(),
        axis_ticks=element_blank(),
        panel_grid=element_blank(),
        legend_position="none",
    )
    + scale_x_continuous(limits=[-0.08, 1.08])
    + scale_y_continuous(limits=[-0.02, 1.04])
    + ggsize(800, 450)
)

# Save
ggsave(plot, f"plot-{THEME}.png", path=".", scale=4)
ggsave(plot, f"plot-{THEME}.html", path=".")
Runnable source as JSON, for any HTTP client: https://api.anyplot.ai/specs/alluvial-opinion-flow/letsplot/code. Any spec id and library id listed in llms-full.txt fit the same URL shape; every URL below is complete and callable.
{
  "spec_id": "alluvial-opinion-flow",
  "language": "python",
  "library": "letsplot",
  "page": "https://anyplot.ai/alluvial-opinion-flow/python/letsplot",
  "hub": "https://anyplot.ai/alluvial-opinion-flow",
  "code_json": "https://api.anyplot.ai/specs/alluvial-opinion-flow/letsplot/code",
  "spec_json": "https://api.anyplot.ai/specs/alluvial-opinion-flow",
  "render_light_png": "https://storage.googleapis.com/anyplot-images/plots/alluvial-opinion-flow/python/letsplot/plot-light.png",
  "render_dark_png": "https://storage.googleapis.com/anyplot-images/plots/alluvial-opinion-flow/python/letsplot/plot-dark.png",
  "interactive_light_html": "https://storage.googleapis.com/anyplot-images/plots/alluvial-opinion-flow/python/letsplot/plot-light.html",
  "interactive_dark_html": "https://storage.googleapis.com/anyplot-images/plots/alluvial-opinion-flow/python/letsplot/plot-dark.html",
  "quality_score": 89.0,
  "license": "MIT",
  "guide": "https://anyplot.ai/llms.txt"
}
Part of Opinion Flow Diagram on anyplot.ai.