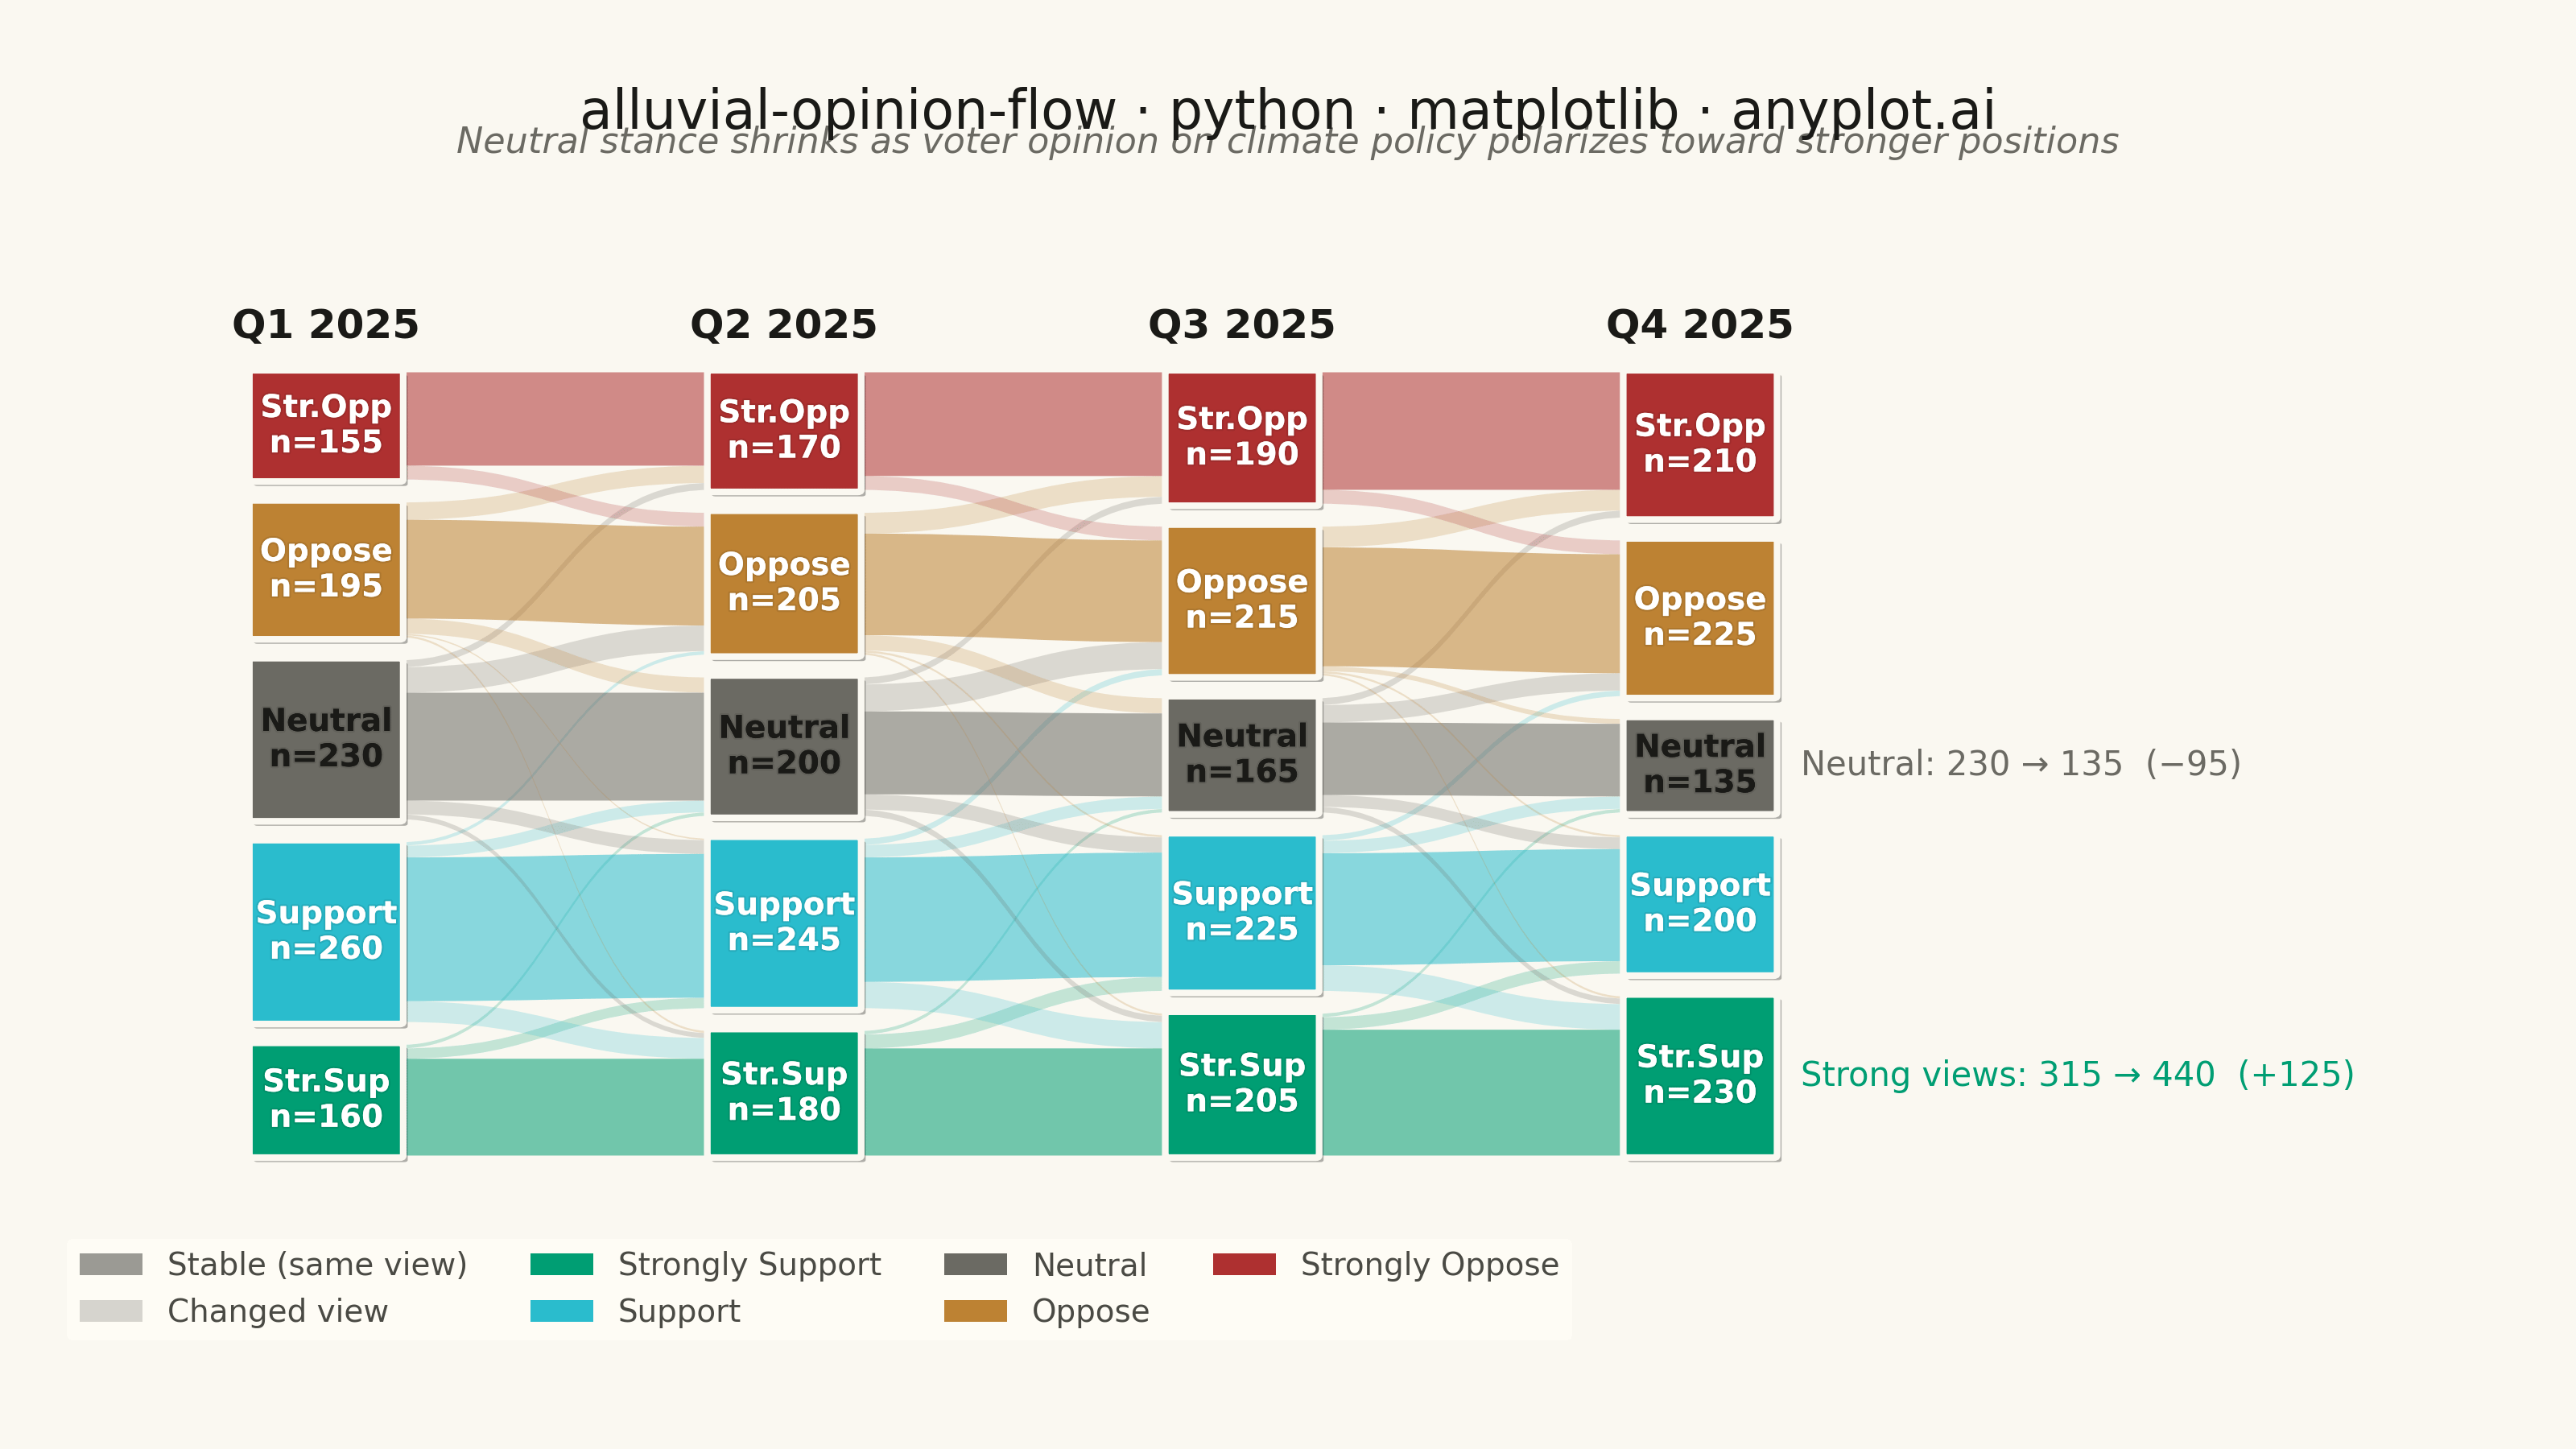
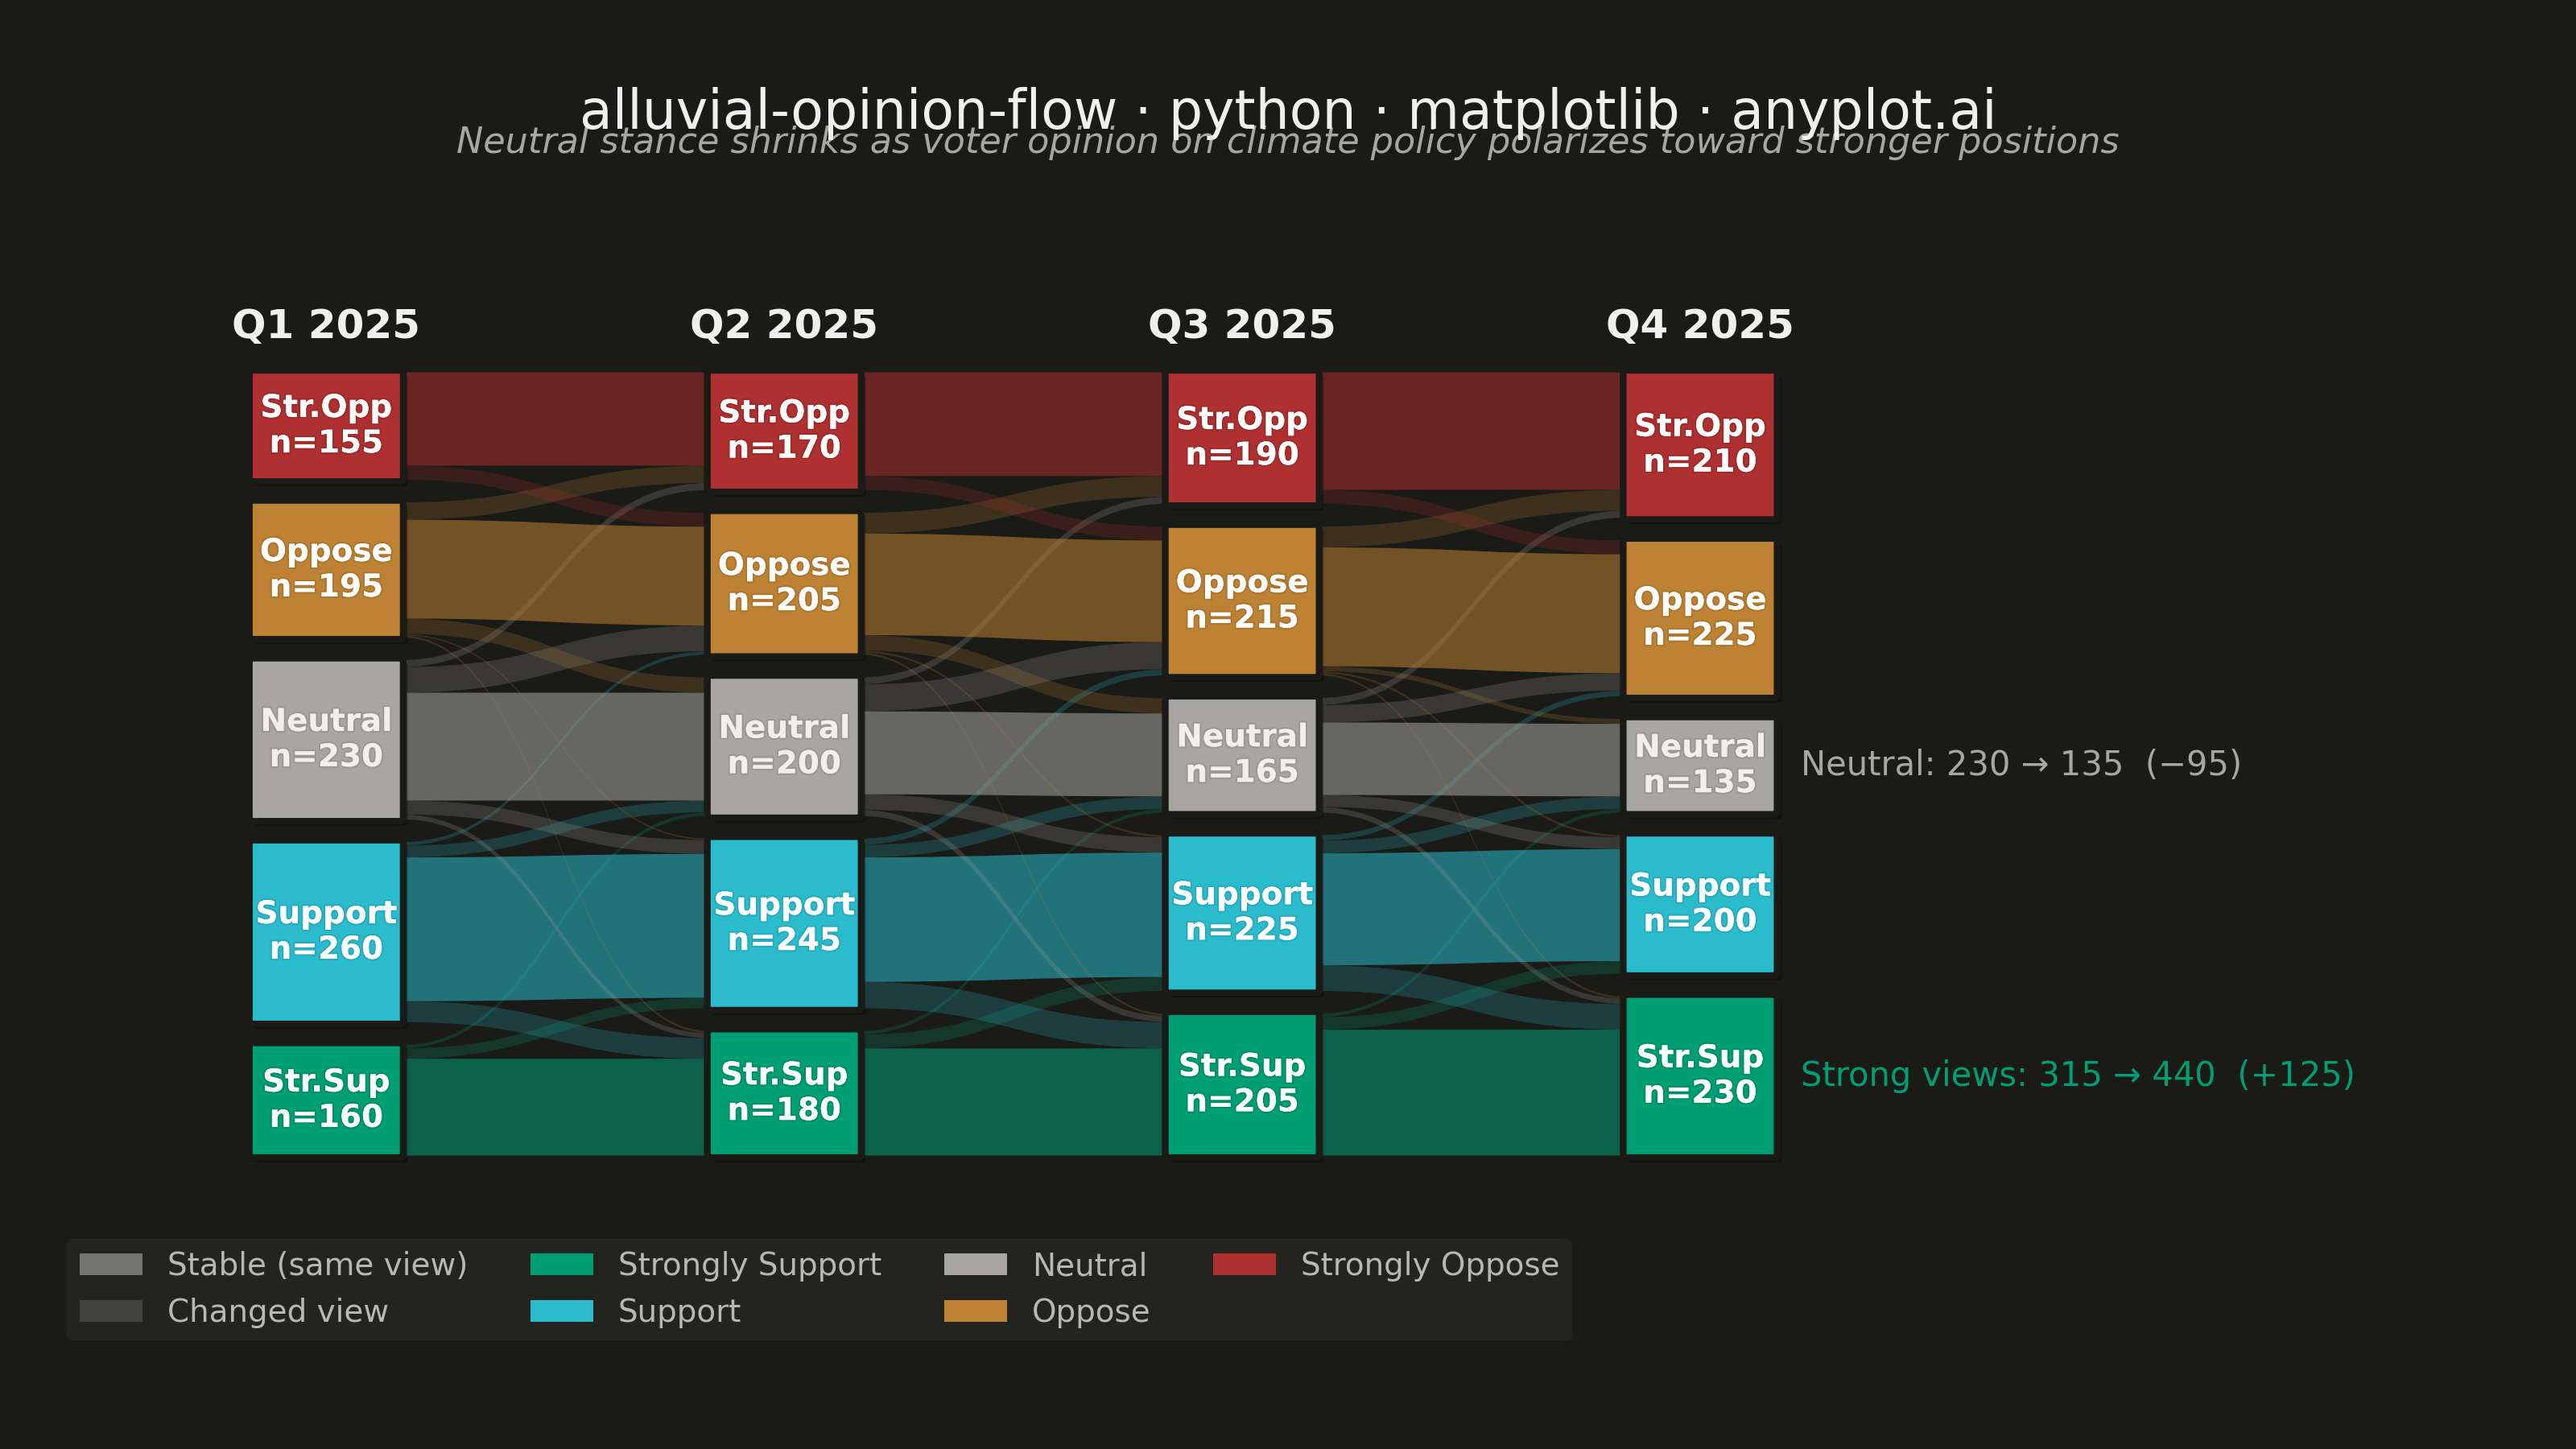
An alluvial/Sankey-style diagram showing how opinions or group memberships shift between survey waves or time periods. Flows connect the same response categories across columns, revealing patterns of opinion change, stability, and polarization. Unlike a basic alluvial diagram, this variant emphasizes distinguishing stable respondents from net changers and displays respondent totals per category at each wave.
""" anyplot.ai
alluvial-opinion-flow: Opinion Flow Diagram
Library: matplotlib 3.10.9 | Python 3.13.13
Quality: 92/100 | Updated: 2026-05-30
"""

import os

import matplotlib.patches as mpatches
import matplotlib.patheffects as patheffects
import matplotlib.pyplot as plt
import numpy as np
from matplotlib.path import Path


# Theme tokens
THEME = os.getenv("ANYPLOT_THEME", "light")
PAGE_BG = "#FAF8F1" if THEME == "light" else "#1A1A17"
ELEVATED_BG = "#FFFDF6" if THEME == "light" else "#242420"
INK = "#1A1A17" if THEME == "light" else "#F0EFE8"
INK_SOFT = "#4A4A44" if THEME == "light" else "#B8B7B0"
INK_MUTED = "#6B6A63" if THEME == "light" else "#A8A79F"

# Imprint palette — semantic mapping for diverging opinion scale
# Strongly positive → green, positive → cyan, neutral → muted, negative → ochre, strongly negative → red
CAT_COLORS = {
    "Strongly Support": "#009E73",  # Imprint brand green — strongly positive
    "Support": "#2ABCCD",  # Imprint cyan — positive
    "Neutral": INK_MUTED,  # Imprint muted anchor — undecided
    "Oppose": "#BD8233",  # Imprint ochre — negative leaning
    "Strongly Oppose": "#AE3030",  # Imprint matte red — strongly negative
}

# Data: Voter opinion on climate legislation tracked across 4 quarterly waves (n=1000)
np.random.seed(42)

waves = ["Q1 2025", "Q2 2025", "Q3 2025", "Q4 2025"]
categories = ["Strongly Support", "Support", "Neutral", "Oppose", "Strongly Oppose"]

node_values = {
    "Q1 2025": {"Strongly Support": 160, "Support": 260, "Neutral": 230, "Oppose": 195, "Strongly Oppose": 155},
    "Q2 2025": {"Strongly Support": 180, "Support": 245, "Neutral": 200, "Oppose": 205, "Strongly Oppose": 170},
    "Q3 2025": {"Strongly Support": 205, "Support": 225, "Neutral": 165, "Oppose": 215, "Strongly Oppose": 190},
    "Q4 2025": {"Strongly Support": 230, "Support": 200, "Neutral": 135, "Oppose": 225, "Strongly Oppose": 210},
}

# Flow matrices — row = source, col = target; row sums match source wave totals
flows = [
    # Q1 → Q2
    {
        ("Strongly Support", "Strongly Support"): 140,
        ("Strongly Support", "Support"): 15,
        ("Strongly Support", "Neutral"): 5,
        ("Strongly Support", "Oppose"): 0,
        ("Strongly Support", "Strongly Oppose"): 0,
        ("Support", "Strongly Support"): 30,
        ("Support", "Support"): 208,
        ("Support", "Neutral"): 17,
        ("Support", "Oppose"): 5,
        ("Support", "Strongly Oppose"): 0,
        ("Neutral", "Strongly Support"): 7,
        ("Neutral", "Support"): 20,
        ("Neutral", "Neutral"): 156,
        ("Neutral", "Oppose"): 37,
        ("Neutral", "Strongly Oppose"): 10,
        ("Oppose", "Strongly Support"): 3,
        ("Oppose", "Support"): 2,
        ("Oppose", "Neutral"): 22,
        ("Oppose", "Oppose"): 143,
        ("Oppose", "Strongly Oppose"): 25,
        ("Strongly Oppose", "Strongly Support"): 0,
        ("Strongly Oppose", "Support"): 0,
        ("Strongly Oppose", "Neutral"): 0,
        ("Strongly Oppose", "Oppose"): 20,
        ("Strongly Oppose", "Strongly Oppose"): 135,
    },
    # Q2 → Q3
    {
        ("Strongly Support", "Strongly Support"): 155,
        ("Strongly Support", "Support"): 20,
        ("Strongly Support", "Neutral"): 5,
        ("Strongly Support", "Oppose"): 0,
        ("Strongly Support", "Strongly Oppose"): 0,
        ("Support", "Strongly Support"): 38,
        ("Support", "Support"): 180,
        ("Support", "Neutral"): 18,
        ("Support", "Oppose"): 9,
        ("Support", "Strongly Oppose"): 0,
        ("Neutral", "Strongly Support"): 9,
        ("Neutral", "Support"): 22,
        ("Neutral", "Neutral"): 120,
        ("Neutral", "Oppose"): 39,
        ("Neutral", "Strongly Oppose"): 10,
        ("Oppose", "Strongly Support"): 3,
        ("Oppose", "Support"): 3,
        ("Oppose", "Neutral"): 22,
        ("Oppose", "Oppose"): 147,
        ("Oppose", "Strongly Oppose"): 30,
        ("Strongly Oppose", "Strongly Support"): 0,
        ("Strongly Oppose", "Support"): 0,
        ("Strongly Oppose", "Neutral"): 0,
        ("Strongly Oppose", "Oppose"): 20,
        ("Strongly Oppose", "Strongly Oppose"): 150,
    },
    # Q3 → Q4
    {
        ("Strongly Support", "Strongly Support"): 182,
        ("Strongly Support", "Support"): 18,
        ("Strongly Support", "Neutral"): 5,
        ("Strongly Support", "Oppose"): 0,
        ("Strongly Support", "Strongly Oppose"): 0,
        ("Support", "Strongly Support"): 37,
        ("Support", "Support"): 162,
        ("Support", "Neutral"): 18,
        ("Support", "Oppose"): 8,
        ("Support", "Strongly Oppose"): 0,
        ("Neutral", "Strongly Support"): 8,
        ("Neutral", "Support"): 17,
        ("Neutral", "Neutral"): 105,
        ("Neutral", "Oppose"): 25,
        ("Neutral", "Strongly Oppose"): 10,
        ("Oppose", "Strongly Support"): 3,
        ("Oppose", "Support"): 3,
        ("Oppose", "Neutral"): 7,
        ("Oppose", "Oppose"): 172,
        ("Oppose", "Strongly Oppose"): 30,
        ("Strongly Oppose", "Strongly Support"): 0,
        ("Strongly Oppose", "Support"): 0,
        ("Strongly Oppose", "Neutral"): 0,
        ("Strongly Oppose", "Oppose"): 20,
        ("Strongly Oppose", "Strongly Oppose"): 170,
    },
]

# Plot
fig, ax = plt.subplots(figsize=(8, 4.5), dpi=400, facecolor=PAGE_BG)
ax.set_facecolor(PAGE_BG)

x_positions = [2.0, 4.5, 7.0, 9.5]
node_width = 0.8
total_height = 7.5
node_gap = 0.22

# Calculate node positions
node_bounds = {}
for t_idx, wave in enumerate(waves):
    values = [node_values[wave][cat] for cat in categories]
    total = sum(values)
    usable_height = total_height - (len(categories) - 1) * node_gap
    heights = [v / total * usable_height for v in values]

    y = 0.5
    for c_idx, cat in enumerate(categories):
        h = heights[c_idx]
        node_bounds[(wave, cat)] = {"x": x_positions[t_idx], "y_start": y, "height": h}
        y += h + node_gap

# Draw bezier flows between consecutive waves
for t_idx in range(len(waves) - 1):
    wave_from = waves[t_idx]
    wave_to = waves[t_idx + 1]

    from_offsets = dict.fromkeys(categories, 0.0)
    to_offsets = dict.fromkeys(categories, 0.0)

    flow_data = flows[t_idx]
    for from_cat in categories:
        for to_cat in categories:
            flow_val = flow_data.get((from_cat, to_cat), 0)
            if flow_val <= 0:
                continue

            from_node = node_bounds[(wave_from, from_cat)]
            to_node = node_bounds[(wave_to, to_cat)]

            from_total = sum(node_values[wave_from].values())
            to_total = sum(node_values[wave_to].values())

            usable_height = total_height - (len(categories) - 1) * node_gap
            from_height = flow_val / from_total * usable_height
            to_height = flow_val / to_total * usable_height

            x0 = from_node["x"] + node_width / 2
            x1 = to_node["x"] - node_width / 2
            mid_x = (x0 + x1) / 2

            y0_start = from_node["y_start"] + from_offsets[from_cat]
            y0_end = y0_start + from_height
            y1_start = to_node["y_start"] + to_offsets[to_cat]
            y1_end = y1_start + to_height

            is_stable = from_cat == to_cat
            alpha = 0.55 if is_stable else 0.22

            verts = [
                (x0, y0_start),
                (mid_x, y0_start),
                (mid_x, y1_start),
                (x1, y1_start),
                (x1, y1_end),
                (mid_x, y1_end),
                (mid_x, y0_end),
                (x0, y0_end),
                (x0, y0_start),
            ]
            codes = [
                Path.MOVETO,
                Path.CURVE4,
                Path.CURVE4,
                Path.CURVE4,
                Path.LINETO,
                Path.CURVE4,
                Path.CURVE4,
                Path.CURVE4,
                Path.CLOSEPOLY,
            ]
            path = Path(verts, codes)
            patch = mpatches.PathPatch(path, facecolor=CAT_COLORS[from_cat], edgecolor="none", alpha=alpha)
            ax.add_patch(patch)

            from_offsets[from_cat] += from_height
            to_offsets[to_cat] += to_height

# Draw nodes with rounded corners
shadow_effect = [patheffects.withSimplePatchShadow(offset=(1.0, -1.0), shadow_rgbFace="#00000012")]
short_names = {
    "Strongly Support": "Str.Sup",
    "Support": "Support",
    "Neutral": "Neutral",
    "Oppose": "Oppose",
    "Strongly Oppose": "Str.Opp",
}
for wave in waves:
    for cat in categories:
        node = node_bounds[(wave, cat)]
        rect = mpatches.FancyBboxPatch(
            (node["x"] - node_width / 2, node["y_start"]),
            node_width,
            node["height"],
            boxstyle="round,pad=0.02",
            facecolor=CAT_COLORS[cat],
            edgecolor=PAGE_BG,
            linewidth=1.5,
            path_effects=shadow_effect,
        )
        ax.add_patch(rect)

        count = node_values[wave][cat]
        label = f"{short_names[cat]}\nn={count}"
        text_color = INK if cat == "Neutral" else "white"
        ax.text(
            node["x"],
            node["y_start"] + node["height"] / 2,
            label,
            ha="center",
            va="center",
            fontsize=7,
            fontweight="bold",
            color=text_color,
            path_effects=[patheffects.withStroke(linewidth=0.8, foreground="#00000015")],
        )

# Wave column headers
for t_idx, wave in enumerate(waves):
    ax.text(
        x_positions[t_idx],
        total_height + 0.75,
        wave,
        ha="center",
        va="bottom",
        fontsize=9,
        fontweight="bold",
        color=INK,
    )

# Trend annotations to the right of Q4
q1_neutral = node_values["Q1 2025"]["Neutral"]
q4_neutral = node_values["Q4 2025"]["Neutral"]
q1_strong = node_values["Q1 2025"]["Strongly Support"] + node_values["Q1 2025"]["Strongly Oppose"]
q4_strong = node_values["Q4 2025"]["Strongly Support"] + node_values["Q4 2025"]["Strongly Oppose"]

ax.annotate(
    f"Neutral: {q1_neutral} → {q4_neutral}  (−{q1_neutral - q4_neutral})",
    xy=(
        x_positions[-1] + node_width / 2 + 0.15,
        node_bounds[("Q4 2025", "Neutral")]["y_start"] + node_bounds[("Q4 2025", "Neutral")]["height"] / 2,
    ),
    fontsize=7.5,
    color=INK_MUTED,
    va="center",
)
ax.annotate(
    f"Strong views: {q1_strong} → {q4_strong}  (+{q4_strong - q1_strong})",
    xy=(
        x_positions[-1] + node_width / 2 + 0.15,
        node_bounds[("Q4 2025", "Strongly Support")]["y_start"]
        + node_bounds[("Q4 2025", "Strongly Support")]["height"] / 2,
    ),
    fontsize=7.5,
    color=CAT_COLORS["Strongly Support"],
    va="center",
)

# Legend
legend_elements = [
    mpatches.Patch(facecolor=INK_SOFT, alpha=0.55, edgecolor="none", label="Stable (same view)"),
    mpatches.Patch(facecolor=INK_SOFT, alpha=0.22, edgecolor="none", label="Changed view"),
]
for cat in categories:
    legend_elements.append(mpatches.Patch(facecolor=CAT_COLORS[cat], label=cat))

leg = ax.legend(
    handles=legend_elements,
    loc="lower left",
    bbox_to_anchor=(0.0, -0.02),
    fontsize=7,
    framealpha=0.92,
    edgecolor="none",
    ncol=4,
)
if leg:
    leg.get_frame().set_facecolor(ELEVATED_BG)
    plt.setp(leg.get_texts(), color=INK_SOFT)

# Title and subtitle
title = "alluvial-opinion-flow · python · matplotlib · anyplot.ai"
title_n = len(title)
title_fontsize = max(8, round(12 * 67 / title_n)) if title_n > 67 else 12

ax.set_xlim(0.5, 14.0)
ax.set_ylim(-1.2, total_height + 2.4)
ax.set_title(title, fontsize=title_fontsize, fontweight="medium", pad=10, color=INK)
ax.text(
    0.5,
    1.012,
    "Neutral stance shrinks as voter opinion on climate policy polarizes toward stronger positions",
    transform=ax.transAxes,
    ha="center",
    va="bottom",
    fontsize=8,
    fontstyle="italic",
    color=INK_MUTED,
)
ax.axis("off")

fig.subplots_adjust(left=0.02, right=0.98, bottom=0.08, top=0.88)
plt.savefig(f"plot-{THEME}.png", dpi=400, facecolor=PAGE_BG)
Runnable source as JSON, for any HTTP client: https://api.anyplot.ai/specs/alluvial-opinion-flow/matplotlib/code. Any spec id and library id listed in llms-full.txt fit the same URL shape; every URL below is complete and callable.
{
  "spec_id": "alluvial-opinion-flow",
  "language": "python",
  "library": "matplotlib",
  "page": "https://anyplot.ai/alluvial-opinion-flow/python/matplotlib",
  "hub": "https://anyplot.ai/alluvial-opinion-flow",
  "code_json": "https://api.anyplot.ai/specs/alluvial-opinion-flow/matplotlib/code",
  "spec_json": "https://api.anyplot.ai/specs/alluvial-opinion-flow",
  "render_light_png": "https://storage.googleapis.com/anyplot-images/plots/alluvial-opinion-flow/python/matplotlib/plot-light.png",
  "render_dark_png": "https://storage.googleapis.com/anyplot-images/plots/alluvial-opinion-flow/python/matplotlib/plot-dark.png",
  "quality_score": 92.0,
  "license": "MIT",
  "guide": "https://anyplot.ai/llms.txt"
}
Part of Opinion Flow Diagram on anyplot.ai.