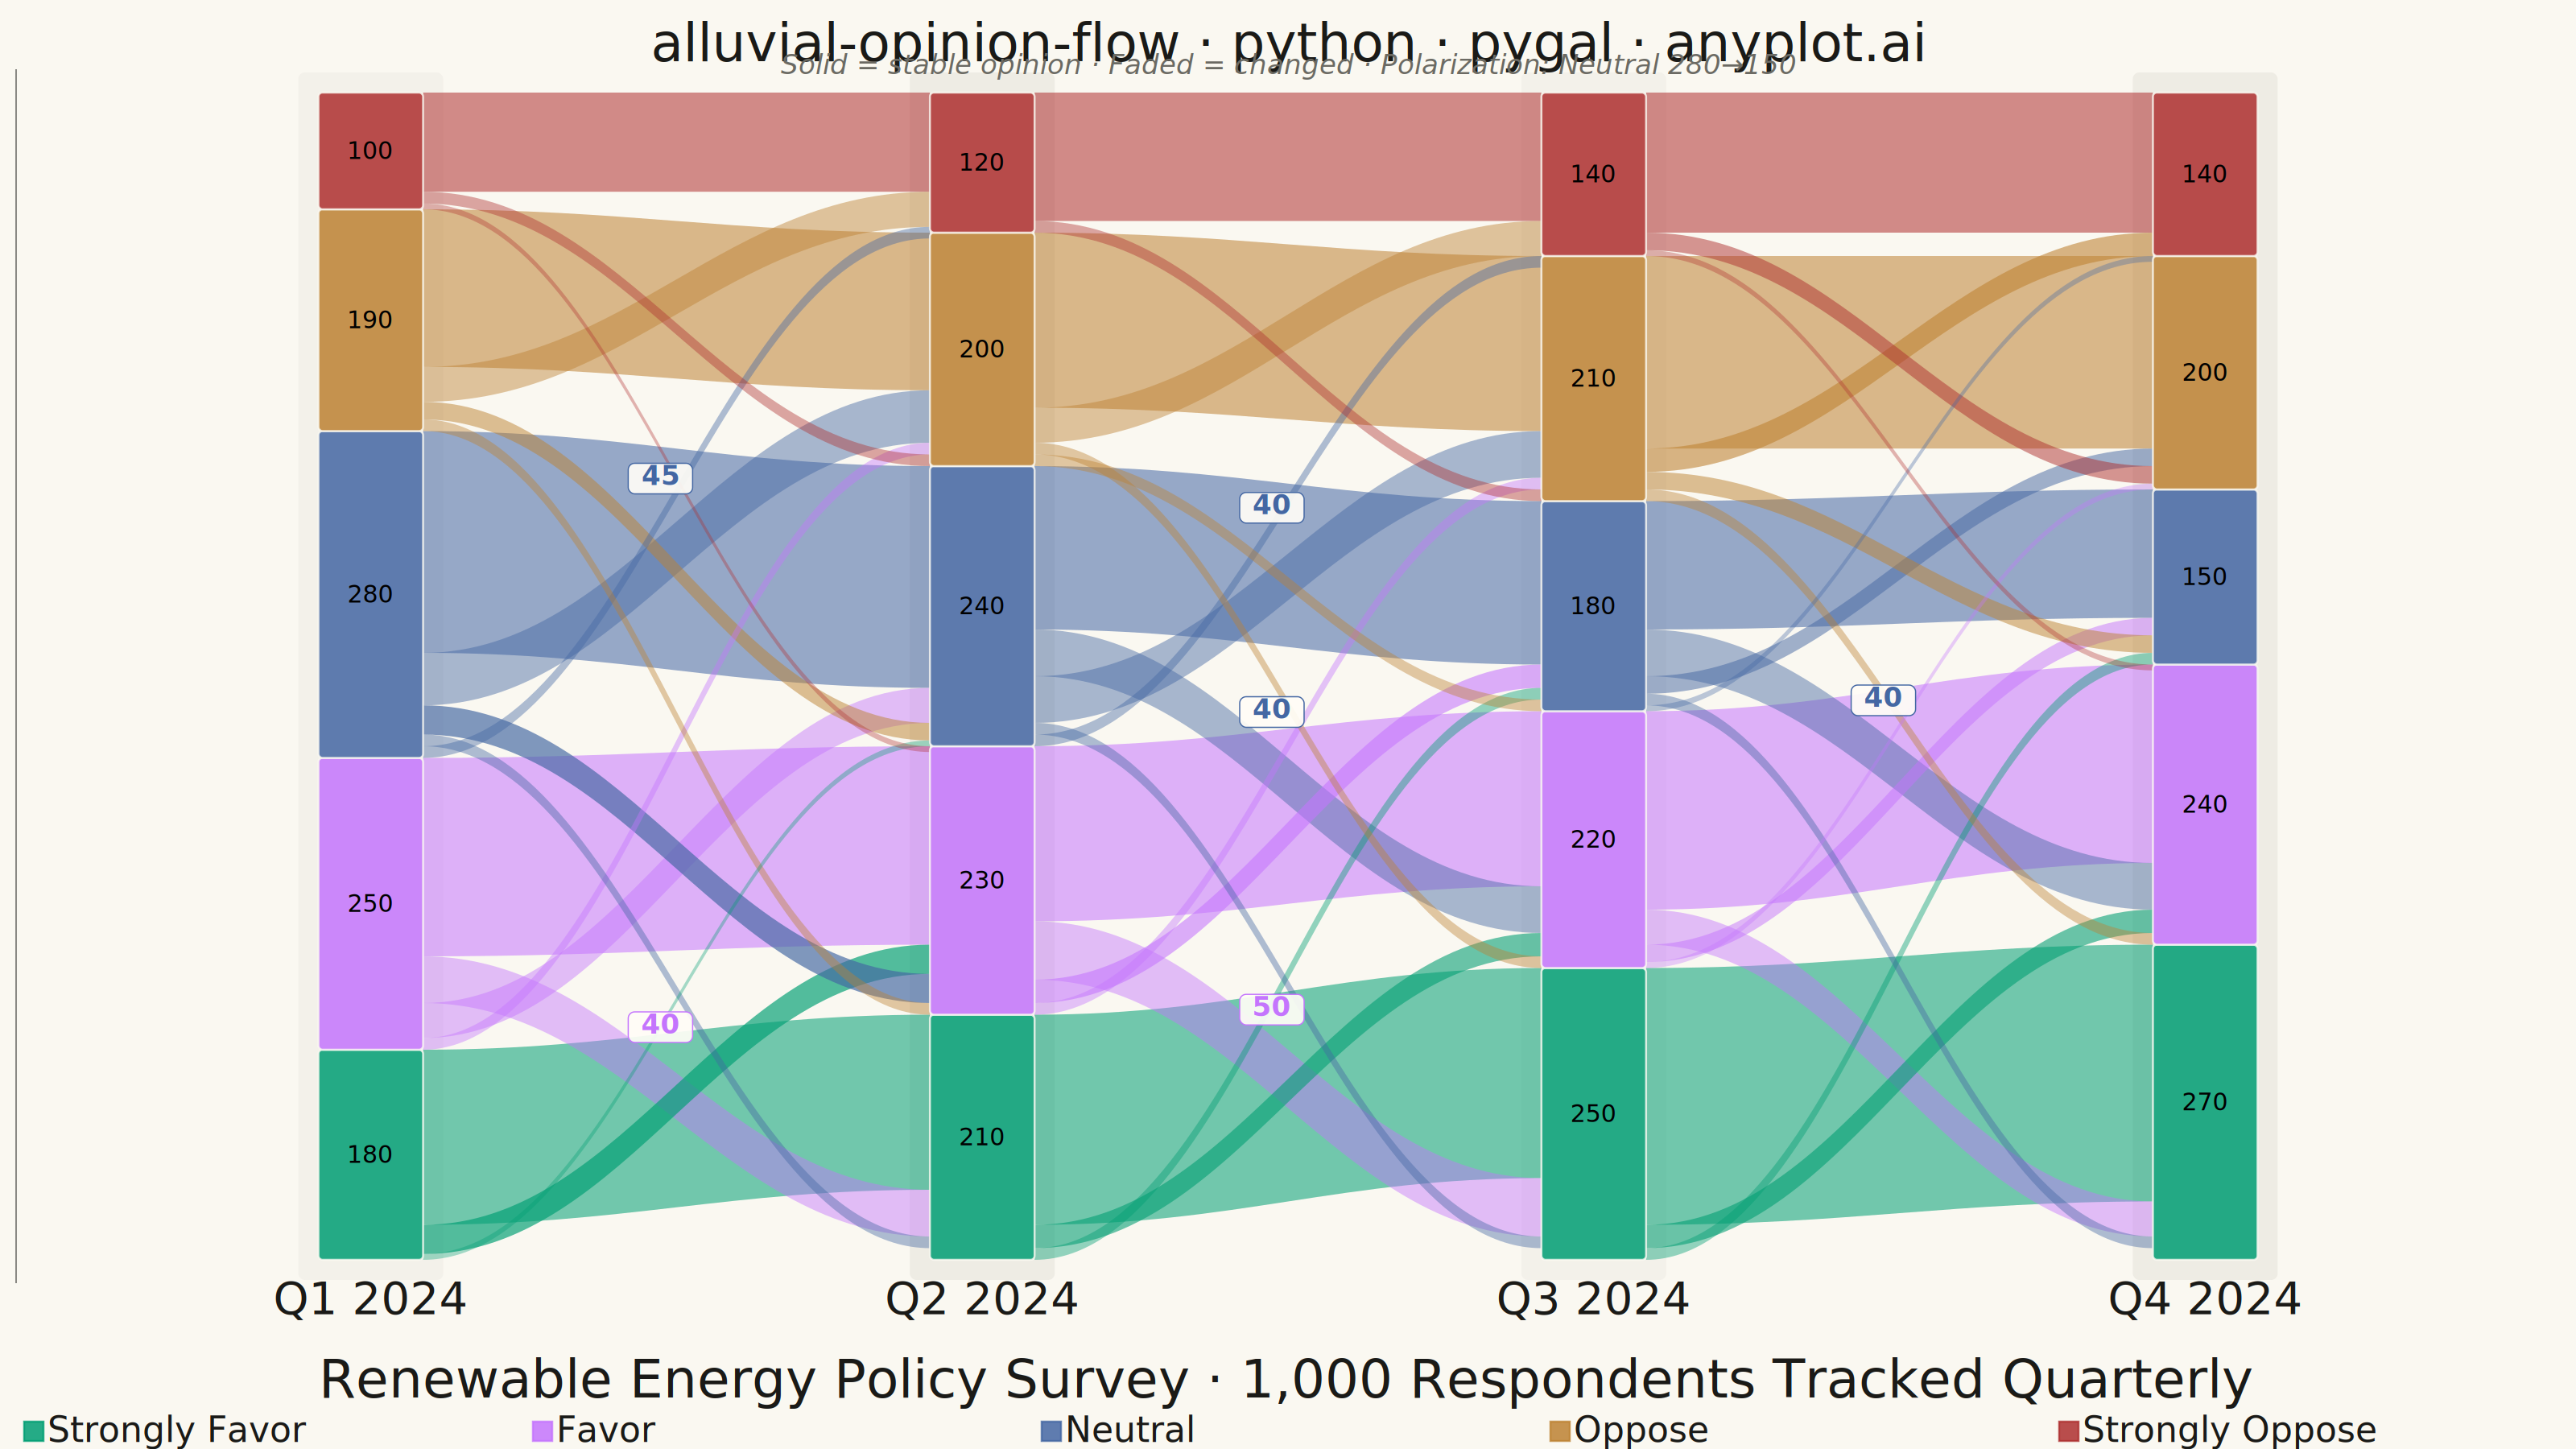
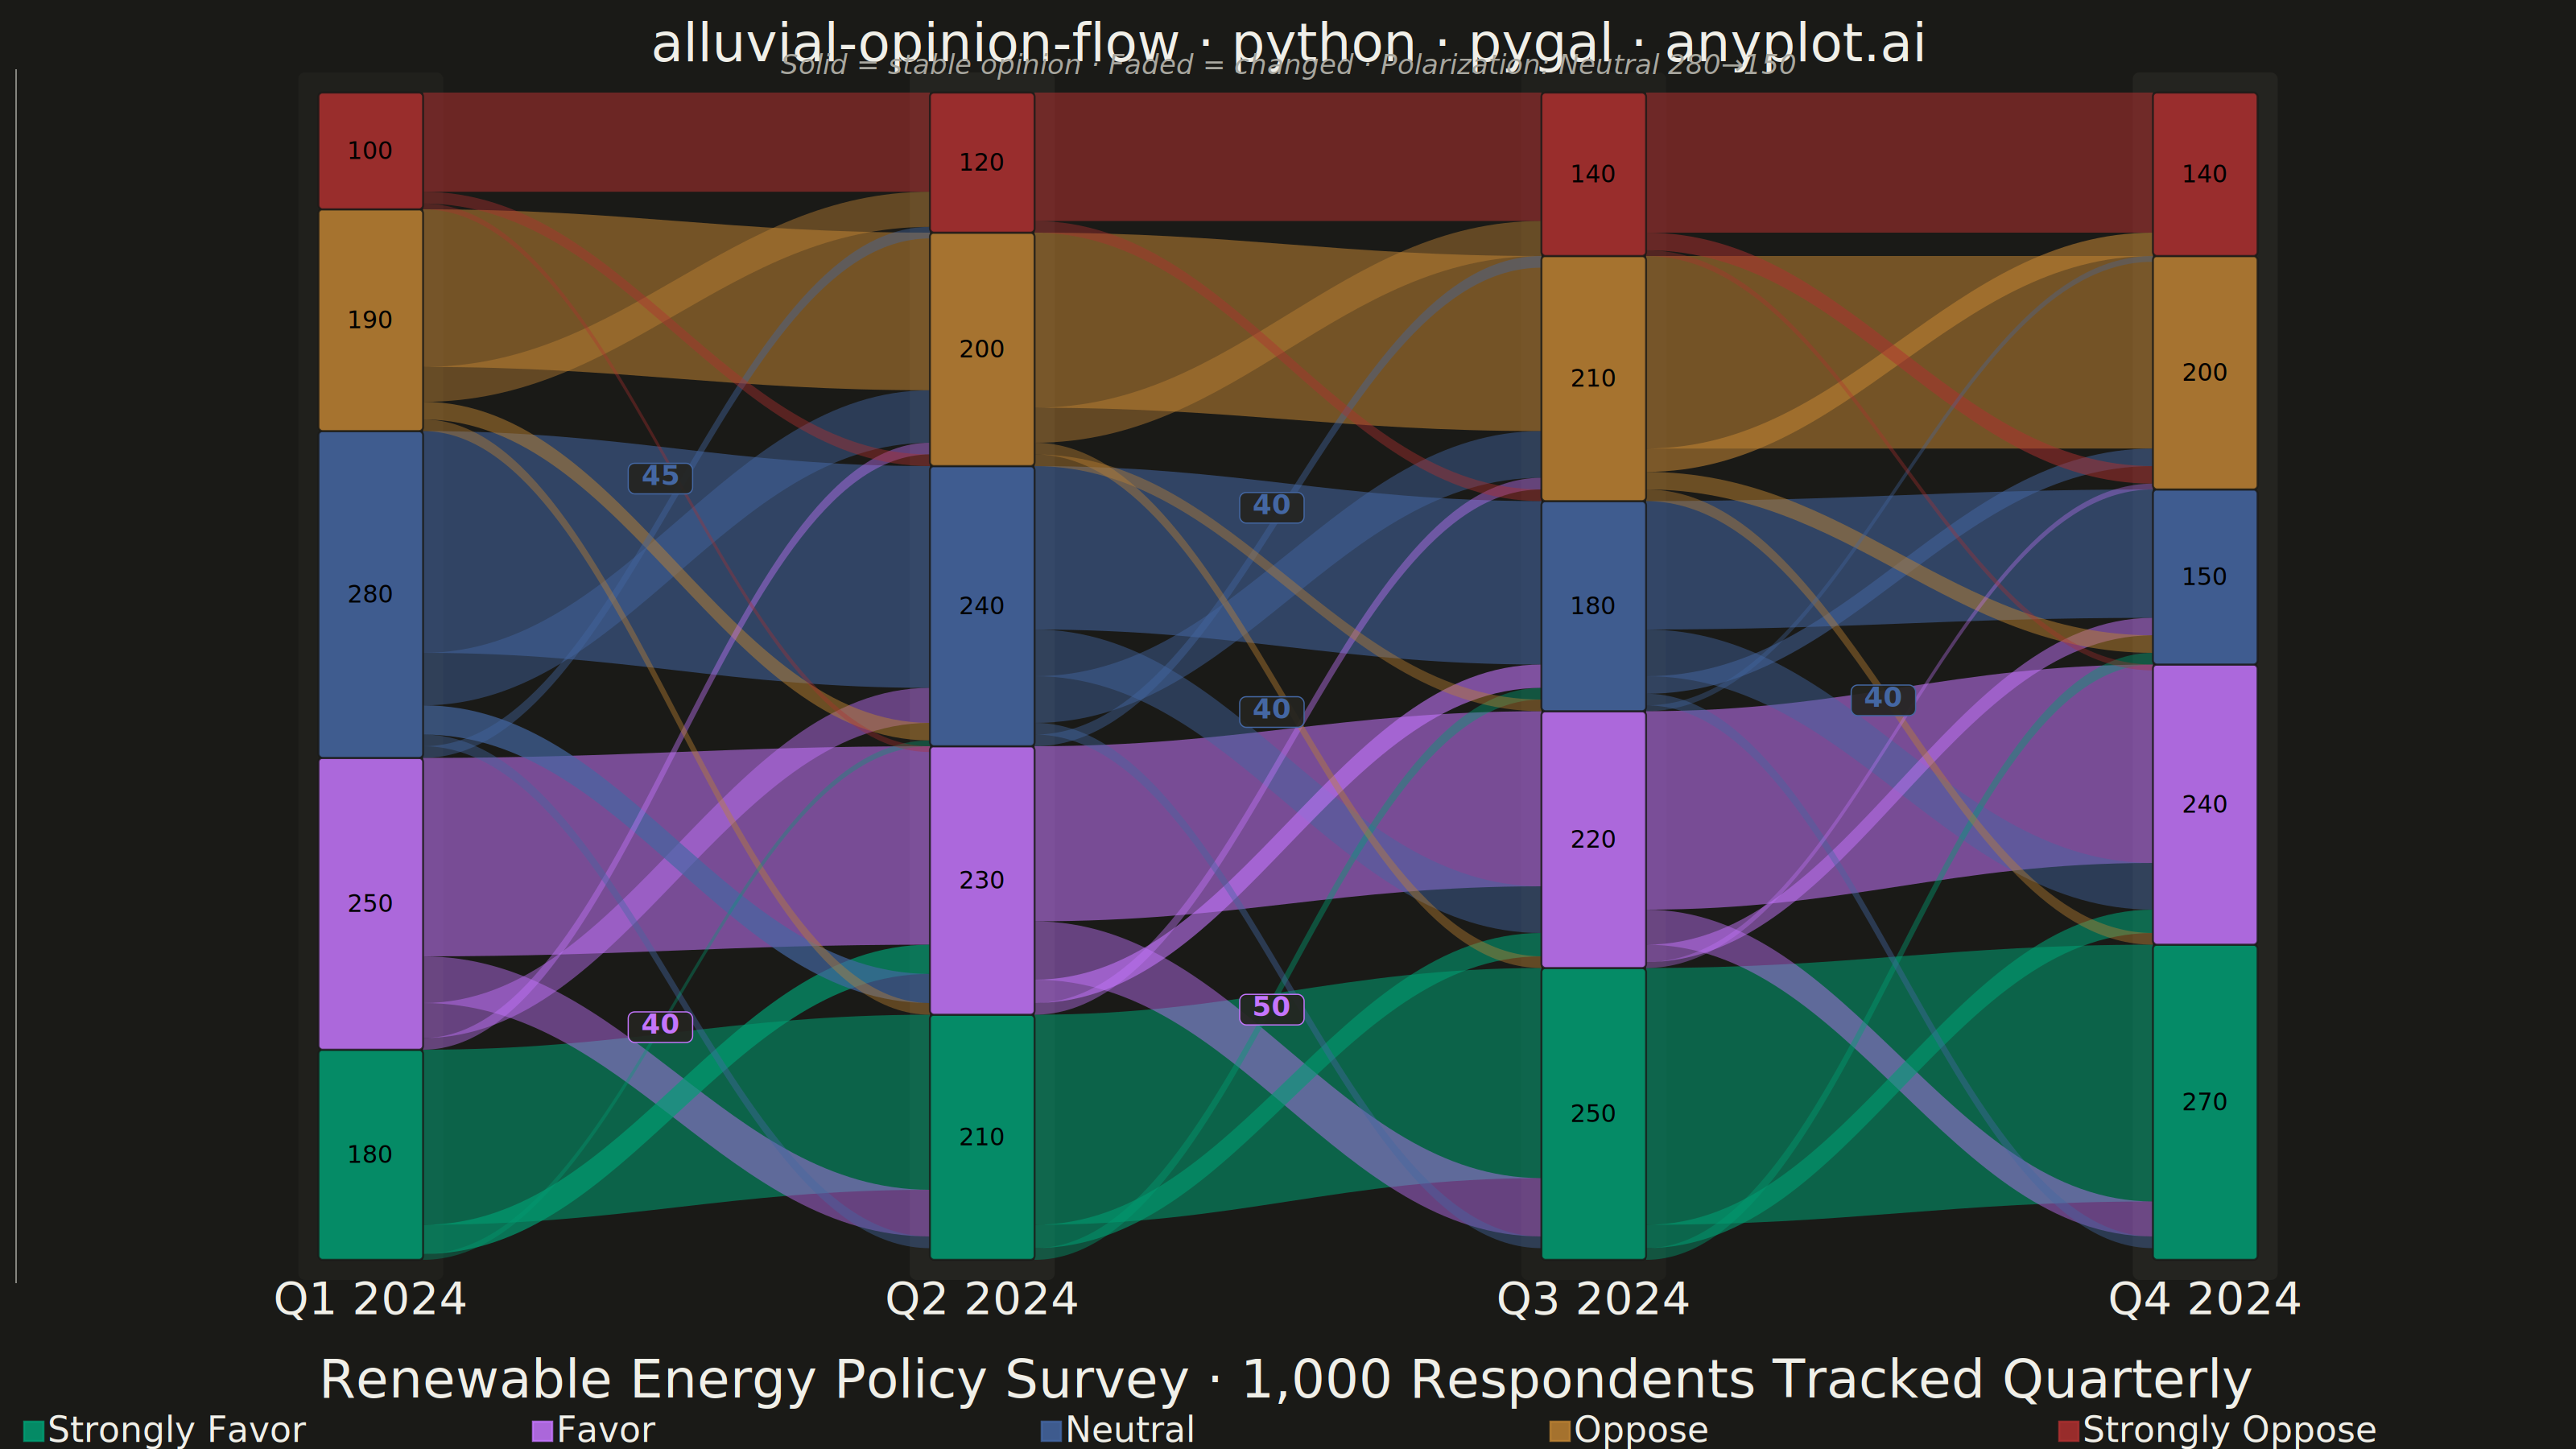
An alluvial/Sankey-style diagram showing how opinions or group memberships shift between survey waves or time periods. Flows connect the same response categories across columns, revealing patterns of opinion change, stability, and polarization. Unlike a basic alluvial diagram, this variant emphasizes distinguishing stable respondents from net changers and displays respondent totals per category at each wave.
""" anyplot.ai
alluvial-opinion-flow: Opinion Flow Diagram
Library: pygal 3.1.0 | Python 3.13.13
Quality: 85/100 | Updated: 2026-05-30
"""

# Ensure we import the installed pygal package, not this file
import importlib.util
import os
import sys
import xml.etree.ElementTree as ET

import cairosvg
import numpy as np


pygal_spec = importlib.util.find_spec("pygal")
if pygal_spec and pygal_spec.origin != __file__:
    import pygal
    from pygal.style import Style
else:
    # Fallback: remove current directory from path temporarily
    cwd = os.getcwd()
    sys.path = [p for p in sys.path if os.path.abspath(p) != cwd]
    try:
        import pygal
        from pygal.style import Style
    finally:
        sys.path.insert(0, cwd)

# Theme-adaptive tokens from the Imprint palette system
THEME = os.getenv("ANYPLOT_THEME", "light")
PAGE_BG = "#FAF8F1" if THEME == "light" else "#1A1A17"
ELEVATED_BG = "#FFFDF6" if THEME == "light" else "#242420"
INK = "#1A1A17" if THEME == "light" else "#F0EFE8"
INK_MUTED = "#6B6A63" if THEME == "light" else "#A8A79F"

# Imprint categorical palette — canonical hybrid-v3 sort order
IMPRINT_PALETTE = (
    "#009E73",  # green    — Strongly Favor (positive semantic anchor)
    "#C475FD",  # lavender — Favor
    "#4467A3",  # blue     — Neutral
    "#BD8233",  # ochre    — Oppose
    "#AE3030",  # matte red — Strongly Oppose (negative semantic anchor)
    "#2ABCCD",
    "#954477",
    "#99B314",
)

np.random.seed(42)

# Survey scenario: Renewable Energy Policy — 1,000 respondents across 4 quarters
waves = ["Q1 2024", "Q2 2024", "Q3 2024", "Q4 2024"]
categories = ["Strongly Favor", "Favor", "Neutral", "Oppose", "Strongly Oppose"]
cat_colors = list(IMPRINT_PALETTE[:5])

# Respondent counts per category at each wave
respondent_counts = np.array(
    [
        [180, 210, 250, 270],  # Strongly Favor
        [250, 230, 220, 240],  # Favor
        [280, 240, 180, 150],  # Neutral
        [190, 200, 210, 200],  # Oppose
        [100, 120, 140, 140],  # Strongly Oppose
    ]
)

# Flow transitions between consecutive waves
flows = [
    # Wave 1 -> Wave 2
    {
        ("Strongly Favor", "Strongly Favor"): 150,
        ("Strongly Favor", "Favor"): 25,
        ("Strongly Favor", "Neutral"): 5,
        ("Favor", "Strongly Favor"): 40,
        ("Favor", "Favor"): 170,
        ("Favor", "Neutral"): 30,
        ("Favor", "Oppose"): 10,
        ("Neutral", "Strongly Favor"): 10,
        ("Neutral", "Favor"): 25,
        ("Neutral", "Neutral"): 190,
        ("Neutral", "Oppose"): 45,
        ("Neutral", "Strongly Oppose"): 10,
        ("Oppose", "Favor"): 10,
        ("Oppose", "Neutral"): 15,
        ("Oppose", "Oppose"): 135,
        ("Oppose", "Strongly Oppose"): 30,
        ("Strongly Oppose", "Neutral"): 5,
        ("Strongly Oppose", "Oppose"): 10,
        ("Strongly Oppose", "Strongly Oppose"): 85,
    },
    # Wave 2 -> Wave 3
    {
        ("Strongly Favor", "Strongly Favor"): 180,
        ("Strongly Favor", "Favor"): 20,
        ("Strongly Favor", "Neutral"): 10,
        ("Favor", "Strongly Favor"): 50,
        ("Favor", "Favor"): 150,
        ("Favor", "Neutral"): 20,
        ("Favor", "Oppose"): 10,
        ("Neutral", "Strongly Favor"): 10,
        ("Neutral", "Favor"): 40,
        ("Neutral", "Neutral"): 140,
        ("Neutral", "Oppose"): 40,
        ("Neutral", "Strongly Oppose"): 10,
        ("Oppose", "Favor"): 10,
        ("Oppose", "Neutral"): 10,
        ("Oppose", "Oppose"): 150,
        ("Oppose", "Strongly Oppose"): 30,
        ("Strongly Oppose", "Oppose"): 10,
        ("Strongly Oppose", "Strongly Oppose"): 110,
    },
    # Wave 3 -> Wave 4
    {
        ("Strongly Favor", "Strongly Favor"): 220,
        ("Strongly Favor", "Favor"): 20,
        ("Strongly Favor", "Neutral"): 10,
        ("Favor", "Strongly Favor"): 30,
        ("Favor", "Favor"): 170,
        ("Favor", "Neutral"): 15,
        ("Favor", "Oppose"): 5,
        ("Neutral", "Strongly Favor"): 10,
        ("Neutral", "Favor"): 40,
        ("Neutral", "Neutral"): 110,
        ("Neutral", "Oppose"): 15,
        ("Neutral", "Strongly Oppose"): 5,
        ("Oppose", "Favor"): 10,
        ("Oppose", "Neutral"): 15,
        ("Oppose", "Oppose"): 165,
        ("Oppose", "Strongly Oppose"): 20,
        ("Strongly Oppose", "Neutral"): 5,
        ("Strongly Oppose", "Oppose"): 15,
        ("Strongly Oppose", "Strongly Oppose"): 120,
    },
]

# Compute top cross-category flows for opacity highlighting
cross_flows_list = []
for flow_dict in flows:
    for (src, tgt), count in flow_dict.items():
        if src != tgt:
            cross_flows_list.append(((src, tgt), count))
cross_flows_list.sort(key=lambda x: -x[1])
highlight_threshold = cross_flows_list[7][1] if len(cross_flows_list) > 7 else 0

# Top cross-category flows for pill labels on the diagram
top_cross_flows = {}
for flow_idx, flow_dict in enumerate(flows):
    for (src, tgt), count in flow_dict.items():
        if src != tgt and count >= 40:
            top_cross_flows[(flow_idx, src, tgt)] = count

# Custom style with Imprint palette and theme-adaptive chrome — 3200×1800 sizing
custom_style = Style(
    background=PAGE_BG,
    plot_background=PAGE_BG,
    foreground=INK,
    foreground_strong=INK,
    foreground_subtle=INK_MUTED,
    opacity=".85",
    opacity_hover=".95",
    transition="200ms ease-in",
    colors=tuple(cat_colors),
    title_font_size=66,
    label_font_size=56,
    major_label_font_size=44,
    legend_font_size=44,
    value_font_size=30,
    value_label_font_size=30,
    stroke_width=2.5,
    font_family="'DejaVu Sans', 'Segoe UI', sans-serif",
    label_font_family="'DejaVu Sans', 'Segoe UI', sans-serif",
    title_font_family="'DejaVu Sans', 'Segoe UI', sans-serif",
    legend_font_family="'DejaVu Sans', 'Segoe UI', sans-serif",
    value_font_family="'DejaVu Sans', 'Segoe UI', sans-serif",
    tooltip_font_size=28,
    tooltip_font_family="'DejaVu Sans', 'Segoe UI', sans-serif",
)

# StackedBar as alluvial node foundation — canonical 3200×1800 landscape canvas
chart = pygal.StackedBar(
    width=3200,
    height=1800,
    style=custom_style,
    title="alluvial-opinion-flow · python · pygal · anyplot.ai",
    x_title="Renewable Energy Policy Survey · 1,000 Respondents Tracked Quarterly",
    show_legend=True,
    legend_at_bottom=True,
    legend_at_bottom_columns=5,
    legend_box_size=24,
    show_y_guides=False,
    show_x_guides=False,
    show_y_labels=False,
    print_values=True,
    print_values_position="center",
    value_formatter=lambda x: f"{int(x)}",
    x_label_rotation=0,
    rounded_bars=5,
    margin_bottom=10,
    margin_top=10,
    tooltip_fancy_mode=True,
    js=[],
)
chart.x_labels = waves

for cat_idx, cat in enumerate(categories):
    chart.add(cat, [{"value": int(v), "label": f"{cat}: {int(v)} respondents"} for v in respondent_counts[cat_idx]])

# Parse SVG for structural post-processing (alluvial flows not natively supported by pygal)
ET.register_namespace("", "http://www.w3.org/2000/svg")
ET.register_namespace("xlink", "http://www.w3.org/1999/xlink")
svg_str = chart.render().decode("utf-8")
root = ET.fromstring(svg_str)
SVG = "{http://www.w3.org/2000/svg}"

# Extract bar positions from rendered SVG structure
bar_info = []  # (series_idx, bar_idx, x, y, w, h, center_x, rect_elem)
for g in root.iter(f"{SVG}g"):
    cls = g.get("class", "")
    if "serie-" not in cls or "series" not in cls:
        continue
    series_idx = None
    for part in cls.split():
        if part.startswith("serie-"):
            series_idx = int(part[6:])
            break
    if series_idx is None:
        continue
    bars_group = None
    for child in g:
        if child.tag == f"{SVG}g" and child.get("class", "") == "bars":
            bars_group = child
            break
    if bars_group is None:
        continue
    bar_idx = 0
    for bar_g in bars_group:
        if bar_g.tag != f"{SVG}g":
            continue
        if "bar" not in bar_g.get("class", ""):
            continue
        rect = bar_g.find(f"{SVG}rect")
        cx_desc = None
        for desc in bar_g.findall(f"{SVG}desc"):
            if desc.get("class") == "x centered":
                cx_desc = desc
                break
        if rect is not None and cx_desc is not None:
            x = float(rect.get("x"))
            y = float(rect.get("y"))
            w = float(rect.get("width"))
            h = float(rect.get("height"))
            cx = float(cx_desc.text)
            bar_info.append((series_idx, bar_idx, x, y, w, h, cx, rect))
        bar_idx += 1

# Narrow bars to alluvial node columns with theme-adaptive separator strokes
NODE_WIDTH = 130
for _si, _bi, _x, _y, _w, _h, cx, rect in bar_info:
    new_x = cx - NODE_WIDTH / 2
    rect.set("x", f"{new_x:.2f}")
    rect.set("width", str(NODE_WIDTH))
    rect.set("stroke", PAGE_BG)
    rect.set("stroke-width", "3")

# Build bar position lookup: (series_idx, wave_idx) -> (y_top, y_bottom, center_x)
bar_positions = {}
for series_idx, bar_idx, _x, y, _w, h, cx, _rect in bar_info:
    bar_positions[(series_idx, bar_idx)] = (y, y + h, cx)

cat_to_series = {cat: idx for idx, cat in enumerate(categories)}

# Collect wave column center-x values and vertical chart extent
wave_cx = {}
for _series_idx, bar_idx, _x, _y, _w, _h, cx, _rect in bar_info:
    if bar_idx not in wave_cx:
        wave_cx[bar_idx] = cx

all_y_top = min(y for _, _, _, y, _, h, _, _ in bar_info)
all_y_bottom = max(y + h for _, _, _, y, _, h, _, _ in bar_info)

# Locate the SVG plot group for flow and background insertion
plot_group = None
first_series_pos = 0
for g in root.iter(f"{SVG}g"):
    cls = g.get("class", "")
    if cls == "plot":
        for idx, child in enumerate(g):
            if child.get("class", "").startswith("series serie-0"):
                plot_group = g
                first_series_pos = idx
                break
    if plot_group is not None:
        break

# Wave column background panels — subtle alternating shading, theme-adaptive
PANEL_A = "#F0EDE6" if THEME == "light" else "#242420"
PANEL_B = "#E8E5DE" if THEME == "light" else "#2A2A26"
bg_group = ET.Element(f"{SVG}g")
bg_group.set("id", "wave-backgrounds")
panel_padding = 25
for wi, cx in sorted(wave_cx.items()):
    bg_rect = ET.SubElement(bg_group, f"{SVG}rect")
    bg_rect.set("x", f"{cx - NODE_WIDTH / 2 - panel_padding:.1f}")
    bg_rect.set("y", f"{all_y_top - panel_padding:.1f}")
    bg_rect.set("width", f"{NODE_WIDTH + 2 * panel_padding}")
    bg_rect.set("height", f"{all_y_bottom - all_y_top + 2 * panel_padding:.1f}")
    bg_rect.set("rx", "8")
    bg_rect.set("ry", "8")
    bg_rect.set("fill", PANEL_A if wi % 2 == 0 else PANEL_B)
    bg_rect.set("fill-opacity", "0.65")
    bg_rect.set("stroke", "none")

if plot_group is not None:
    plot_group.insert(first_series_pos, bg_group)
    first_series_pos += 1

# Build alluvial flow paths between consecutive wave columns
flow_group = ET.Element(f"{SVG}g")
flow_group.set("id", "alluvial-flows")

flow_label_positions = []

for flow_idx, flow_dict in enumerate(flows):
    source_offsets = {}
    target_offsets = {}
    for cat_idx in range(len(categories)):
        src_pos = bar_positions.get((cat_idx, flow_idx))
        if src_pos:
            source_offsets[cat_idx] = src_pos[0]
        tgt_pos = bar_positions.get((cat_idx, flow_idx + 1))
        if tgt_pos:
            target_offsets[cat_idx] = tgt_pos[0]

    for (src_cat, tgt_cat), count in sorted(flow_dict.items(), key=lambda x: -x[1]):
        if count <= 0:
            continue

        src_idx = cat_to_series[src_cat]
        tgt_idx = cat_to_series[tgt_cat]

        src_bar = bar_positions.get((src_idx, flow_idx))
        tgt_bar = bar_positions.get((tgt_idx, flow_idx + 1))
        if not src_bar or not tgt_bar:
            continue

        src_total = respondent_counts[src_idx, flow_idx]
        tgt_total = respondent_counts[tgt_idx, flow_idx + 1]
        src_bar_h = src_bar[1] - src_bar[0]
        tgt_bar_h = tgt_bar[1] - tgt_bar[0]

        src_frac_h = (count / src_total) * src_bar_h
        tgt_frac_h = (count / tgt_total) * tgt_bar_h

        y0_top = source_offsets[src_idx]
        y0_bottom = y0_top + src_frac_h
        y1_top = target_offsets[tgt_idx]
        y1_bottom = y1_top + tgt_frac_h

        band_x0 = src_bar[2] + NODE_WIDTH / 2
        band_x1 = tgt_bar[2] - NODE_WIDTH / 2
        cx0 = band_x0 + 0.4 * (band_x1 - band_x0)
        cx1 = band_x0 + 0.6 * (band_x1 - band_x0)

        is_stable = src_cat == tgt_cat
        if is_stable:
            opacity = 0.55
        elif count >= highlight_threshold:
            opacity = 0.45
        else:
            # Raise minimum opacity so small flows (5-10 respondents) remain perceptible
            opacity = max(0.35, 0.25 + count / 60.0)

        path_d = (
            f"M {band_x0:.1f},{y0_top:.1f} "
            f"C {cx0:.1f},{y0_top:.1f} {cx1:.1f},{y1_top:.1f} {band_x1:.1f},{y1_top:.1f} "
            f"L {band_x1:.1f},{y1_bottom:.1f} "
            f"C {cx1:.1f},{y1_bottom:.1f} {cx0:.1f},{y0_bottom:.1f} {band_x0:.1f},{y0_bottom:.1f} "
            f"Z"
        )

        path_elem = ET.SubElement(flow_group, f"{SVG}path")
        path_elem.set("d", path_d)
        path_elem.set("fill", cat_colors[src_idx])
        path_elem.set("fill-opacity", str(round(opacity, 2)))
        path_elem.set("stroke", "none")

        if (flow_idx, src_cat, tgt_cat) in top_cross_flows:
            mid_x = (band_x0 + band_x1) / 2
            mid_y = (y0_top + y0_bottom + y1_top + y1_bottom) / 4
            flow_label_positions.append((mid_x, mid_y, count, src_idx))

        source_offsets[src_idx] = y0_bottom
        target_offsets[tgt_idx] = y1_bottom

# Insert flows before series groups so node bars render on top
if plot_group is not None:
    plot_group.insert(first_series_pos, flow_group)

# Pill labels on largest cross-category transitions for data storytelling
label_group = ET.SubElement(root, f"{SVG}g")
label_group.set("id", "flow-labels")
for mid_x, mid_y, count, src_idx in flow_label_positions:
    pill_w, pill_h = 80, 38
    pill = ET.SubElement(label_group, f"{SVG}rect")
    pill.set("x", f"{mid_x - pill_w / 2:.1f}")
    pill.set("y", f"{mid_y - pill_h / 2:.1f}")
    pill.set("width", str(pill_w))
    pill.set("height", str(pill_h))
    pill.set("rx", "8")
    pill.set("ry", "8")
    pill.set("fill", ELEVATED_BG)
    pill.set("fill-opacity", "0.92")
    pill.set("stroke", cat_colors[src_idx])
    pill.set("stroke-width", "1.5")

    label = ET.SubElement(label_group, f"{SVG}text")
    label.set("x", f"{mid_x:.1f}")
    label.set("y", f"{mid_y + 8:.1f}")
    label.set("text-anchor", "middle")
    label.set("font-size", "34")
    label.set("font-weight", "bold")
    label.set("font-family", "'DejaVu Sans', 'Segoe UI', sans-serif")
    label.set("fill", cat_colors[src_idx])
    label.text = str(count)

# Subtitle annotation highlighting the polarization data story
anno_group = ET.SubElement(root, f"{SVG}g")
anno_group.set("id", "annotations")
annotation = ET.SubElement(anno_group, f"{SVG}text")
annotation.set("x", "1600")
annotation.set("y", "92")
annotation.set("text-anchor", "middle")
annotation.set("font-size", "34")
annotation.set("font-style", "italic")
annotation.set("font-family", "'DejaVu Sans', 'Segoe UI', sans-serif")
annotation.set("fill", INK_MUTED)
annotation.text = "Solid = stable opinion · Faded = changed · Polarization: Neutral 280→150"

# Serialize modified SVG
svg_str = ET.tostring(root, encoding="unicode")

# Save PNG — canonical 3200×1800 via cairosvg (1:1 from SVG viewport)
cairosvg.svg2png(bytestring=svg_str.encode("utf-8"), write_to=f"plot-{THEME}.png")

# Save interactive HTML with embedded SVG
html_content = f"""<!DOCTYPE html>
<html lang="en">
<head>
    <meta charset="utf-8">
    <title>alluvial-opinion-flow · python · pygal · anyplot.ai</title>
    <style>
        body {{ margin: 0; padding: 20px; background: {PAGE_BG}; font-family: sans-serif; }}
        .container {{ max-width: 100%; margin: 0 auto; }}
        svg {{ width: 100%; height: auto; }}
    </style>
</head>
<body>
    <div class="container">
        {svg_str}
    </div>
</body>
</html>"""

with open(f"plot-{THEME}.html", "w", encoding="utf-8") as f:
    f.write(html_content)
Runnable source as JSON, for any HTTP client: https://api.anyplot.ai/specs/alluvial-opinion-flow/pygal/code. Any spec id and library id listed in llms-full.txt fit the same URL shape; every URL below is complete and callable.
{
  "spec_id": "alluvial-opinion-flow",
  "language": "python",
  "library": "pygal",
  "page": "https://anyplot.ai/alluvial-opinion-flow/python/pygal",
  "hub": "https://anyplot.ai/alluvial-opinion-flow",
  "code_json": "https://api.anyplot.ai/specs/alluvial-opinion-flow/pygal/code",
  "spec_json": "https://api.anyplot.ai/specs/alluvial-opinion-flow",
  "render_light_png": "https://storage.googleapis.com/anyplot-images/plots/alluvial-opinion-flow/python/pygal/plot-light.png",
  "render_dark_png": "https://storage.googleapis.com/anyplot-images/plots/alluvial-opinion-flow/python/pygal/plot-dark.png",
  "interactive_light_html": "https://storage.googleapis.com/anyplot-images/plots/alluvial-opinion-flow/python/pygal/plot-light.html",
  "interactive_dark_html": "https://storage.googleapis.com/anyplot-images/plots/alluvial-opinion-flow/python/pygal/plot-dark.html",
  "quality_score": 85.0,
  "license": "MIT",
  "guide": "https://anyplot.ai/llms.txt"
}
Part of Opinion Flow Diagram on anyplot.ai.