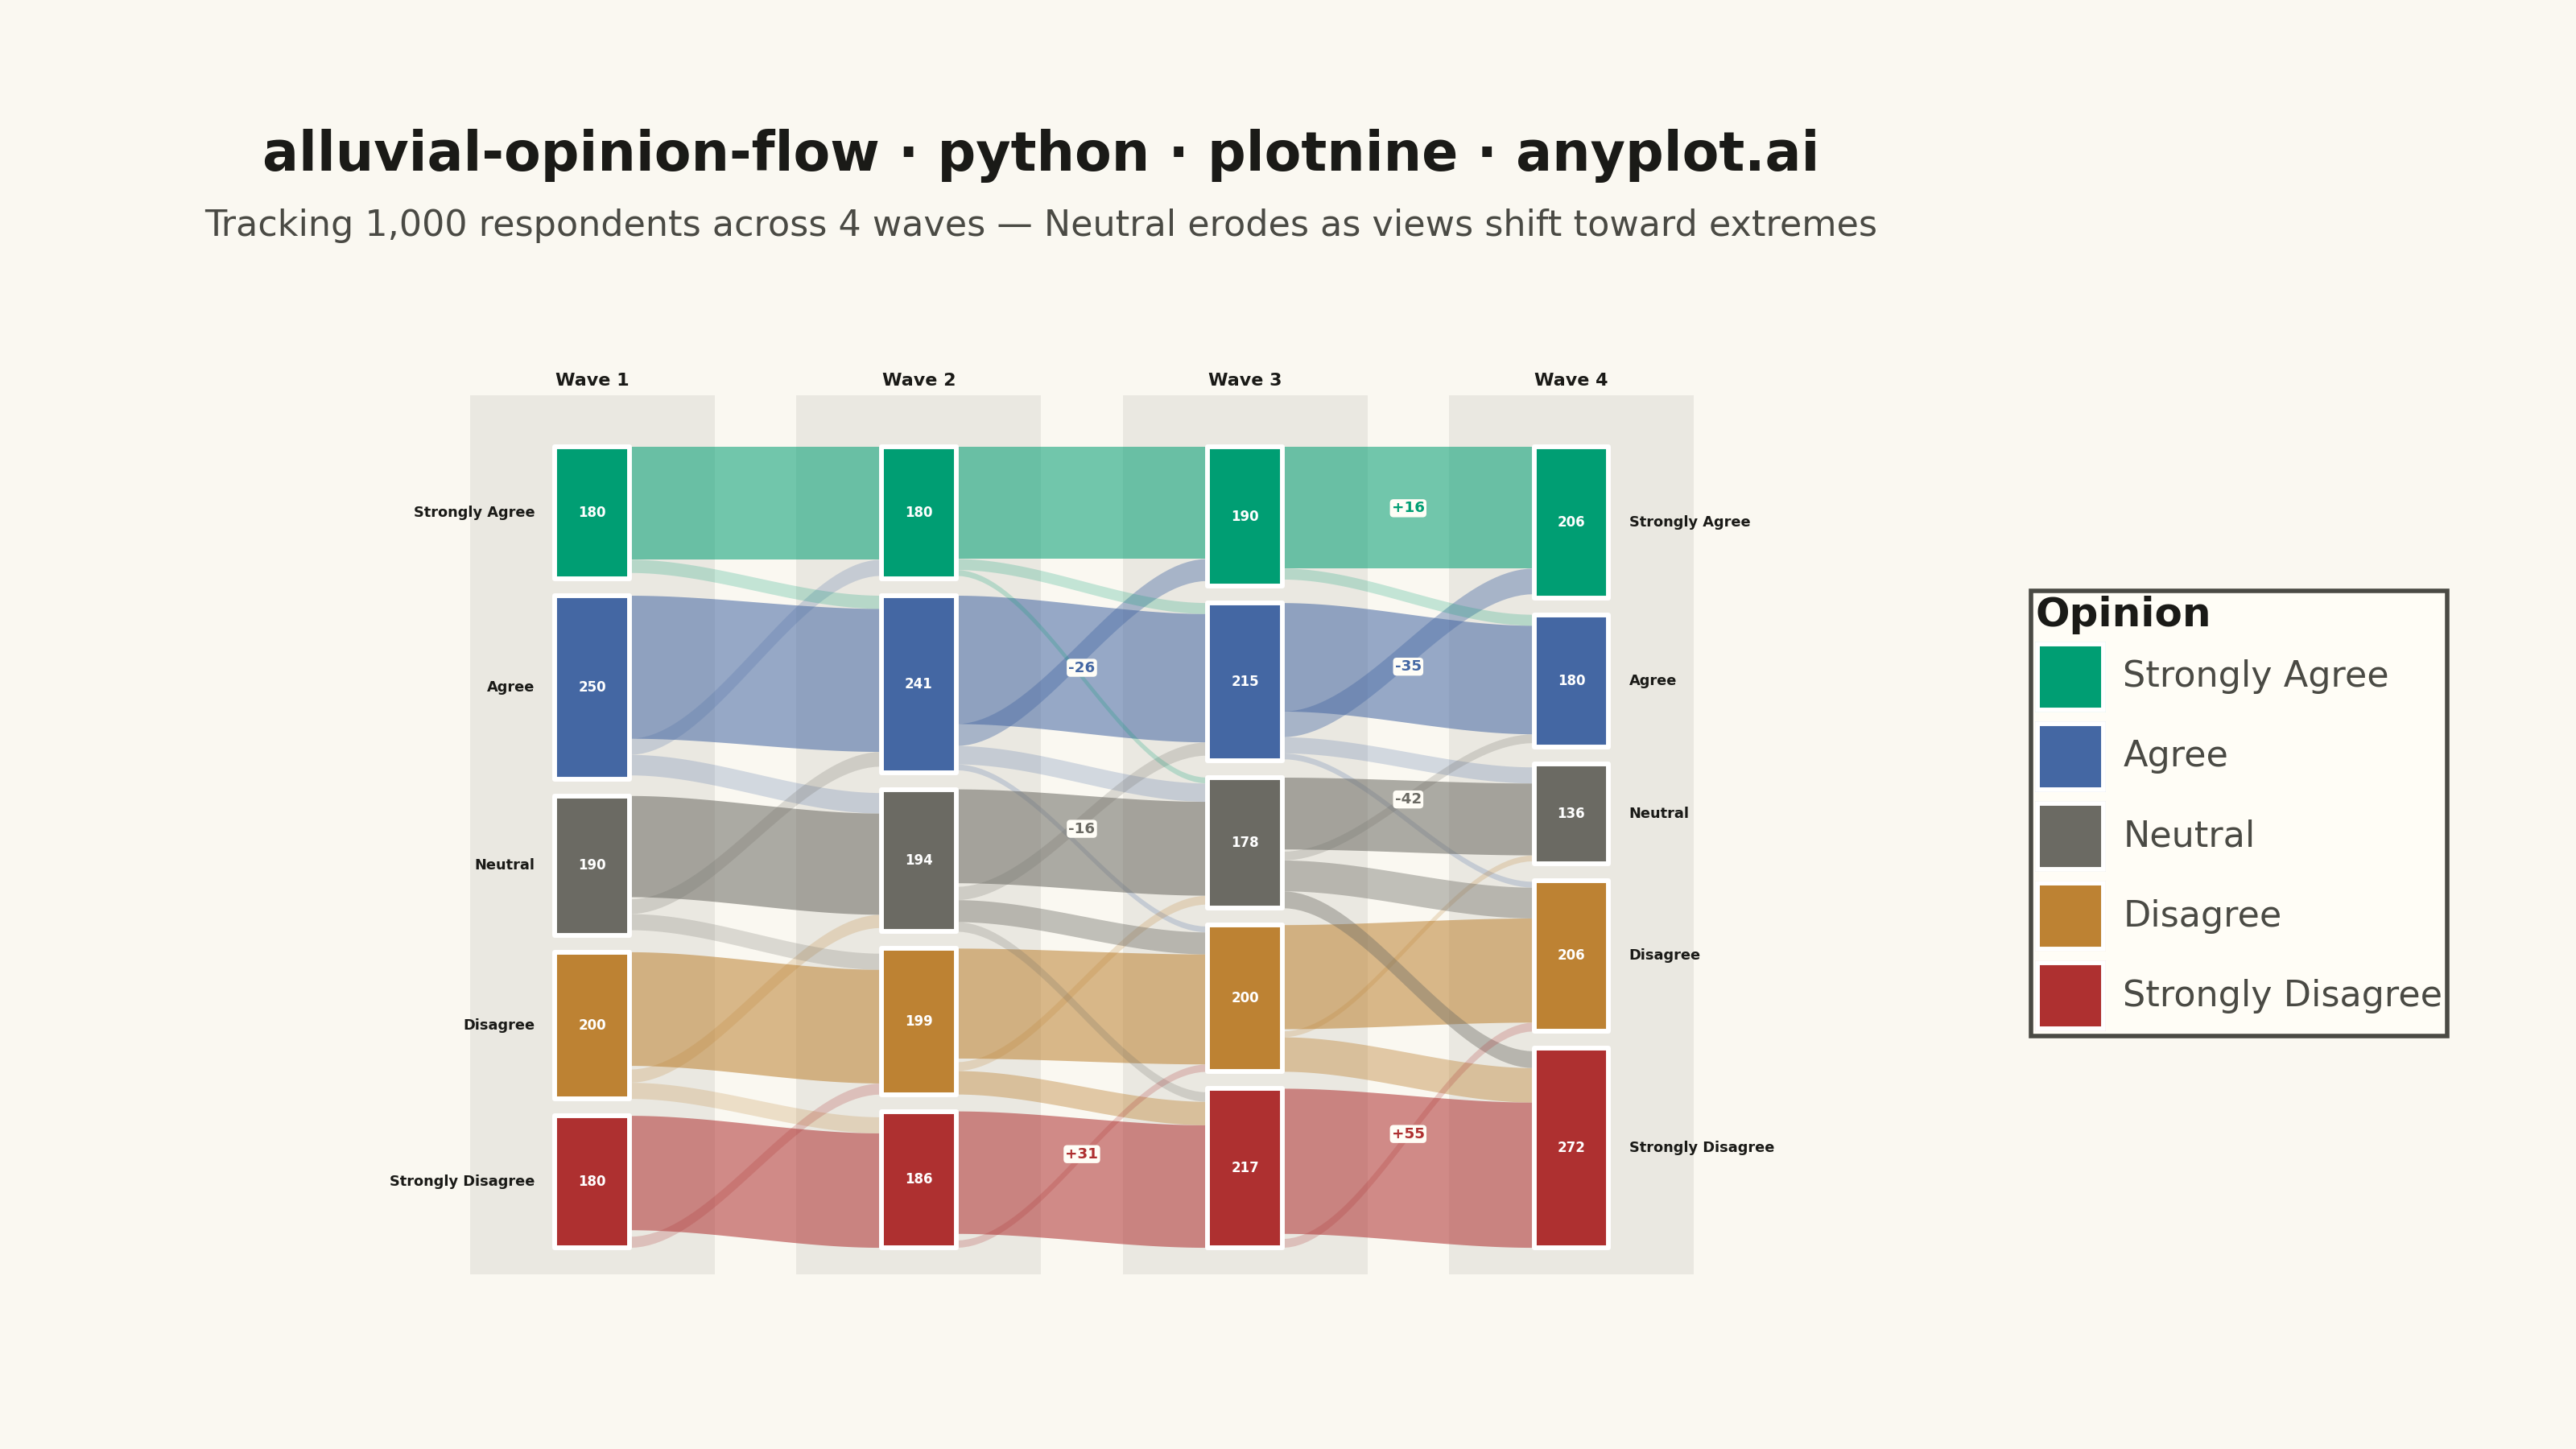
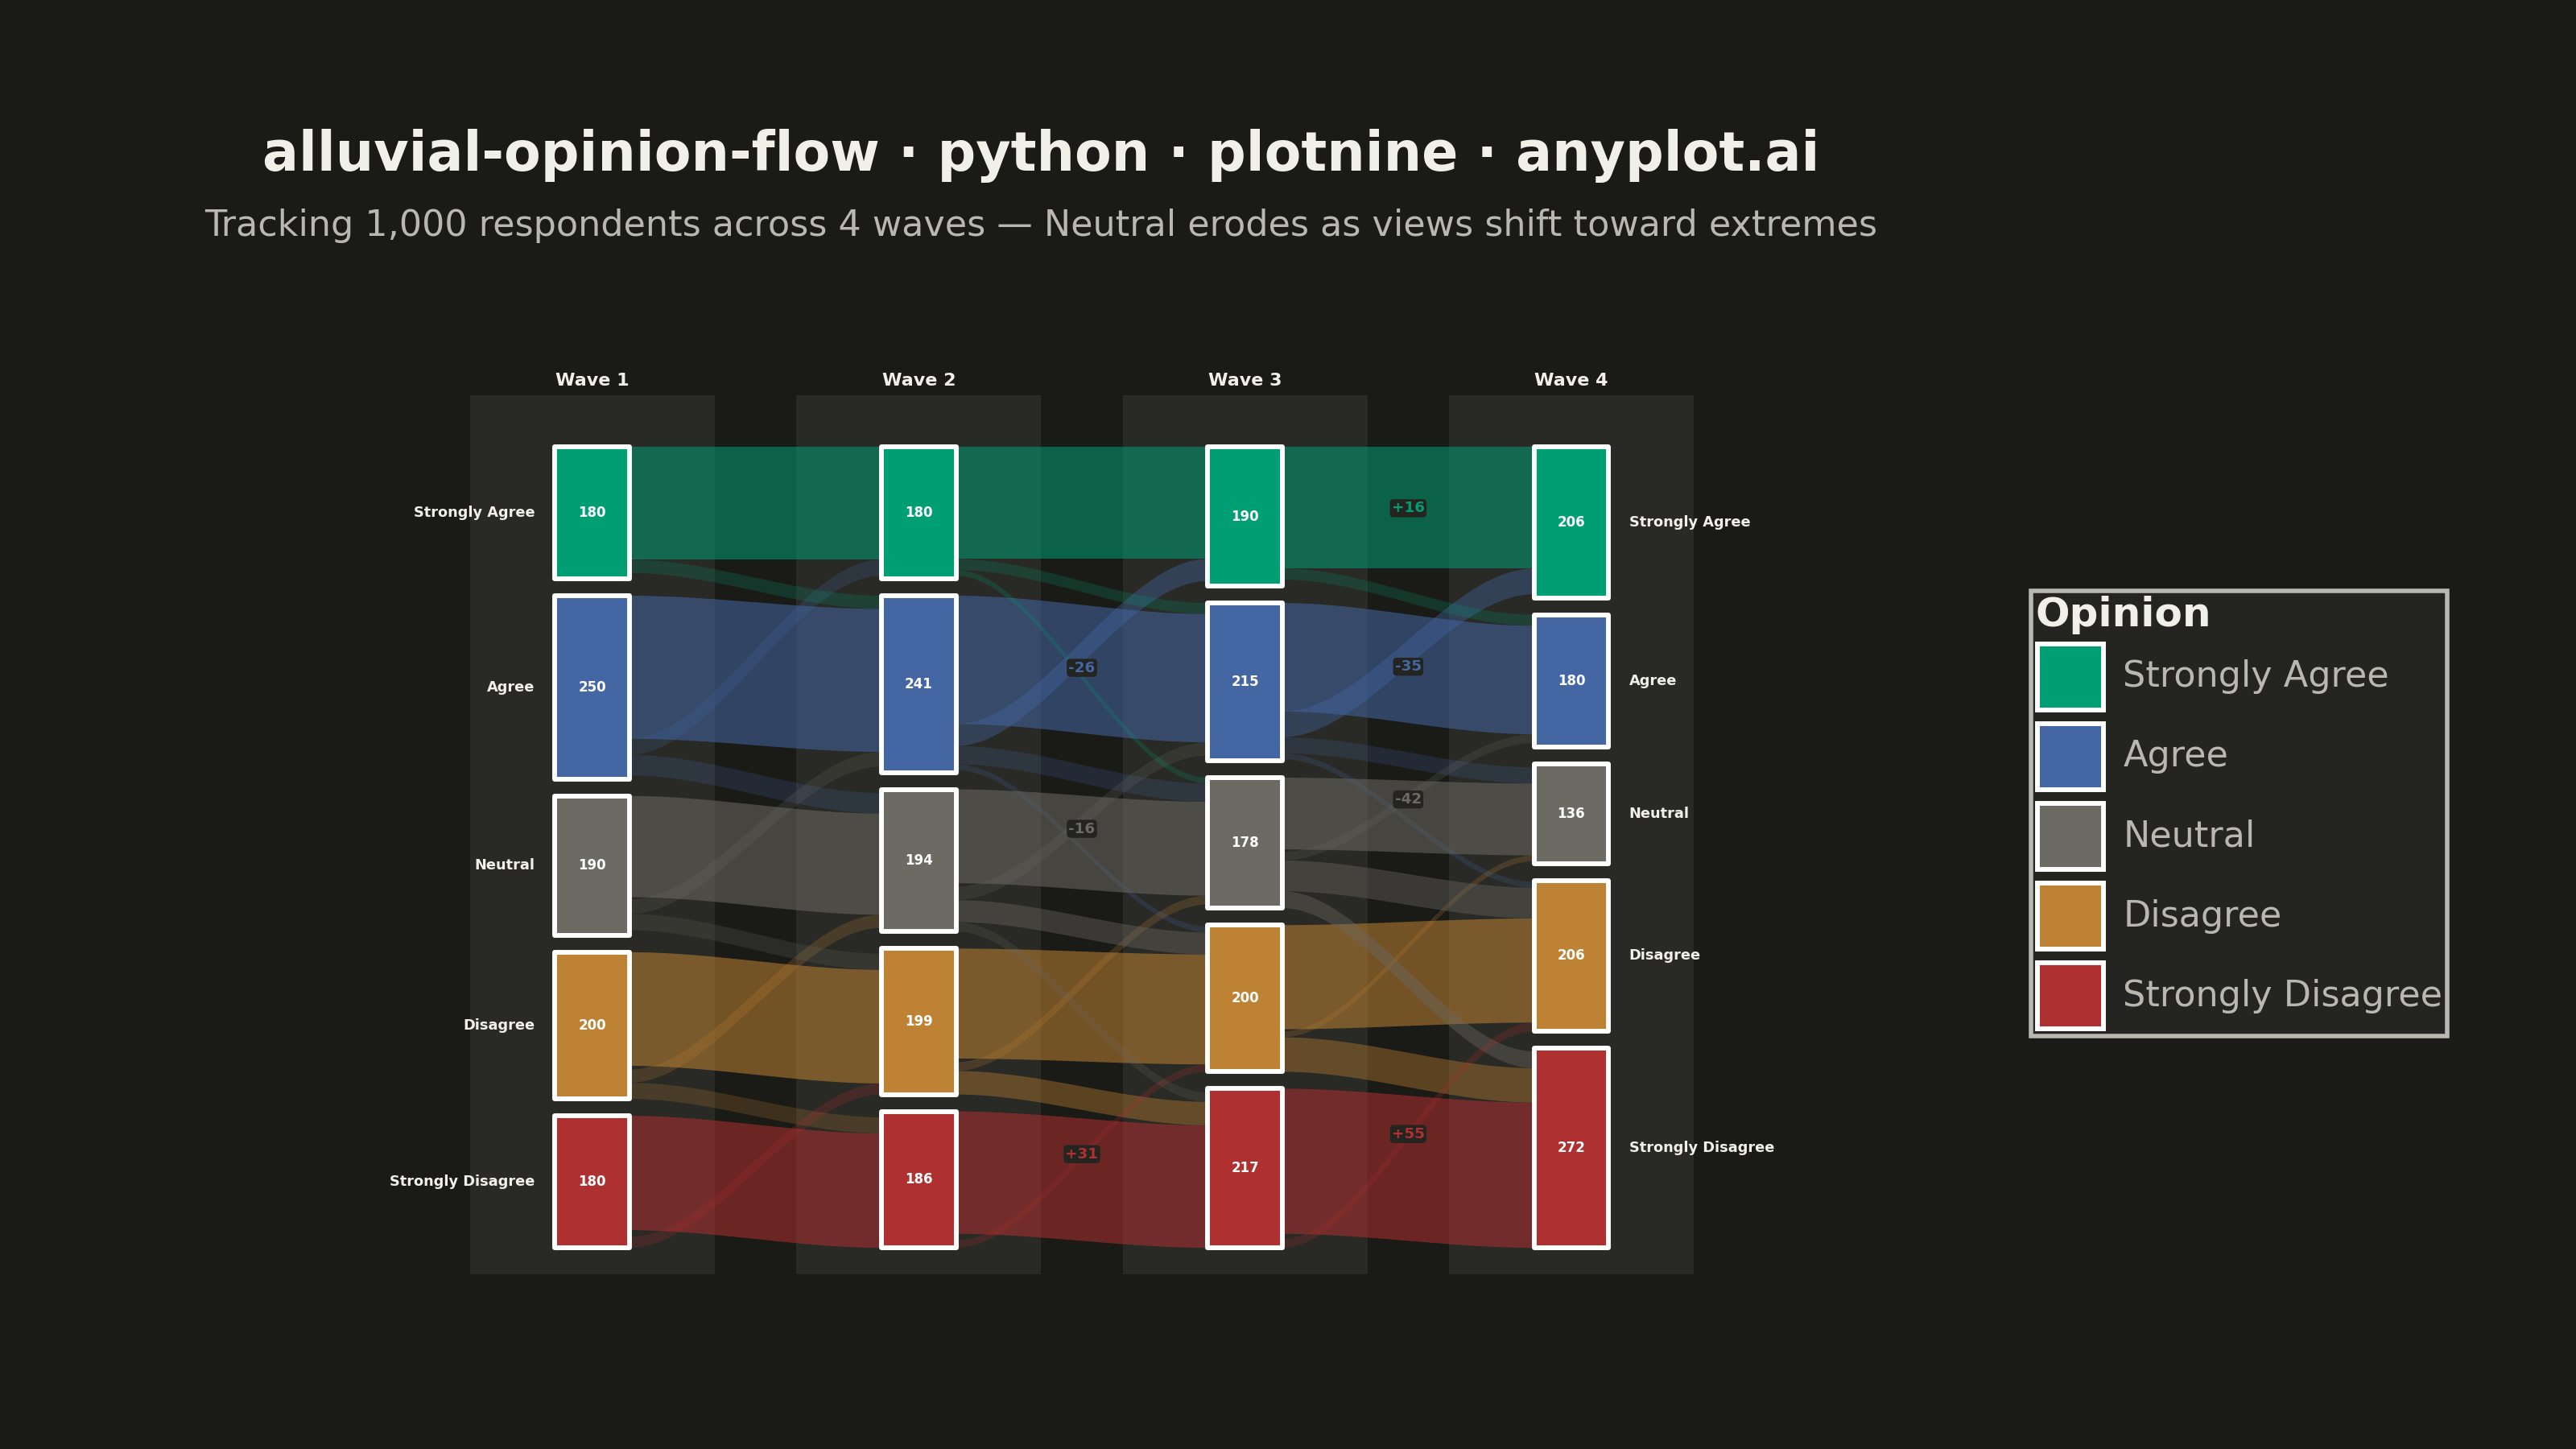
An alluvial/Sankey-style diagram showing how opinions or group memberships shift between survey waves or time periods. Flows connect the same response categories across columns, revealing patterns of opinion change, stability, and polarization. Unlike a basic alluvial diagram, this variant emphasizes distinguishing stable respondents from net changers and displays respondent totals per category at each wave.
""" anyplot.ai
alluvial-opinion-flow: Opinion Flow Diagram
Library: plotnine 0.15.4 | Python 3.13.13
Quality: 89/100 | Updated: 2026-05-30
"""

import os
import sys


sys.path = [p for p in sys.path if "implementations" not in p]

import numpy as np
import pandas as pd
from plotnine import (
    aes,
    annotate,
    coord_cartesian,
    element_blank,
    element_rect,
    element_text,
    geom_label,
    geom_rect,
    geom_ribbon,
    geom_text,
    ggplot,
    guide_legend,
    guides,
    labs,
    scale_alpha_identity,
    scale_color_manual,
    scale_fill_manual,
    theme,
    theme_minimal,
)


# Theme tokens (Imprint palette + theme-adaptive chrome)
THEME = os.getenv("ANYPLOT_THEME", "light")
PAGE_BG = "#FAF8F1" if THEME == "light" else "#1A1A17"
ELEVATED_BG = "#FFFDF6" if THEME == "light" else "#242420"
INK = "#1A1A17" if THEME == "light" else "#F0EFE8"
INK_SOFT = "#4A4A44" if THEME == "light" else "#B8B7B0"

# Imprint palette — semantic mapping for opinion scale (positive → neutral → negative)
categories = ["Strongly Agree", "Agree", "Neutral", "Disagree", "Strongly Disagree"]
cat_colors = {
    "Strongly Agree": "#009E73",  # brand green — positive
    "Agree": "#4467A3",  # blue — somewhat positive
    "Neutral": "#6B6A63",  # warm gray — neutral (Imprint muted, light value)
    "Disagree": "#BD8233",  # ochre — somewhat negative
    "Strongly Disagree": "#AE3030",  # matte red — negative
}
cat_order = {cat: i for i, cat in enumerate(categories)}
wave_labels = ["Wave 1", "Wave 2", "Wave 3", "Wave 4"]

# Data — opinion survey tracking 1000 respondents across 4 waves
# Gradual shift: moderate positions erode toward extremes
m12 = np.array([[154, 18, 5, 2, 1], [22, 195, 28, 5, 0], [3, 20, 138, 22, 7], [0, 5, 18, 155, 22], [1, 3, 5, 15, 156]])
m23 = np.array([[153, 15, 8, 2, 2], [30, 175, 25, 8, 3], [5, 18, 128, 30, 13], [0, 5, 12, 150, 32], [2, 2, 5, 10, 167]])
m34 = np.array([[166, 15, 5, 2, 2], [35, 148, 22, 8, 2], [3, 12, 98, 42, 23], [0, 3, 8, 142, 47], [2, 2, 3, 12, 198]])

rows = []
for matrix, (fw, tw) in zip([m12, m23, m34], [(0, 1), (1, 2), (2, 3)], strict=True):
    for i, from_cat in enumerate(categories):
        for j, to_cat in enumerate(categories):
            count = int(matrix[i, j])
            if count > 0:
                rows.append(
                    {
                        "from_wave": fw,
                        "to_wave": tw,
                        "from_cat": from_cat,
                        "to_cat": to_cat,
                        "count": count,
                        "is_stable": i == j,
                    }
                )

transitions = pd.DataFrame(rows)
transitions["from_ord"] = transitions["from_cat"].map(cat_order)
transitions["to_ord"] = transitions["to_cat"].map(cat_order)
transitions = transitions.sort_values(
    ["from_wave", "from_ord", "is_stable", "to_ord"], ascending=[True, True, False, True]
).reset_index(drop=True)

# Layout parameters
x_positions = {0: 0.14, 1: 0.38, 2: 0.62, 3: 0.86}
node_width = 0.055
node_gap = 0.018
total_height = 0.78
y_start = 0.88

# Node positions
node_positions = {}
for w in range(4):
    if w == 0:
        totals = transitions[transitions["from_wave"] == 0].groupby("from_cat")["count"].sum()
    else:
        totals = transitions[transitions["to_wave"] == w].groupby("to_cat")["count"].sum()
    total_n = totals.sum()
    current_y = y_start
    for cat in categories:
        n = totals.get(cat, 0)
        height = (n / total_n) * total_height
        node_positions[(w, cat)] = {
            "x": x_positions[w],
            "y_top": current_y,
            "y_bottom": current_y - height,
            "height": height,
            "count": int(n),
            "offset_out": 0.0,
            "offset_in": 0.0,
        }
        current_y -= height + node_gap

# Node rectangles
node_data = []
for (w, cat), pos in node_positions.items():
    node_data.append(
        {
            "wave": w,
            "category": cat,
            "xmin": pos["x"] - node_width / 2,
            "xmax": pos["x"] + node_width / 2,
            "ymin": pos["y_bottom"],
            "ymax": pos["y_top"],
            "label_x": pos["x"],
            "label_y": (pos["y_top"] + pos["y_bottom"]) / 2,
            "count": pos["count"],
        }
    )
nodes_df = pd.DataFrame(node_data)

# Net flows between categories per wave pair for highlighting
net_flows = {}
for _, row in transitions[~transitions["is_stable"]].iterrows():
    fw, tw = row["from_wave"], row["to_wave"]
    fc, tc = row["from_cat"], row["to_cat"]
    key = (fw, tw, min(fc, tc), max(fc, tc))
    direction = 1 if fc < tc else -1
    net_flows[key] = net_flows.get(key, 0) + direction * row["count"]

# Flow ribbons — min_flow=8 reduces visual density in the middle region
flow_polys = []
min_flow = 8

for _, row in transitions.iterrows():
    fw, tw = row["from_wave"], row["to_wave"]
    fc, tc = row["from_cat"], row["to_cat"]
    count = row["count"]
    is_stable = row["is_stable"]

    src = node_positions[(fw, fc)]
    tgt = node_positions[(tw, tc)]

    src_total = transitions[(transitions["from_wave"] == fw) & (transitions["from_cat"] == fc)]["count"].sum()
    fh_src = (count / src_total) * src["height"] if src_total > 0 else 0
    tgt_total = transitions[(transitions["to_wave"] == tw) & (transitions["to_cat"] == tc)]["count"].sum()
    fh_tgt = (count / tgt_total) * tgt["height"] if tgt_total > 0 else 0

    if count < min_flow:
        src["offset_out"] += fh_src
        tgt["offset_in"] += fh_tgt
        continue

    src_y_top = src["y_top"] - src["offset_out"]
    src_y_bottom = src_y_top - fh_src
    src["offset_out"] += fh_src

    tgt_y_top = tgt["y_top"] - tgt["offset_in"]
    tgt_y_bottom = tgt_y_top - fh_tgt
    tgt["offset_in"] += fh_tgt

    if is_stable:
        alpha = 0.55
    else:
        key = (fw, tw, min(fc, tc), max(fc, tc))
        net_mag = abs(net_flows.get(key, 0))
        is_dominant = (fc < tc and net_flows.get(key, 0) > 0) or (fc > tc and net_flows.get(key, 0) < 0)
        alpha = 0.40 if (is_dominant and net_mag > 10) else 0.22

    x_left = x_positions[fw] + node_width / 2
    x_right = x_positions[tw] - node_width / 2
    n_pts = 40
    t_param = np.linspace(0, 1, n_pts)
    x_vals = x_left + (x_right - x_left) * t_param
    y_top_curve = src_y_top + (tgt_y_top - src_y_top) * (3 * t_param**2 - 2 * t_param**3)
    y_bot_curve = src_y_bottom + (tgt_y_bottom - src_y_bottom) * (3 * t_param**2 - 2 * t_param**3)

    flow_id = f"{fw}_{tw}_{fc}_{tc}"
    for k in range(n_pts):
        flow_polys.append(
            {
                "x": x_vals[k],
                "ymin": y_bot_curve[k],
                "ymax": y_top_curve[k],
                "flow_id": flow_id,
                "from_cat": fc,
                "alpha": alpha,
            }
        )

flows_df = pd.DataFrame(flow_polys)

# Delta labels for significant wave-over-wave category size changes
wave_changes = []
for w in range(3):
    for cat in categories:
        n_from = node_positions[(w, cat)]["count"]
        n_to = node_positions[(w + 1, cat)]["count"]
        delta = n_to - n_from
        if abs(delta) >= 15:
            mid_x = (x_positions[w] + x_positions[w + 1]) / 2
            tgt_mid = (node_positions[(w + 1, cat)]["y_top"] + node_positions[(w + 1, cat)]["y_bottom"]) / 2
            wave_changes.append(
                {
                    "x": mid_x,
                    "y": tgt_mid + 0.015,
                    "category": cat,
                    "delta": delta,
                    "label": f"{'+' if delta > 0 else ''}{delta}",
                }
            )
changes_df = pd.DataFrame(wave_changes)

# Background column bands — subtle INK overlay for visual framing
band_data = [
    {"xmin": x_positions[w] - 0.09, "xmax": x_positions[w] + 0.09, "ymin": 0.0, "ymax": 0.935} for w in range(4)
]
bands_df = pd.DataFrame(band_data)

# Plot
title = "alluvial-opinion-flow · python · plotnine · anyplot.ai"
subtitle = "Tracking 1,000 respondents across 4 waves — Neutral erodes as views shift toward extremes"

plot = (
    ggplot()
    + geom_rect(
        bands_df,
        aes(xmin="xmin", xmax="xmax", ymin="ymin", ymax="ymax"),
        fill=INK,
        alpha=0.07,
        color=None,
        inherit_aes=False,
        show_legend=False,
    )
    + geom_ribbon(
        flows_df, aes(x="x", ymin="ymin", ymax="ymax", group="flow_id", fill="from_cat", alpha="alpha"), color=None
    )
    + scale_alpha_identity()
    + geom_rect(
        nodes_df, aes(xmin="xmin", xmax="xmax", ymin="ymin", ymax="ymax", fill="category"), color="white", size=0.6
    )
    + geom_text(
        nodes_df,
        aes(x="label_x", y="label_y", label="count"),
        ha="center",
        va="center",
        size=3.0,
        color="white",
        fontweight="bold",
    )
    + geom_label(
        changes_df,
        aes(x="x", y="y", label="label", color="category"),
        size=3.3,
        fontweight="bold",
        va="center",
        ha="center",
        show_legend=False,
        fill=ELEVATED_BG,
        label_size=0,
        label_padding=0.12,
    )
    + scale_fill_manual(values=cat_colors, name="Opinion", breaks=categories)
    + scale_color_manual(values=cat_colors)
    + guides(fill=guide_legend(override_aes={"alpha": 1}), color=None)
    + labs(title=title, subtitle=subtitle, x="", y="")
    + coord_cartesian(xlim=(-0.14, 1.08), ylim=(0.0, 0.98))
    + theme_minimal()
    + theme(
        figure_size=(8, 4.5),
        plot_background=element_rect(fill=PAGE_BG, color=PAGE_BG),
        panel_background=element_rect(fill=PAGE_BG),
        panel_grid=element_blank(),
        panel_border=element_blank(),
        axis_text=element_blank(),
        axis_ticks=element_blank(),
        axis_title=element_blank(),
        plot_title=element_text(size=12, ha="center", weight="bold", color=INK),
        plot_subtitle=element_text(size=8, ha="center", color=INK_SOFT, margin={"b": 8}),
        legend_background=element_rect(fill=ELEVATED_BG, color=INK_SOFT),
        legend_text=element_text(size=8, color=INK_SOFT),
        legend_title=element_text(size=9, weight="bold", color=INK),
        legend_position="right",
        plot_margin=0.05,
    )
)

# Wave column headers
for w, label in enumerate(wave_labels):
    plot = plot + annotate(
        "text", x=x_positions[w], y=0.95, label=label, size=4.0, color=INK, fontweight="bold", ha="center"
    )

# Category labels left of wave 1
for cat in categories:
    pos = node_positions[(0, cat)]
    ly = (pos["y_top"] + pos["y_bottom"]) / 2
    plot = plot + annotate(
        "text",
        x=x_positions[0] - node_width / 2 - 0.015,
        y=ly,
        label=cat,
        size=3.2,
        color=INK,
        fontweight="bold",
        ha="right",
        va="center",
    )

# Category labels right of wave 4
for cat in categories:
    pos = node_positions[(3, cat)]
    ly = (pos["y_top"] + pos["y_bottom"]) / 2
    plot = plot + annotate(
        "text",
        x=x_positions[3] + node_width / 2 + 0.015,
        y=ly,
        label=cat,
        size=3.2,
        color=INK,
        fontweight="bold",
        ha="left",
        va="center",
    )

# Save
plot.save(f"plot-{THEME}.png", dpi=400, width=8, height=4.5, units="in", verbose=False)
Runnable source as JSON, for any HTTP client: https://api.anyplot.ai/specs/alluvial-opinion-flow/plotnine/code. Any spec id and library id listed in llms-full.txt fit the same URL shape; every URL below is complete and callable.
{
  "spec_id": "alluvial-opinion-flow",
  "language": "python",
  "library": "plotnine",
  "page": "https://anyplot.ai/alluvial-opinion-flow/python/plotnine",
  "hub": "https://anyplot.ai/alluvial-opinion-flow",
  "code_json": "https://api.anyplot.ai/specs/alluvial-opinion-flow/plotnine/code",
  "spec_json": "https://api.anyplot.ai/specs/alluvial-opinion-flow",
  "render_light_png": "https://storage.googleapis.com/anyplot-images/plots/alluvial-opinion-flow/python/plotnine/plot-light.png",
  "render_dark_png": "https://storage.googleapis.com/anyplot-images/plots/alluvial-opinion-flow/python/plotnine/plot-dark.png",
  "quality_score": 89.0,
  "license": "MIT",
  "guide": "https://anyplot.ai/llms.txt"
}
Part of Opinion Flow Diagram on anyplot.ai.