The same plot in 13 other libraries — JavaScript: D3.js, Apache ECharts, MUI X Charts; Python: Altair, Bokeh, lets-plot, Matplotlib, Plotly, plotnine, Pygal, Seaborn; R: ggplot2; Julia: Makie.jl. Compare all 14 side by side: Opinion Flow Diagram in Python, R, Julia and JavaScript.
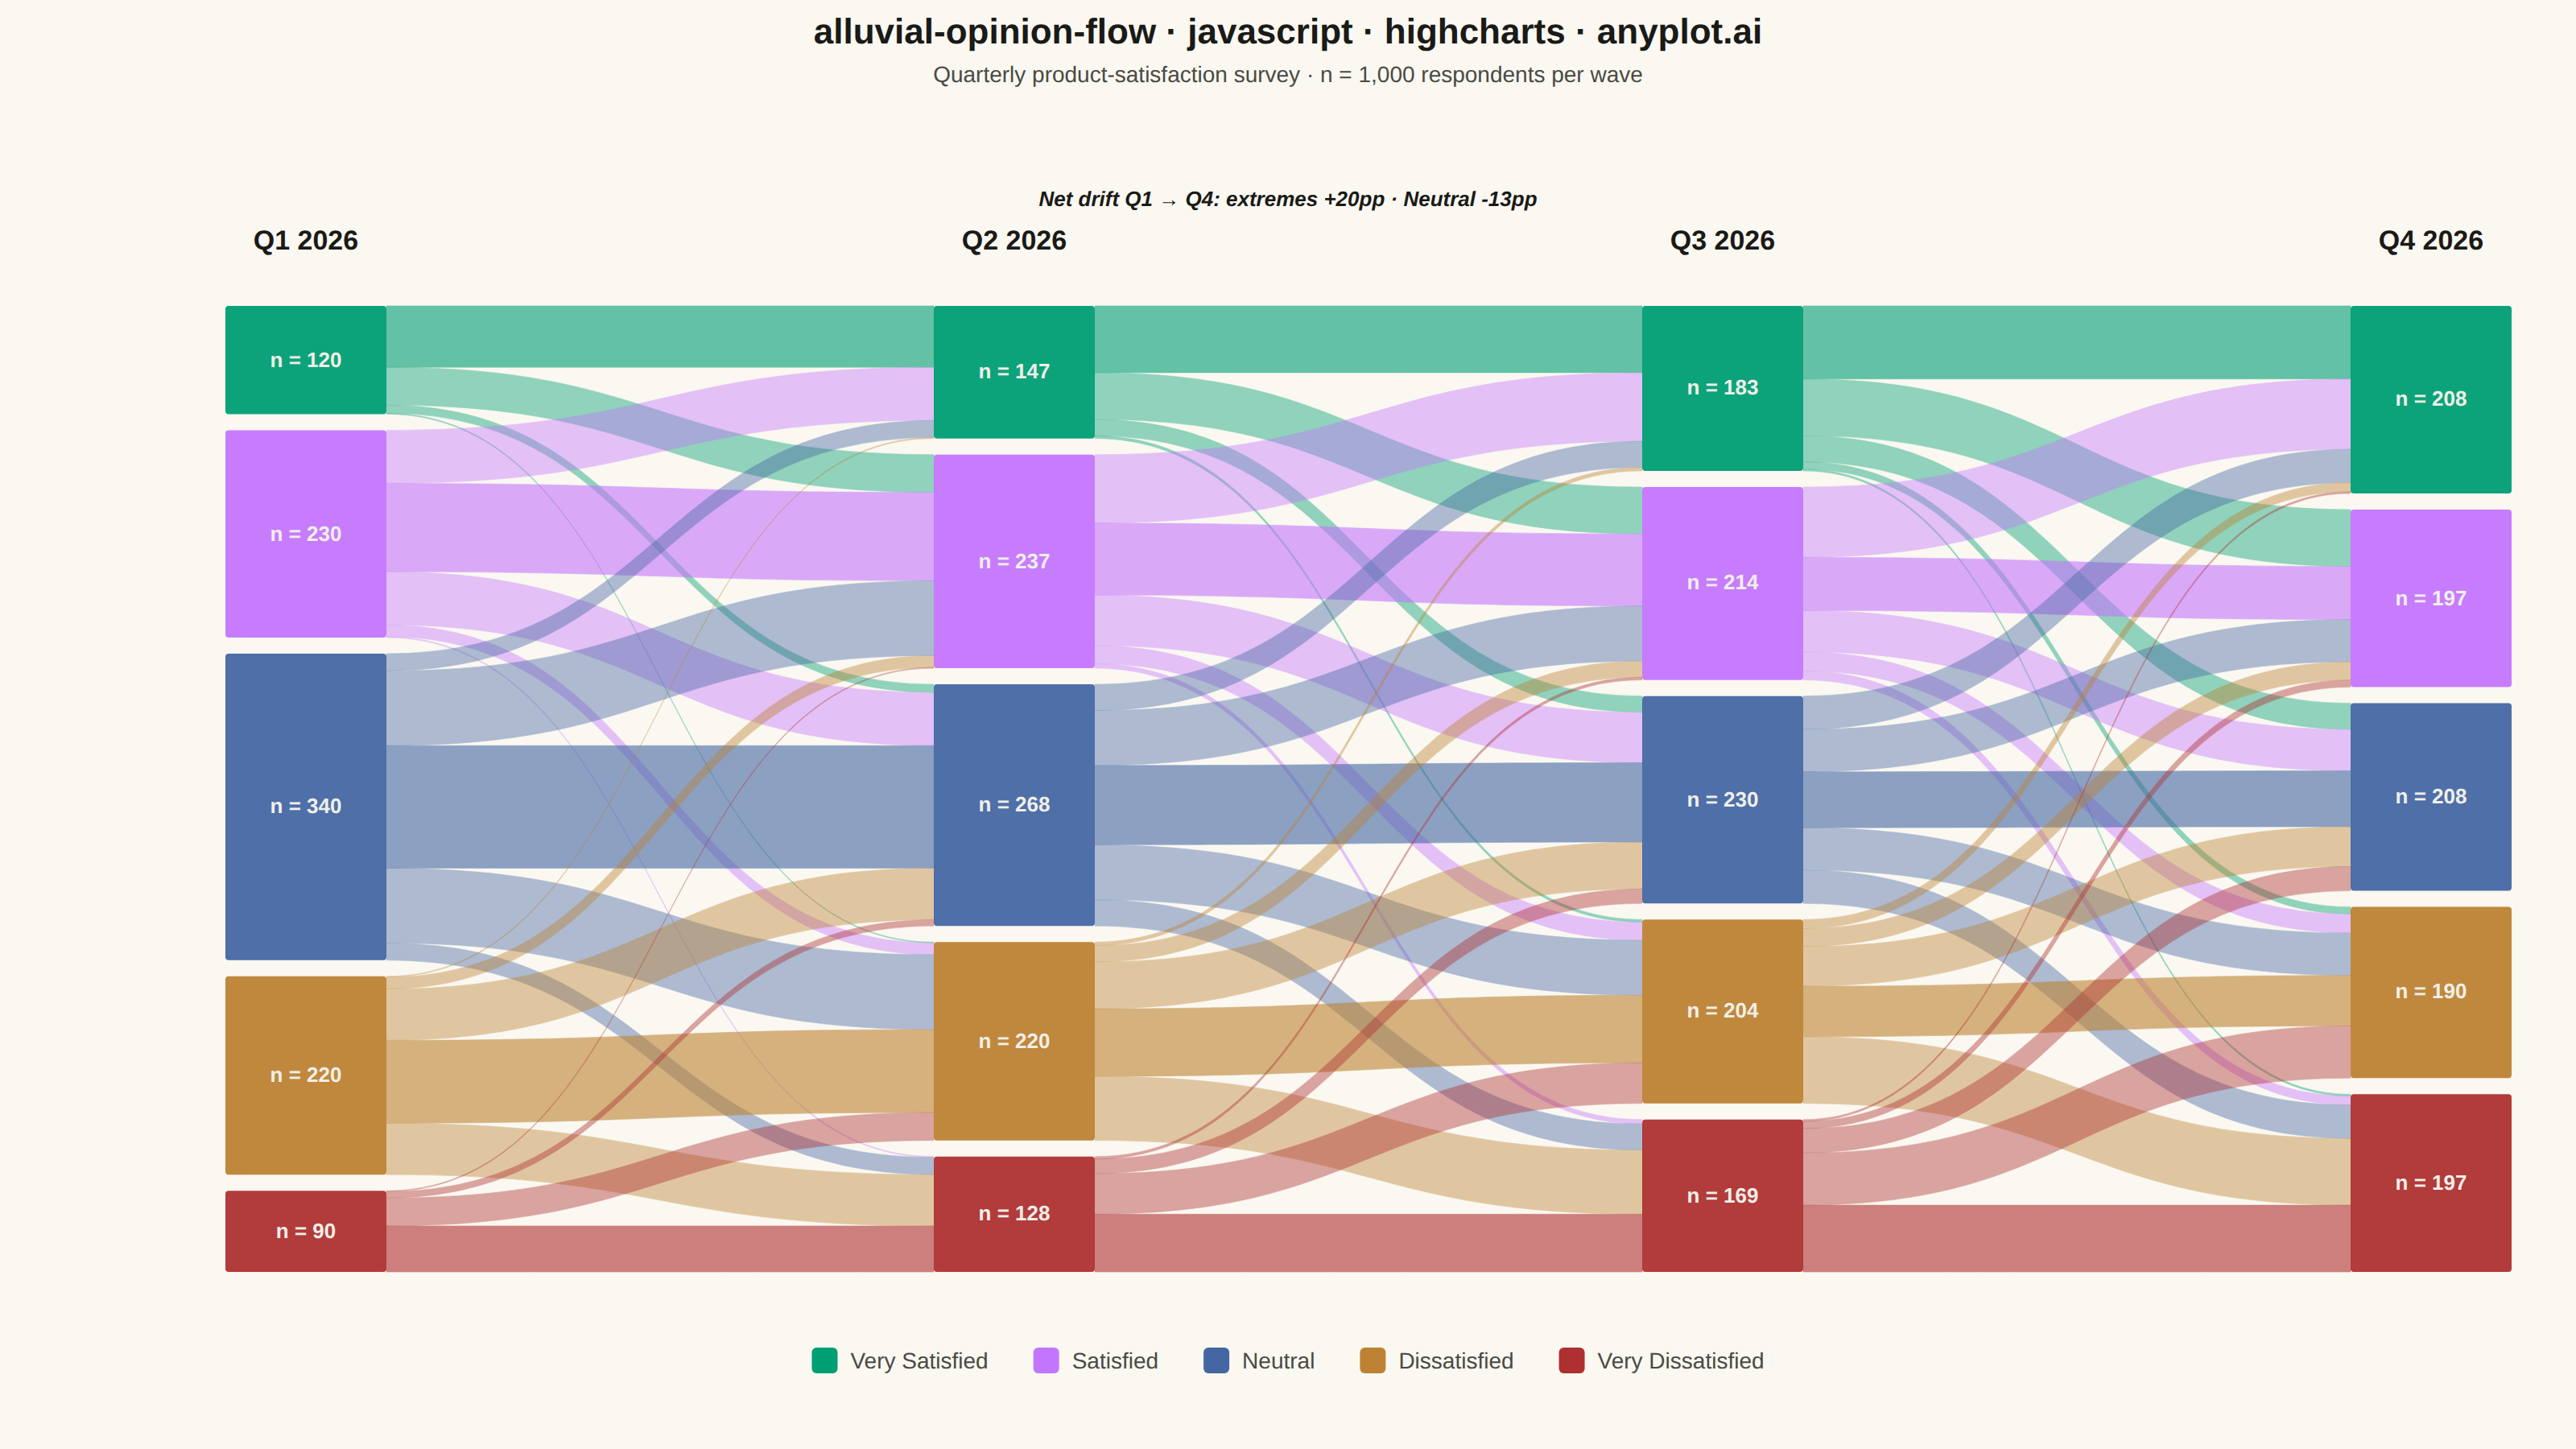
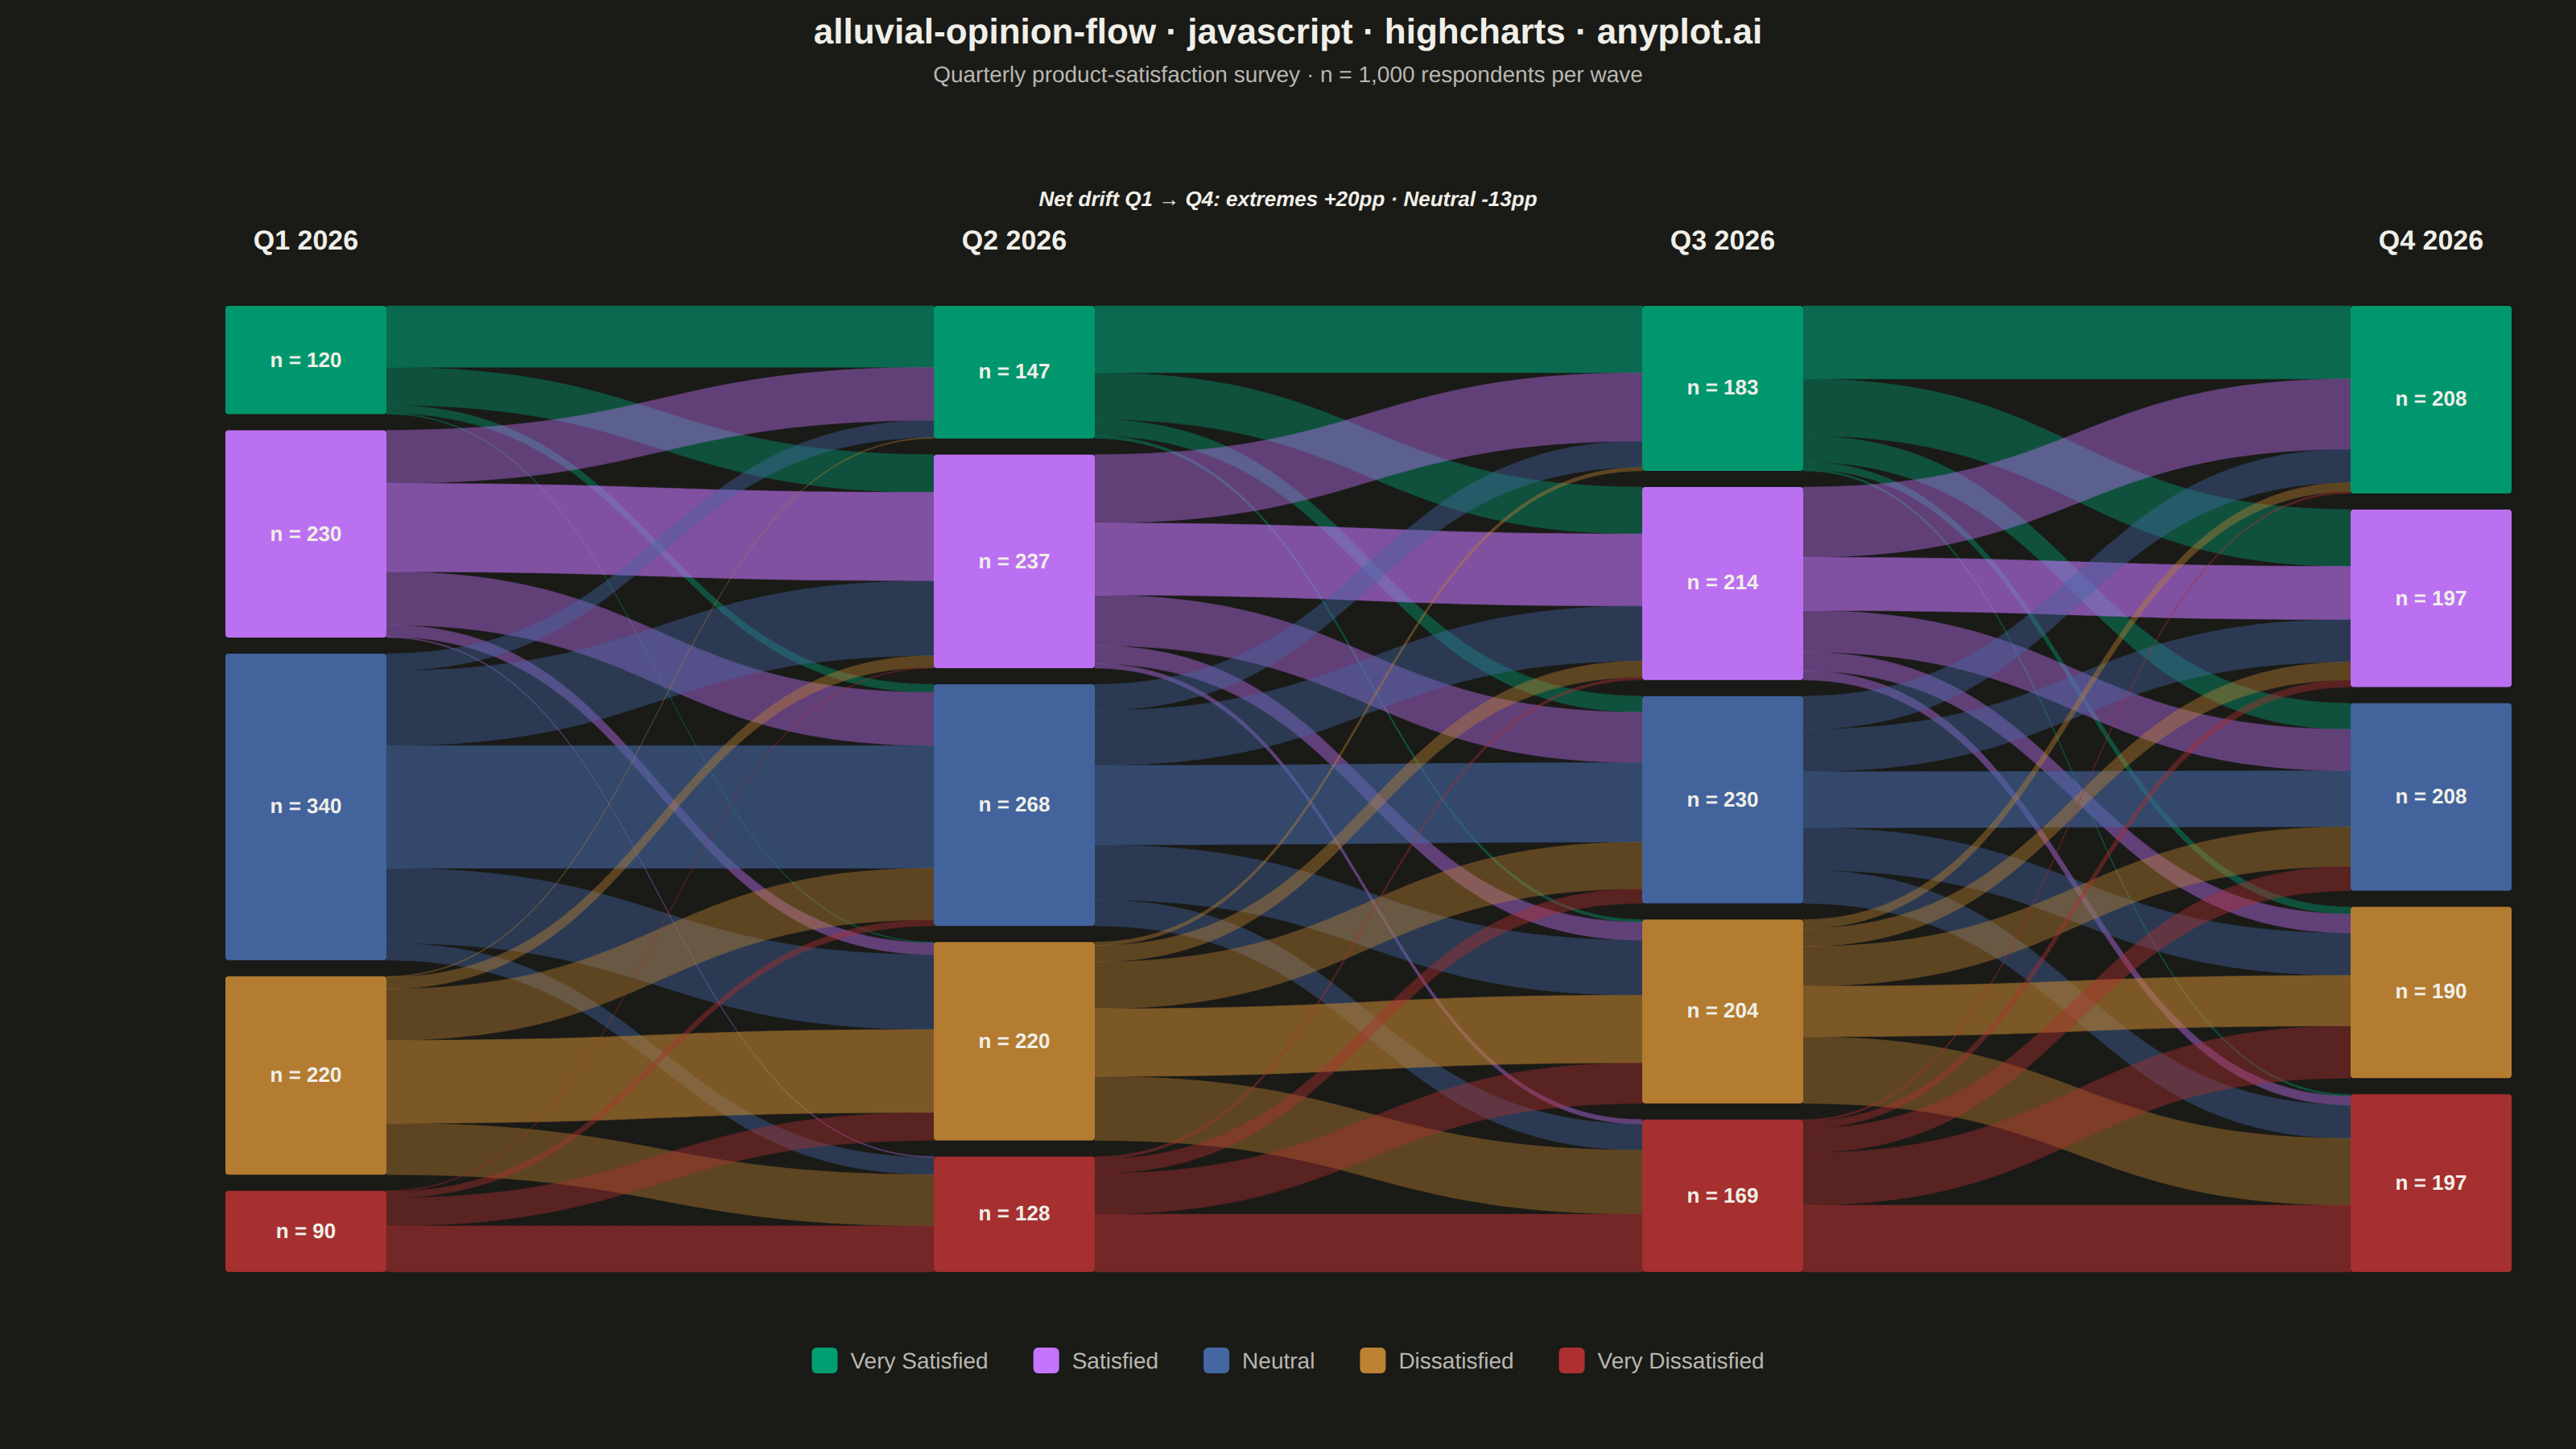
An alluvial/Sankey-style diagram showing how opinions or group memberships shift between survey waves or time periods. Flows connect the same response categories across columns, revealing patterns of opinion change, stability, and polarization. Unlike a basic alluvial diagram, this variant emphasizes distinguishing stable respondents from net changers and displays respondent totals per category at each wave.
// anyplot.ai
// alluvial-opinion-flow: Opinion Flow Diagram
// Library: highcharts 12.6.0 | JavaScript 22.23.2
// Quality: 90/100 | Created: 2026-08-26

//# anyplot-orientation: landscape

// The core Highcharts bundle has no sankey/alluvial module vendored (see
// prompts/library/highcharts.md — only modules/* are excluded, chart.renderer
// is core). Nodes and flow ribbons below are drawn natively with the SVG
// renderer, the same low-level API Highcharts itself uses for its module
// series types.

const t = window.ANYPLOT_TOKENS;
const size = window.ANYPLOT_SIZE;

// --- Data: quarterly product-satisfaction survey, 1,000 respondents --------
// Deterministic transition matrices — no fetch, no RNG. A Gaussian kernel
// keeps most respondents near their previous category (the "stable" mass),
// with a small drift toward the two extremes that grows each wave to model
// a polarizing campaign response.
const WAVE_LABELS = ["Q1 2026", "Q2 2026", "Q3 2026", "Q4 2026"];
const CATEGORIES = ["Very Satisfied", "Satisfied", "Neutral", "Dissatisfied", "Very Dissatisfied"];
const N_WAVES = WAVE_LABELS.length;
const N_CAT = CATEGORIES.length;
// First and last categories anchor to the semantic green/red pair; the three
// middle categories take the next canonical Imprint slots in order (see
// prompts/default-style-guide.md "Categorical Palette"). All 5 hexes are
// fixed across themes so each category keeps its identity in both renders.
const COLORS = [t.palette[0], t.palette[1], t.palette[2], t.palette[3], t.palette[4]];

function gaussian(distance, sigma) {
  return Math.exp(-(distance * distance) / (2 * sigma * sigma));
}

function buildTransition(sourceTotals, waveIndex) {
  const sigma = 1.0 + waveIndex * 0.2;
  const matrix = [];
  for (let i = 0; i < N_CAT; i++) {
    const weights = [];
    let weightSum = 0;
    for (let j = 0; j < N_CAT; j++) {
      let w = gaussian(j - i, sigma);
      if (j !== i && (j === 0 || j === N_CAT - 1)) w *= 1 + waveIndex * 0.35;
      weights.push(w);
      weightSum += w;
    }
    const rowTotal = sourceTotals[i];
    const rowCounts = weights.map((w) => Math.round((w / weightSum) * rowTotal));
    const drift = rowTotal - rowCounts.reduce((sum, v) => sum + v, 0);
    rowCounts[i] = Math.max(0, rowCounts[i] + drift);
    matrix.push(rowCounts);
  }
  return matrix;
}

const waveTotals = [[120, 230, 340, 220, 90]];
const transitions = [];
for (let w = 0; w < N_WAVES - 1; w++) {
  const matrix = buildTransition(waveTotals[w], w);
  transitions.push(matrix);
  const nextTotals = new Array(N_CAT).fill(0);
  for (let i = 0; i < N_CAT; i++) {
    for (let j = 0; j < N_CAT; j++) nextTotals[j] += matrix[i][j];
  }
  waveTotals.push(nextTotals);
}
const RESPONDENTS = waveTotals[0].reduce((a, b) => a + b, 0);

// Net-flow summary (Q1 -> Q4): how many percentage points shifted into the
// two extreme categories versus out of Neutral, to make the polarization
// trend an explicit, named callout rather than an implicit visual pattern.
const firstWave = waveTotals[0];
const lastWave = waveTotals[N_WAVES - 1];
const extremesPct = Math.round(
  ((lastWave[0] + lastWave[N_CAT - 1] - (firstWave[0] + firstWave[N_CAT - 1])) / RESPONDENTS) * 100,
);
const neutralPct = Math.round(((lastWave[2] - firstWave[2]) / RESPONDENTS) * 100);

// --- Layout ------------------------------------------------------------
const marginX = 140;
const plotTop = 190;
const plotBottom = size.height - 110;
const nodeWidth = 100;
const nodeGap = 10;
const usableHeight = plotBottom - plotTop - nodeGap * (N_CAT - 1);
const pxPerRespondent = usableHeight / RESPONDENTS;
const colX = (w) => marginX + (w * (size.width - 2 * marginX)) / (N_WAVES - 1);

// nodes[wave][category] = { y0, y1, total }
const nodes = waveTotals.map((totals) => {
  let cursor = plotTop;
  return totals.map((total) => {
    const h = total * pxPerRespondent;
    const node = { y0: cursor, y1: cursor + h, total };
    cursor += h + nodeGap;
    return node;
  });
});

function subdivide(node, valuesInOrder) {
  const total = valuesInOrder.reduce((a, b) => a + b, 0);
  const height = node.y1 - node.y0;
  let cursor = node.y0;
  return valuesInOrder.map((v) => {
    const h = total > 0 ? (v / total) * height : 0;
    const seg = { y0: cursor, y1: cursor + h };
    cursor += h;
    return seg;
  });
}

function luminance(hex) {
  const [r, g, b] = hex
    .replace("#", "")
    .match(/.{2}/g)
    .map((c) => parseInt(c, 16) / 255)
    .map((v) => (v <= 0.03928 ? v / 12.92 : Math.pow((v + 0.055) / 1.055, 2.4)));
  return 0.2126 * r + 0.7152 * g + 0.0722 * b;
}
function contrastText(hex) {
  return luminance(hex) > 0.45 ? "#1A1A17" : "#F0EFE8";
}

// --- Chart (empty series — axes hidden, everything drawn via the renderer) -
const chart = Highcharts.chart("container", {
  chart: { backgroundColor: "transparent", animation: false, style: { fontFamily: "inherit" } },
  credits: { enabled: false },
  title: {
    text: "alluvial-opinion-flow · javascript · highcharts · anyplot.ai",
    style: { color: t.ink, fontSize: "22px", fontWeight: "600" },
  },
  subtitle: {
    text: "Quarterly product-satisfaction survey · n = 1,000 respondents per wave",
    style: { color: t.inkSoft, fontSize: "14px" },
  },
  xAxis: { visible: false },
  yAxis: { visible: false },
  legend: { enabled: false },
  plotOptions: { series: { animation: false } },
  series: [],
});

// --- Net-flow callout (explicit polarization-trend highlight, SC-02) -----
chart.renderer
  .text(
    `Net drift Q1 → Q4: extremes +${extremesPct}pp · Neutral ${neutralPct}pp`,
    size.width / 2,
    plotTop - 62,
  )
  .attr({ align: "center" })
  .css({ color: t.ink, fontSize: "13px", fontWeight: "600", fontStyle: "italic" })
  .add();

// --- Column headers ------------------------------------------------------
WAVE_LABELS.forEach((label, w) => {
  chart.renderer
    .text(label, colX(w) + nodeWidth / 2, plotTop - 35)
    .attr({ align: "center" })
    .css({ color: t.ink, fontSize: "17px", fontWeight: "600" })
    .add();
});

// --- Flow ribbons (drawn first so node blocks sit on top) ----------------
for (let w = 0; w < N_WAVES - 1; w++) {
  const matrix = transitions[w];
  const sourceNodes = nodes[w];
  const targetNodes = nodes[w + 1];
  const sourceSegs = sourceNodes.map((node, i) => subdivide(node, matrix[i]));
  const targetSegs = targetNodes.map((node, j) => subdivide(node, matrix.map((row) => row[j])));

  const x0 = colX(w) + nodeWidth;
  const x1 = colX(w + 1);
  const xMid = (x0 + x1) / 2;

  for (let i = 0; i < N_CAT; i++) {
    for (let j = 0; j < N_CAT; j++) {
      const value = matrix[i][j];
      if (value <= 0) continue;
      const s = sourceSegs[i][j];
      const d = targetSegs[j][i];
      const stable = i === j;
      const path = [
        "M", x0, s.y0,
        "C", xMid, s.y0, xMid, d.y0, x1, d.y0,
        "L", x1, d.y1,
        "C", xMid, d.y1, xMid, s.y1, x0, s.y1,
        "Z",
      ];
      chart.renderer
        .path(path)
        .attr({
          fill: COLORS[i],
          opacity: stable ? 0.6 : 0.42,
          stroke: COLORS[i],
          "stroke-width": 0.5,
          "stroke-opacity": stable ? 0.6 : 0.55,
        })
        .add();
    }
  }
}

// --- Nodes + respondent-count labels --------------------------------------
nodes.forEach((waveNodes, w) => {
  const x = colX(w);
  waveNodes.forEach((node, c) => {
    chart.renderer
      .rect(x, node.y0, nodeWidth, node.y1 - node.y0, 2)
      .attr({ fill: COLORS[c], opacity: 0.95 })
      .add();

    const height = node.y1 - node.y0;
    if (height >= 26) {
      chart.renderer
        .text(`n = ${node.total.toLocaleString("en-US")}`, x + nodeWidth / 2, (node.y0 + node.y1) / 2 + 4)
        .attr({ align: "center" })
        .css({ color: contrastText(COLORS[c]), fontSize: "13px", fontWeight: "600" })
        .add();
    }
  });
});

// --- Category legend (measured and centered under the plot) --------------
const legendY = size.height - 50;
const swatchSize = 16;
const swatchTextGap = 8;
const itemGap = 28;
const legendEntries = CATEGORIES.map((name, idx) => {
  const label = chart.renderer.text(name, 0, legendY).css({ color: t.inkSoft, fontSize: "14px" }).add();
  return { idx, label, width: label.getBBox().width };
});
const legendWidth =
  legendEntries.reduce((sum, e) => sum + swatchSize + swatchTextGap + e.width, 0) + itemGap * (legendEntries.length - 1);
let cursorX = (size.width - legendWidth) / 2;
legendEntries.forEach((e) => {
  chart.renderer
    .rect(cursorX, legendY - swatchSize + 3, swatchSize, swatchSize, 3)
    .attr({ fill: COLORS[e.idx] })
    .add();
  e.label.attr({ x: cursorX + swatchSize + swatchTextGap, y: legendY });
  cursorX += swatchSize + swatchTextGap + e.width + itemGap;
});
Runnable source as JSON, for any HTTP client: https://api.anyplot.ai/specs/alluvial-opinion-flow/highcharts/code. Any spec id and library id listed in llms-full.txt fit the same URL shape; every URL below is complete and callable.
{
  "spec_id": "alluvial-opinion-flow",
  "language": "javascript",
  "library": "highcharts",
  "page": "https://anyplot.ai/alluvial-opinion-flow/javascript/highcharts",
  "hub": "https://anyplot.ai/alluvial-opinion-flow",
  "code_json": "https://api.anyplot.ai/specs/alluvial-opinion-flow/highcharts/code",
  "spec_json": "https://api.anyplot.ai/specs/alluvial-opinion-flow",
  "render_light_png": "https://storage.googleapis.com/anyplot-images/plots/alluvial-opinion-flow/javascript/highcharts/plot-light.png",
  "render_dark_png": "https://storage.googleapis.com/anyplot-images/plots/alluvial-opinion-flow/javascript/highcharts/plot-dark.png",
  "interactive_light_html": "https://storage.googleapis.com/anyplot-images/plots/alluvial-opinion-flow/javascript/highcharts/plot-light.html",
  "interactive_dark_html": "https://storage.googleapis.com/anyplot-images/plots/alluvial-opinion-flow/javascript/highcharts/plot-dark.html",
  "quality_score": 90.0,
  "license": "MIT",
  "guide": "https://anyplot.ai/llms.txt"
}
Part of Opinion Flow Diagram on anyplot.ai.