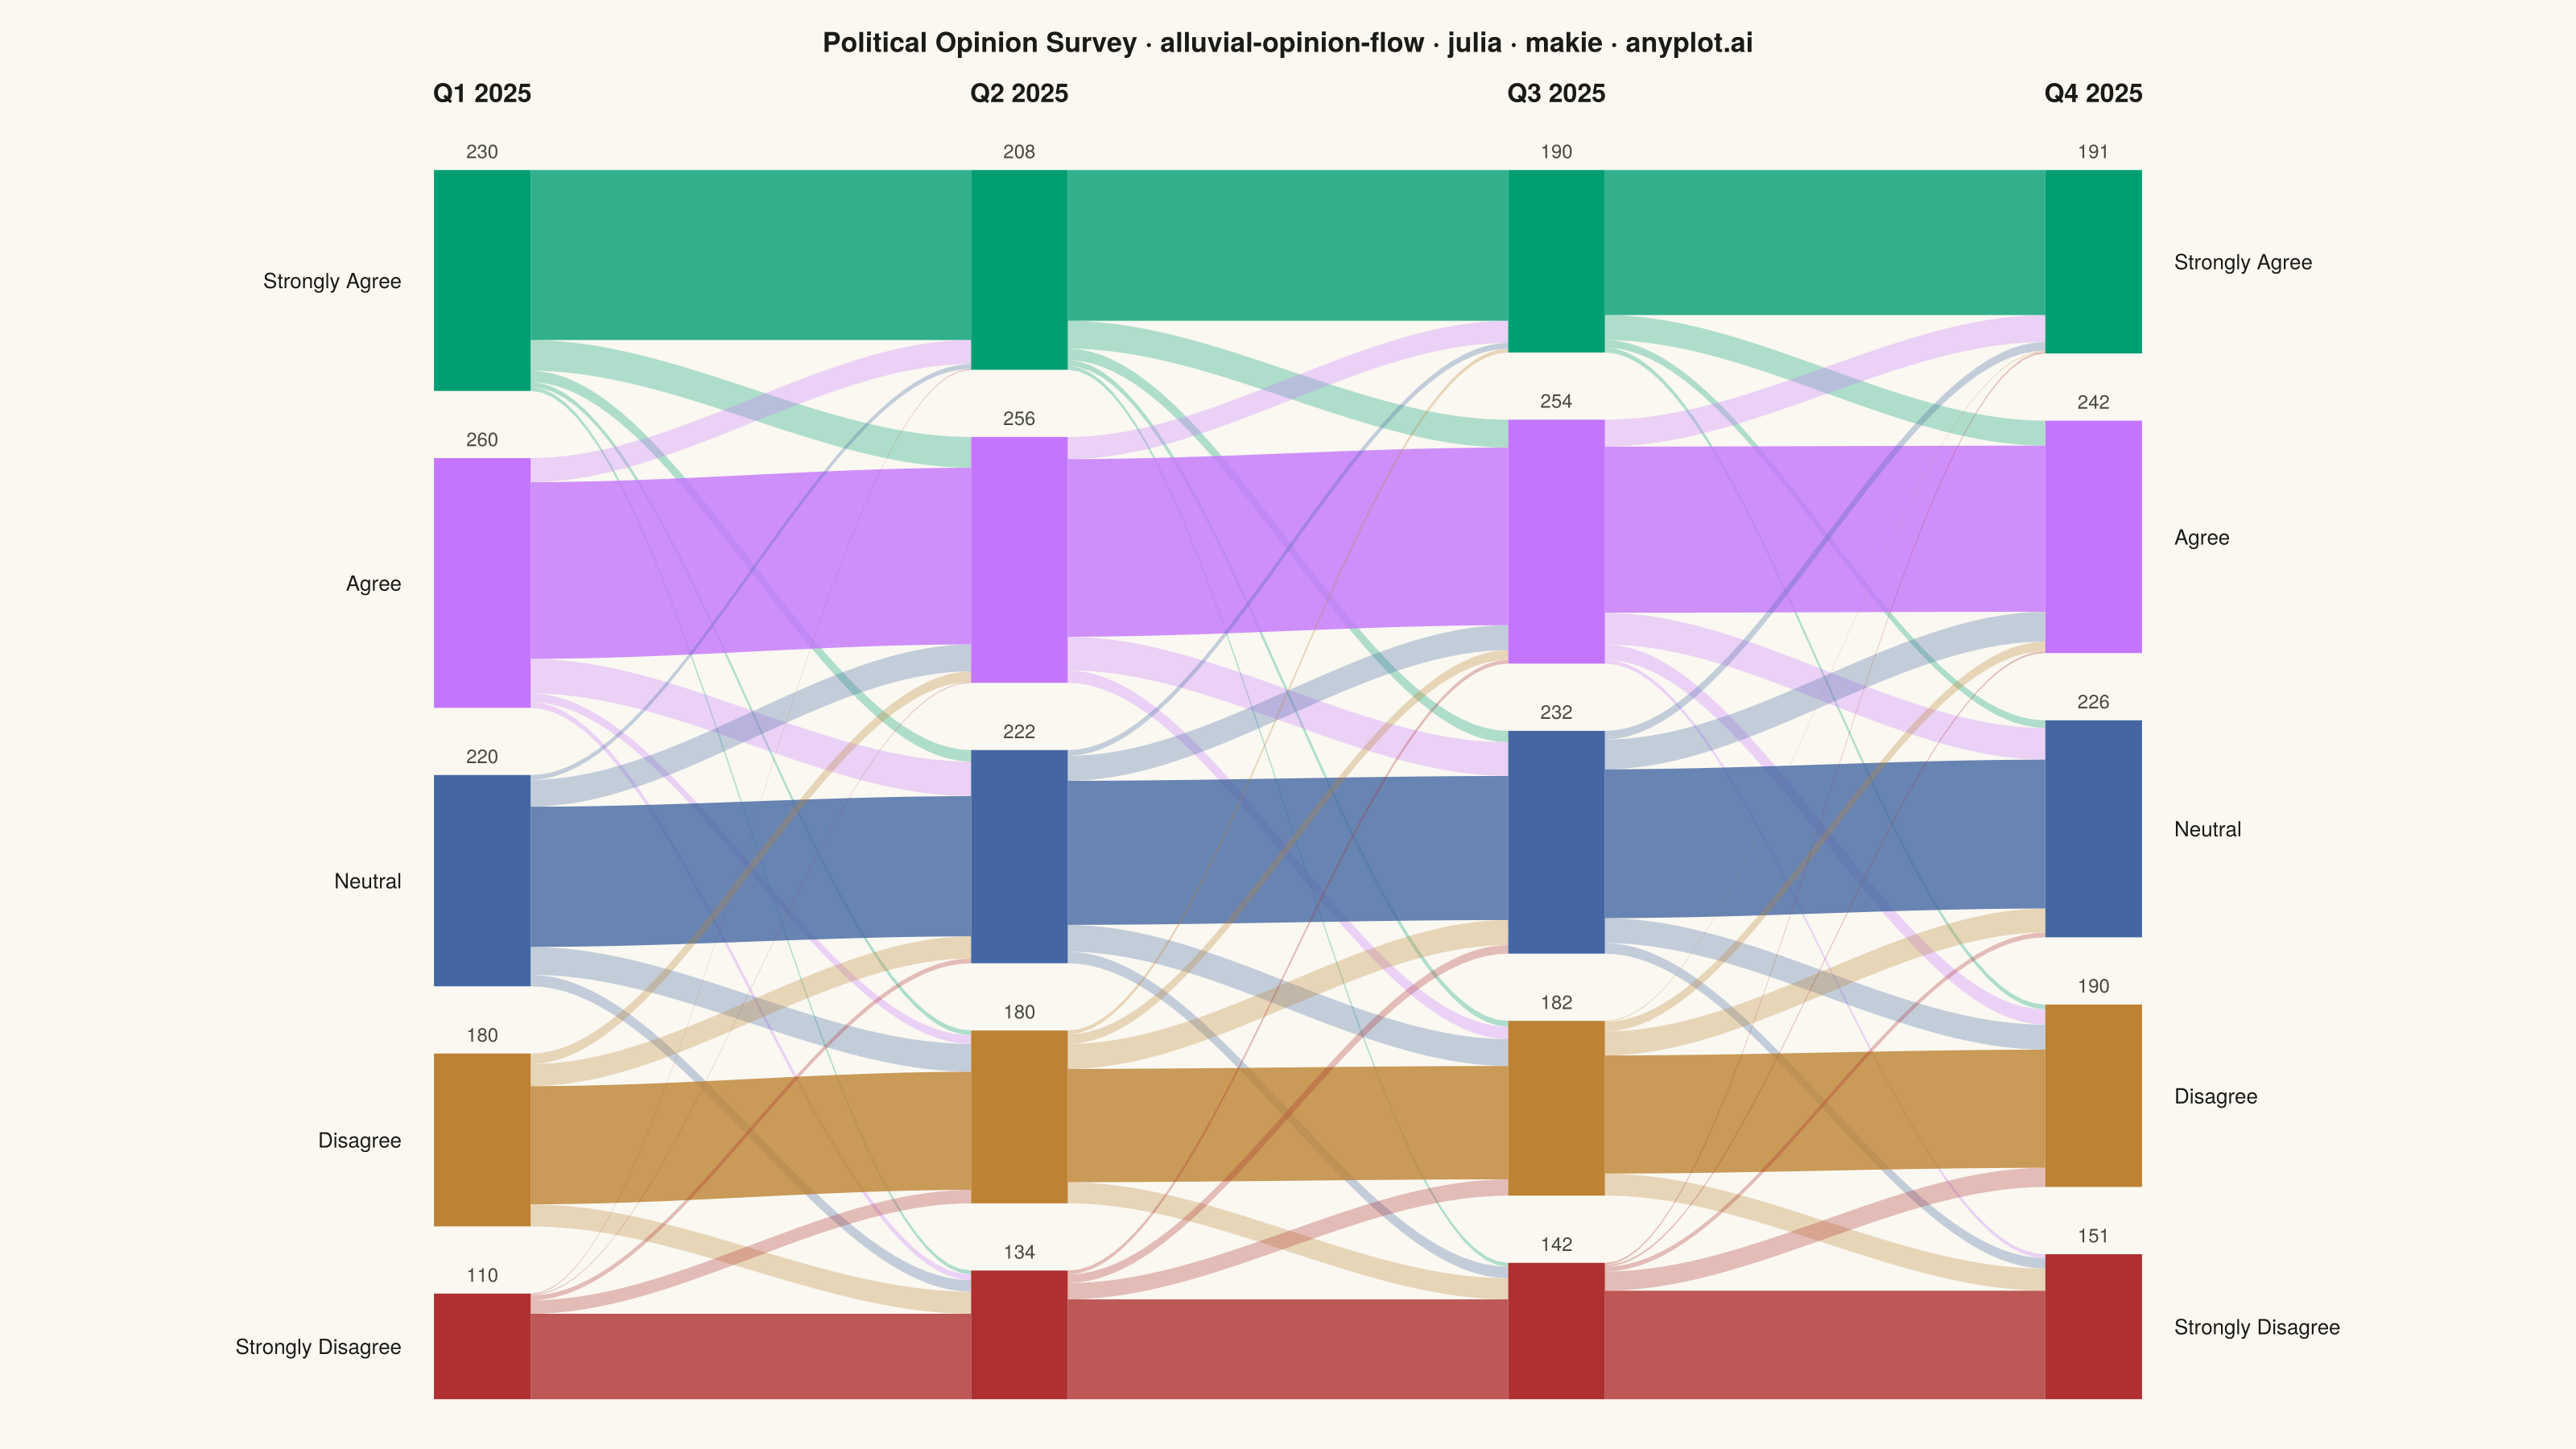
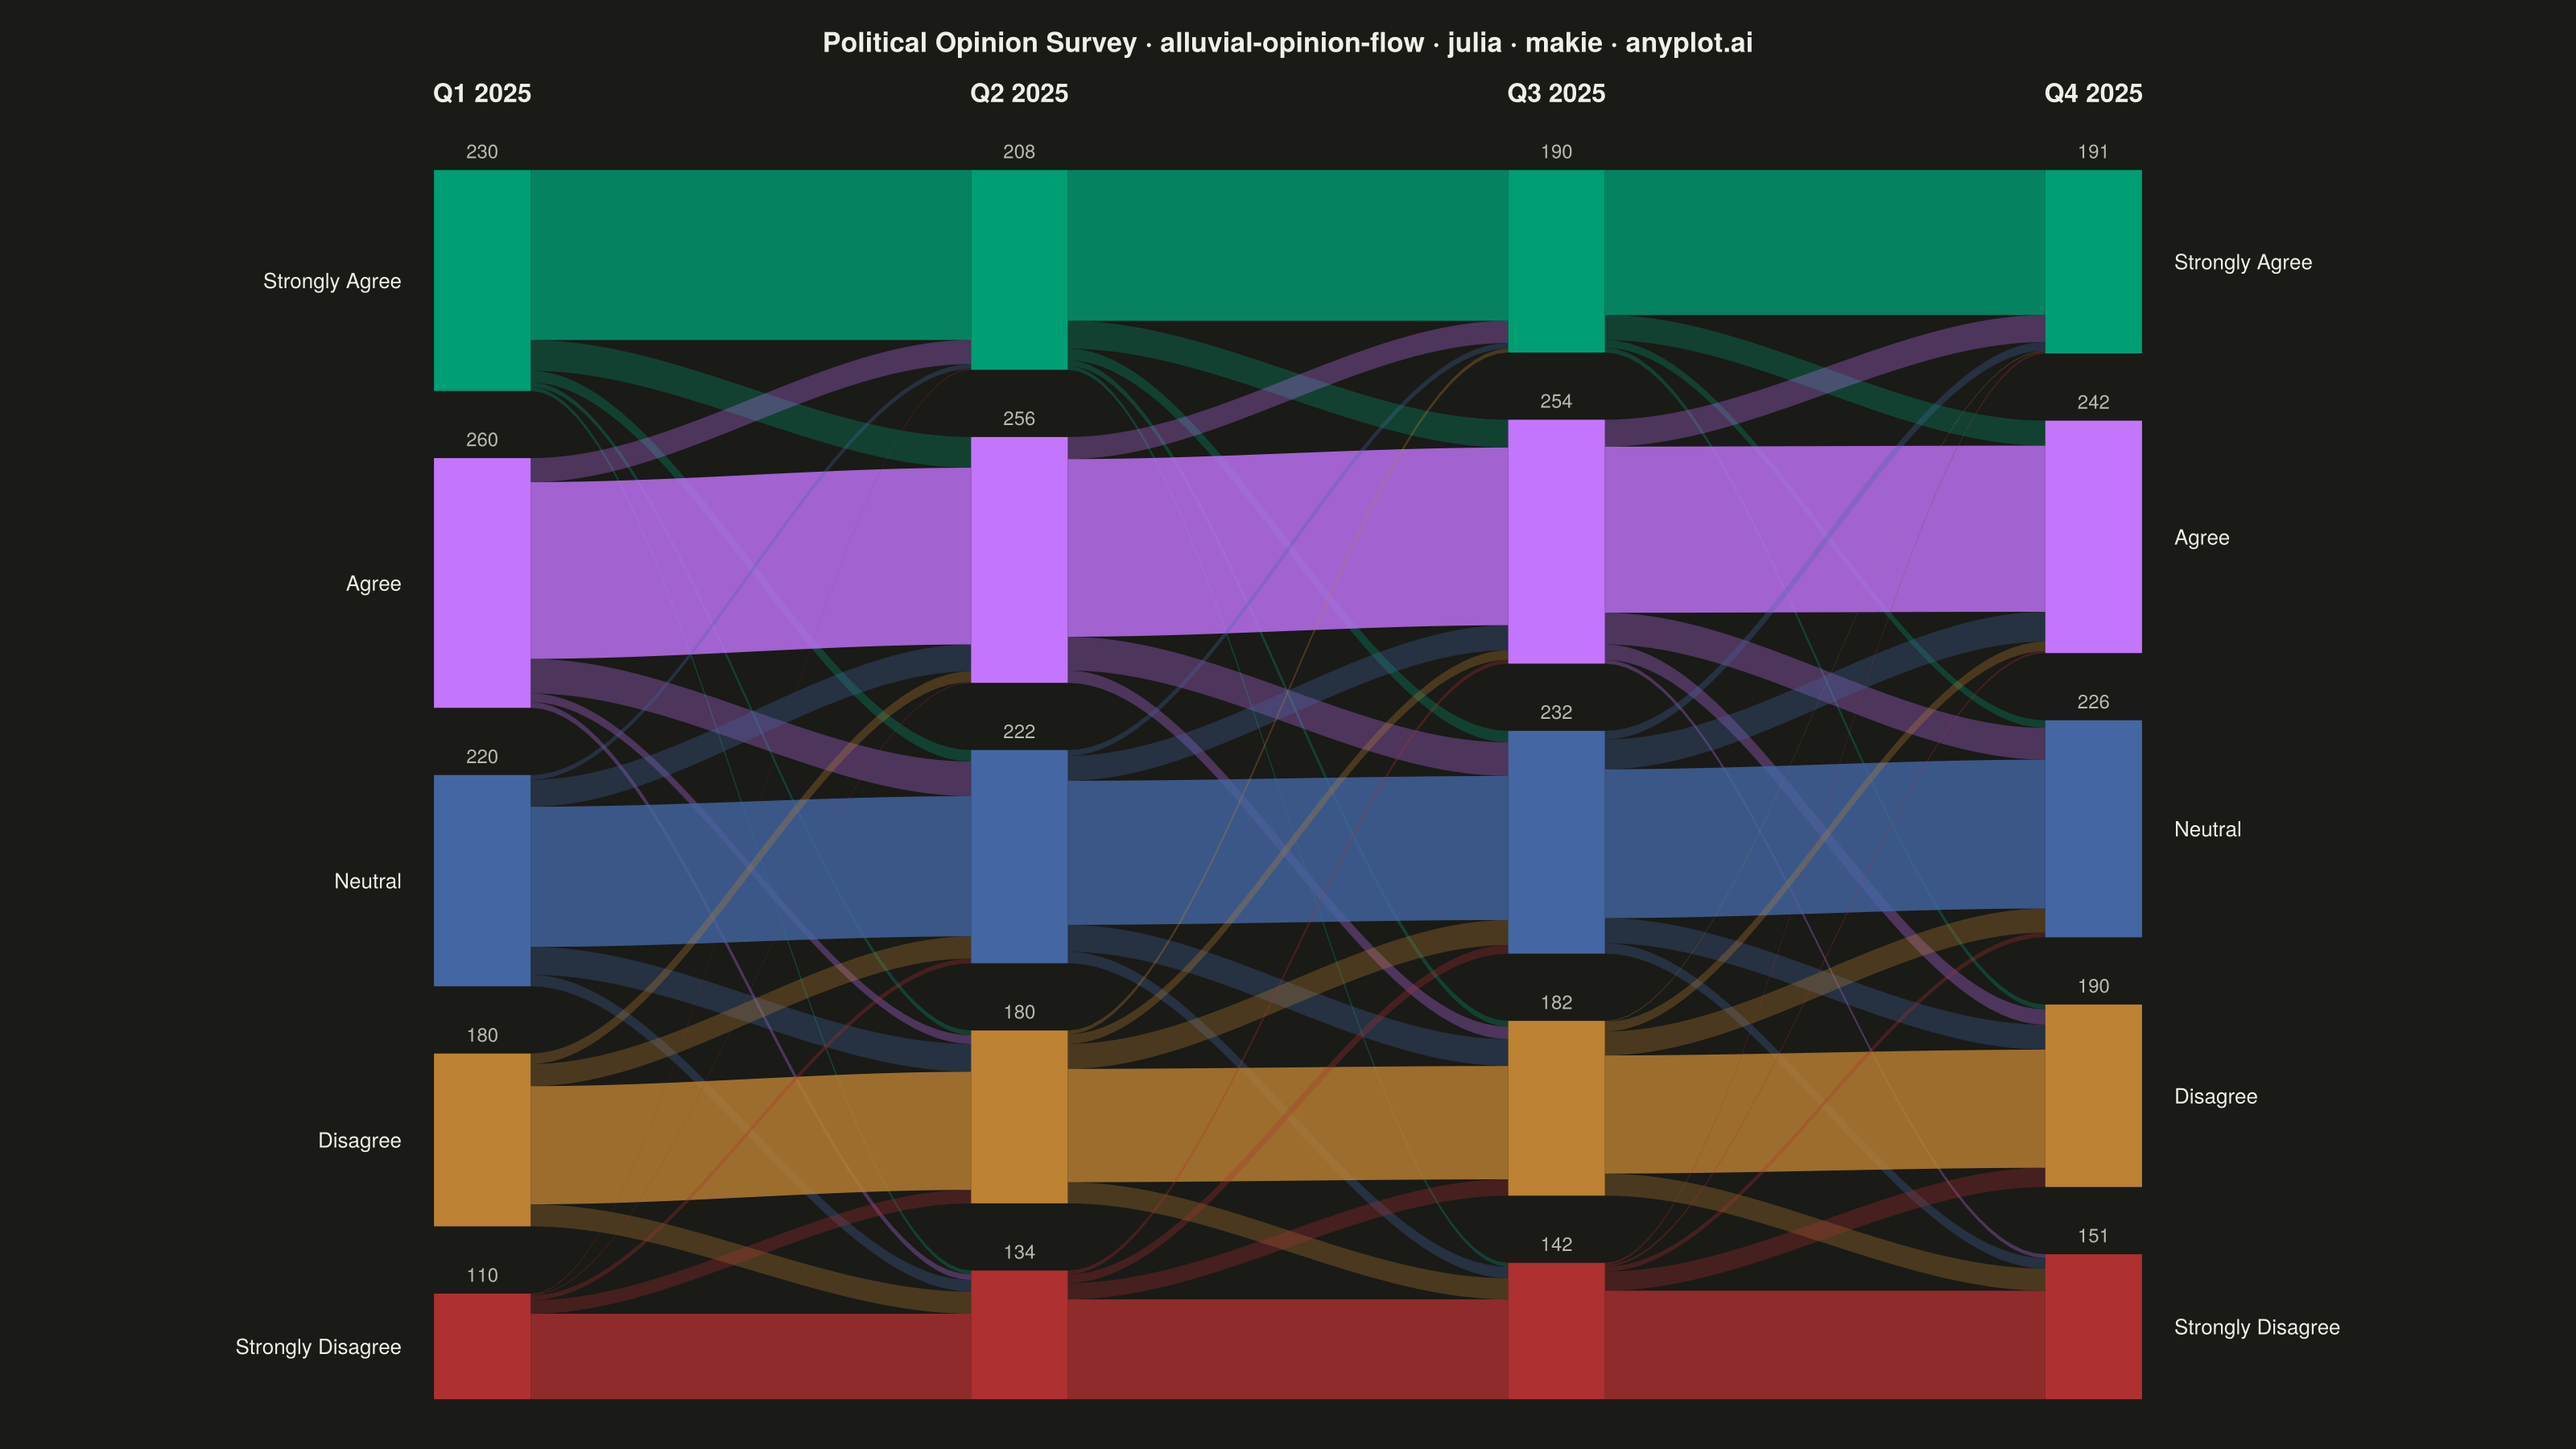
The same plot in 13 other libraries — Python: Altair, Bokeh, lets-plot, Matplotlib, Plotly, plotnine, Pygal, Seaborn; R: ggplot2; JavaScript: D3.js, Apache ECharts, Highcharts, MUI X Charts. Compare all 14 side by side: Opinion Flow Diagram in Python, R, Julia and JavaScript.
An alluvial/Sankey-style diagram showing how opinions or group memberships shift between survey waves or time periods. Flows connect the same response categories across columns, revealing patterns of opinion change, stability, and polarization. Unlike a basic alluvial diagram, this variant emphasizes distinguishing stable respondents from net changers and displays respondent totals per category at each wave.
# anyplot.ai
# alluvial-opinion-flow: Opinion Flow Diagram
# Library: makie 0.21.9 | Julia 1.11.9
# Quality: 90/100 | Created: 2026-08-24

using CairoMakie
using Colors
using Random

# Theme tokens (see prompts/default-style-guide.md "Background" + "Theme-adaptive Chrome")
THEME    = get(ENV, "ANYPLOT_THEME", "light")
PAGE_BG  = THEME == "light" ? colorant"#FAF8F1" : colorant"#1A1A17"
INK      = THEME == "light" ? colorant"#1A1A17" : colorant"#F0EFE8"
INK_SOFT = THEME == "light" ? colorant"#4A4A44" : colorant"#B8B7B0"

# Imprint categorical palette — canonical order, position 1 always brand green
IMPRINT_PALETTE = [
    colorant"#009E73",  # 1 — brand green
    colorant"#C475FD",  # 2 — lavender
    colorant"#4467A3",  # 3 — blue
    colorant"#BD8233",  # 4 — ochre
    colorant"#AE3030",  # 5 — matte red
]

# Data — quarterly political opinion survey, 1000 respondents tracked across 4 waves
Random.seed!(42)

waves      = ["Q1 2025", "Q2 2025", "Q3 2025", "Q4 2025"]
categories = ["Strongly Agree", "Agree", "Neutral", "Disagree", "Strongly Disagree"]
n_wave     = length(waves)
n_cat      = length(categories)

wave_counts    = Vector{Vector{Int}}(undef, n_wave)
wave_counts[1] = [230, 260, 220, 180, 110]

# Diagonal-heavy transition matrix: most respondents stay put, some drift to
# neighboring categories, few make large jumps — a realistic opinion-survey pattern.
base_transition = [
    0.78 0.14 0.05 0.02 0.01
    0.10 0.70 0.14 0.05 0.01
    0.03 0.12 0.68 0.12 0.05
    0.01 0.05 0.14 0.68 0.12
    0.01 0.02 0.05 0.14 0.78
]

flow_counts = Vector{Matrix{Int}}(undef, n_wave - 1)

for w in 1:(n_wave - 1)
    noise      = 0.03 .* (rand(n_cat, n_cat) .- 0.5)
    transition = max.(base_transition .+ noise, 0.0)
    transition = transition ./ sum(transition; dims = 2)

    flows = zeros(Int, n_cat, n_cat)
    for s in 1:n_cat
        remaining = wave_counts[w][s]
        for t in 1:(n_cat - 1)
            take        = min(round(Int, wave_counts[w][s] * transition[s, t]), remaining)
            flows[s, t] = take
            remaining  -= take
        end
        flows[s, n_cat] = remaining
    end
    flow_counts[w] = flows

    next_counts = [sum(flows[:, t]) for t in 1:n_cat]
    wave_counts[w + 1] = next_counts
end

# Layout — stack category nodes per wave column; node_gap reserves whitespace
# above each node for its respondent-count label.
node_gap    = 70.0
x_positions = collect(1.0:n_wave)
half_width  = 0.09

node_tops    = Matrix{Float64}(undef, n_wave, n_cat)
node_bottoms = Matrix{Float64}(undef, n_wave, n_cat)

for w in 1:n_wave
    y_cursor = sum(wave_counts[w]) + node_gap * (n_cat - 1)
    for c in 1:n_cat
        node_tops[w, c]    = y_cursor
        node_bottoms[w, c] = y_cursor - wave_counts[w][c]
        y_cursor          -= wave_counts[w][c] + node_gap
    end
end

max_top  = maximum(node_tops)
header_y = max_top + 65.0

# Plot — see default-style-guide.md "Visual Sizing Defaults" for the canvas + sizing values
title_str      = "Political Opinion Survey · alluvial-opinion-flow · julia · makie · anyplot.ai"
title_default  = 20
title_floor    = 14
title_ratio    = length(title_str) > 67 ? 67 / length(title_str) : 1.0
title_fontsize = max(title_floor, round(Int, title_default * title_ratio))

fig = Figure(
    size            = (1600, 900),
    fontsize        = 14,
    backgroundcolor = PAGE_BG,
)

ax = Axis(
    fig[1, 1];
    title               = title_str,
    titlesize           = title_fontsize,
    titlecolor          = INK,
    backgroundcolor     = PAGE_BG,
    xticksvisible       = false,
    xticklabelsvisible  = false,
    yticksvisible       = false,
    yticklabelsvisible  = false,
    topspinevisible     = false,
    rightspinevisible   = false,
    leftspinevisible    = false,
    bottomspinevisible  = false,
    xgridvisible        = false,
    ygridvisible        = false,
)

xlims!(ax, x_positions[1] - 0.85, x_positions[end] + 0.85)
ylims!(ax, -25.0, max_top + 110.0)

# Flows — smoothstep ribbons; opacity distinguishes stable respondents (same
# category both waves) from changers, per spec.
for w in 1:(n_wave - 1)
    left_cursor  = copy(node_tops[w, :])
    right_cursor = copy(node_tops[w + 1, :])

    for s in 1:n_cat, t in 1:n_cat
        count = flow_counts[w][s, t]
        count == 0 && continue

        y0_top = left_cursor[s]
        y0_bot = y0_top - count
        left_cursor[s] = y0_bot

        y1_top = right_cursor[t]
        y1_bot = y1_top - count
        right_cursor[t] = y1_bot

        x0   = x_positions[w] + half_width
        x1   = x_positions[w + 1] - half_width
        xs   = range(x0, x1; length = 40)
        ts   = range(0.0, 1.0; length = 40)
        ease = @. ts^2 * (3 - 2 * ts)

        top_curve = y0_top .+ (y1_top - y0_top) .* ease
        bot_curve = y0_bot .+ (y1_bot - y0_bot) .* ease

        flow_alpha = s == t ? 0.80 : 0.30
        band!(ax, xs, bot_curve, top_curve; color = (IMPRINT_PALETTE[s], flow_alpha))
    end
end

# Nodes — solid bars sized by respondent count, drawn above the flow ends.
for w in 1:n_wave, c in 1:n_cat
    x0 = x_positions[w] - half_width
    x1 = x_positions[w] + half_width
    poly!(
        ax,
        Rect2f(x0, node_bottoms[w, c], x1 - x0, node_tops[w, c] - node_bottoms[w, c]);
        color = IMPRINT_PALETTE[c],
        strokewidth = 0,
    )
    text!(
        ax, x_positions[w], node_tops[w, c] + 8.0;
        text = string(wave_counts[w][c]),
        align = (:center, :bottom),
        fontsize = 12,
        color = INK_SOFT,
    )
end

# Column headers — one per wave, above the tallest column.
for w in 1:n_wave
    text!(
        ax, x_positions[w], header_y;
        text = waves[w],
        align = (:center, :bottom),
        fontsize = 16,
        color = INK,
        font = :bold,
    )
end

# Category names — labeled once on each outer column to avoid mid-chart clutter;
# the Imprint color already carries the identity across the interior waves.
for c in 1:n_cat
    y_mid_left = (node_tops[1, c] + node_bottoms[1, c]) / 2
    text!(
        ax, x_positions[1] - half_width - 0.06, y_mid_left;
        text = categories[c],
        align = (:right, :center),
        fontsize = 13,
        color = INK,
    )

    y_mid_right = (node_tops[n_wave, c] + node_bottoms[n_wave, c]) / 2
    text!(
        ax, x_positions[n_wave] + half_width + 0.06, y_mid_right;
        text = categories[c],
        align = (:left, :center),
        fontsize = 13,
        color = INK,
    )
end

# Save
save("plot-$(THEME).png", fig; px_per_unit = 2)
Runnable source as JSON, for any HTTP client: https://api.anyplot.ai/specs/alluvial-opinion-flow/makie/code. Any spec id and library id listed in llms-full.txt fit the same URL shape; every URL below is complete and callable.
{
  "spec_id": "alluvial-opinion-flow",
  "language": "julia",
  "library": "makie",
  "page": "https://anyplot.ai/alluvial-opinion-flow/julia/makie",
  "hub": "https://anyplot.ai/alluvial-opinion-flow",
  "code_json": "https://api.anyplot.ai/specs/alluvial-opinion-flow/makie/code",
  "spec_json": "https://api.anyplot.ai/specs/alluvial-opinion-flow",
  "render_light_png": "https://storage.googleapis.com/anyplot-images/plots/alluvial-opinion-flow/julia/makie/plot-light.png",
  "render_dark_png": "https://storage.googleapis.com/anyplot-images/plots/alluvial-opinion-flow/julia/makie/plot-dark.png",
  "quality_score": 90.0,
  "license": "MIT",
  "guide": "https://anyplot.ai/llms.txt"
}
Part of Opinion Flow Diagram on anyplot.ai.