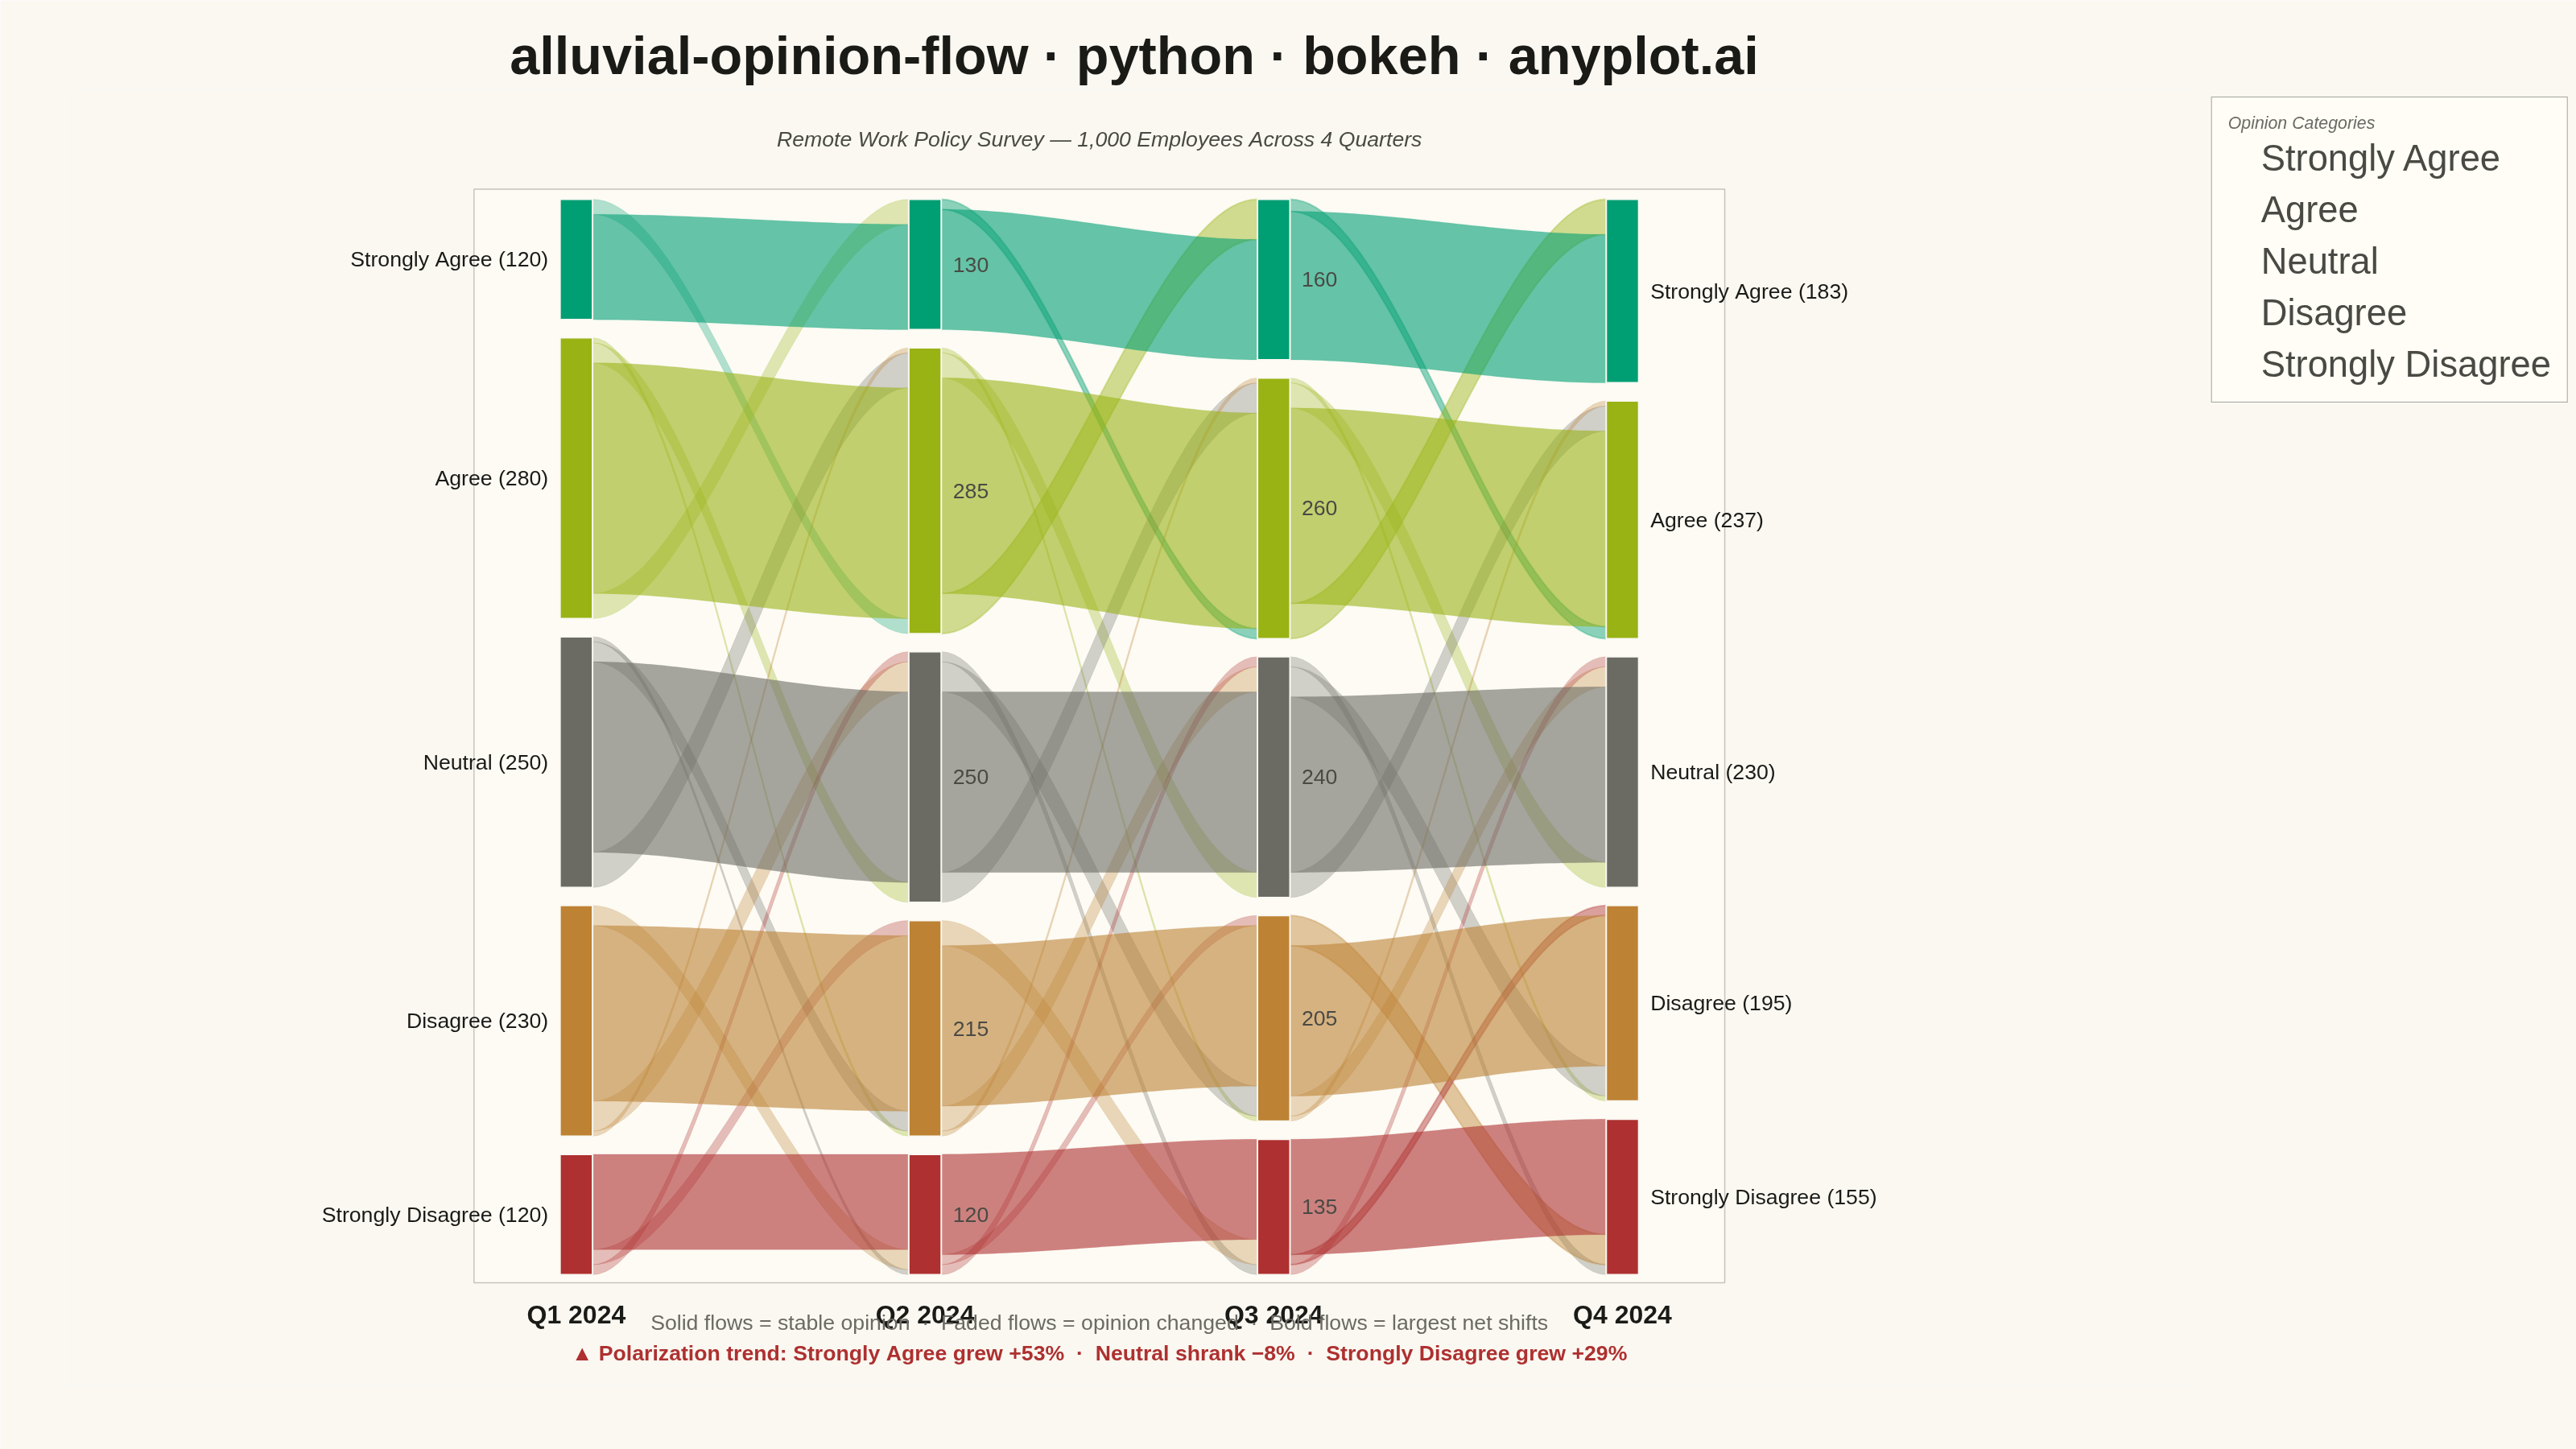
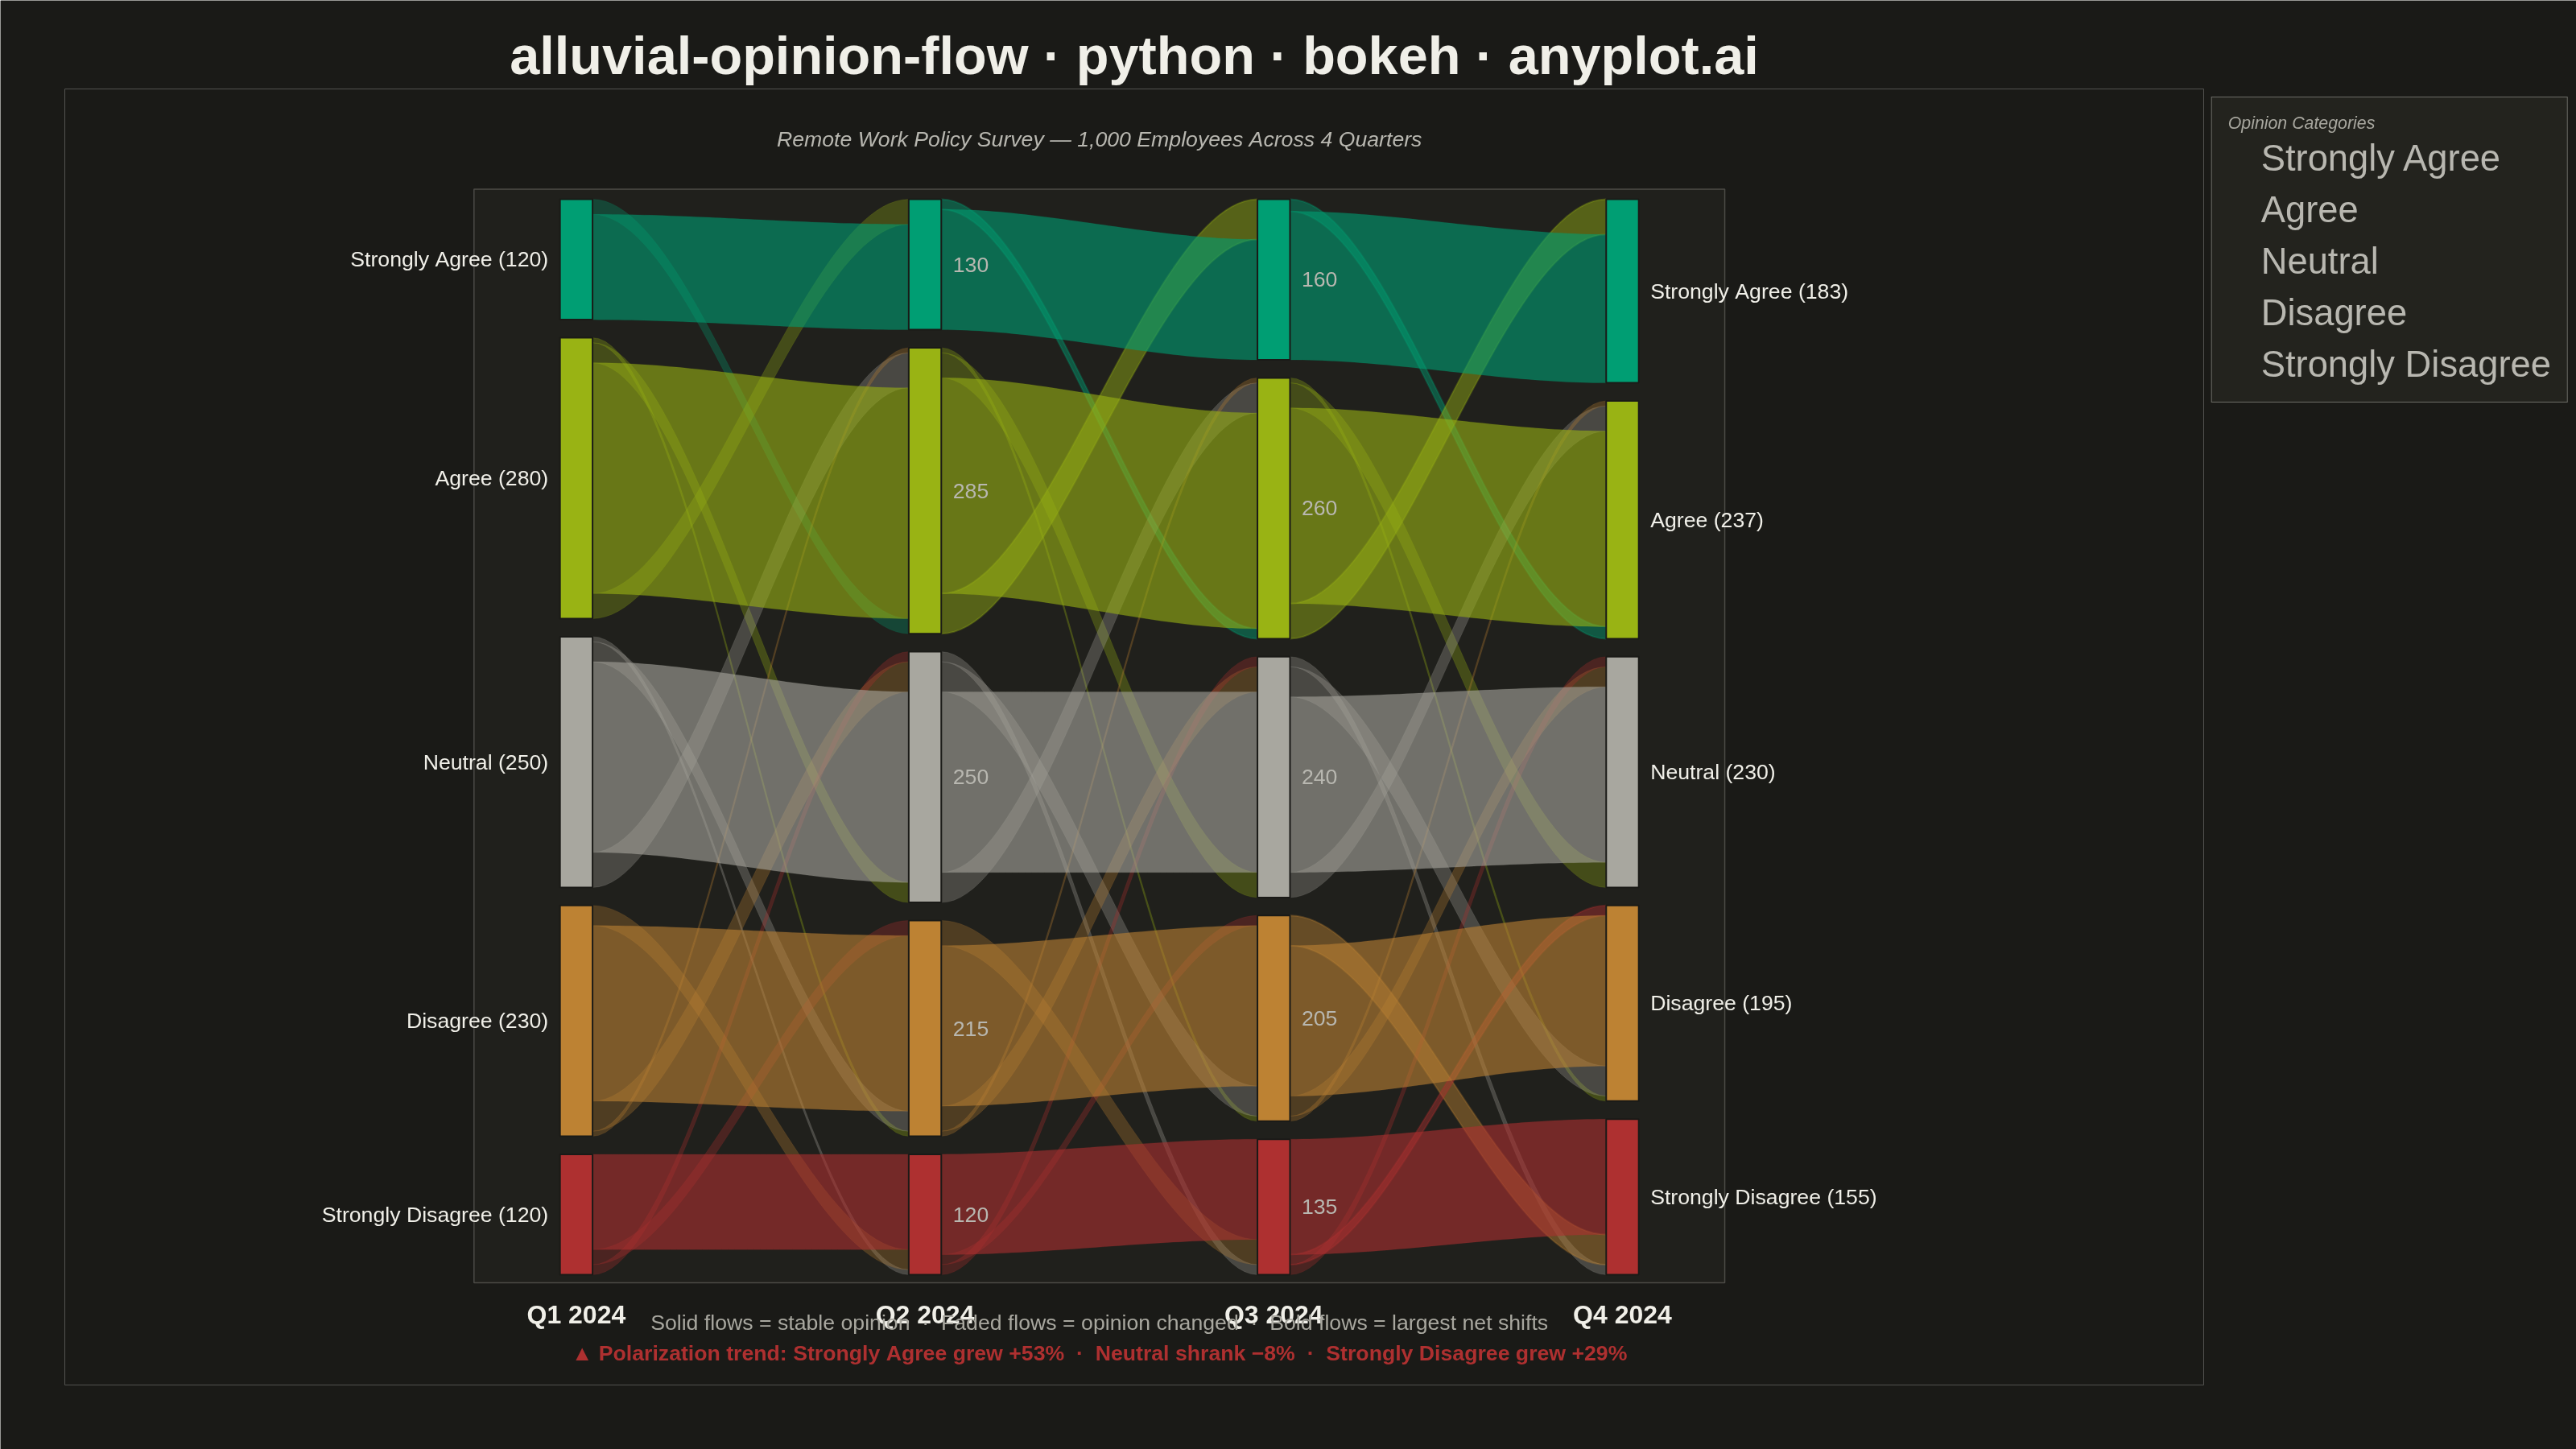
An alluvial/Sankey-style diagram showing how opinions or group memberships shift between survey waves or time periods. Flows connect the same response categories across columns, revealing patterns of opinion change, stability, and polarization. Unlike a basic alluvial diagram, this variant emphasizes distinguishing stable respondents from net changers and displays respondent totals per category at each wave.
""" anyplot.ai
alluvial-opinion-flow: Opinion Flow Diagram
Library: bokeh 3.9.0 | Python 3.13.13
Quality: 87/100 | Updated: 2026-05-30
"""

import io
import os
import sys


# Prevent self-import: this file is named bokeh.py, so Python's path search would
# find it before the installed bokeh package. Remove the script's own directory
# from sys.path so imports resolve to the installed package.
_own_dir = os.path.dirname(os.path.abspath(__file__))
sys.path = [p for p in sys.path if os.path.abspath(p) != _own_dir]

import time
from pathlib import Path

import numpy as np
from bokeh.io import output_file, save
from bokeh.models import ColumnDataSource, HoverTool, Label, Legend, LegendItem, TapTool
from bokeh.plotting import figure
from PIL import Image
from selenium import webdriver
from selenium.webdriver.chrome.options import Options


THEME = os.getenv("ANYPLOT_THEME", "light")

# Imprint palette theme-adaptive chrome
PAGE_BG = "#FAF8F1" if THEME == "light" else "#1A1A17"
ELEVATED_BG = "#FFFDF6" if THEME == "light" else "#242420"
INK = "#1A1A17" if THEME == "light" else "#F0EFE8"
INK_SOFT = "#4A4A44" if THEME == "light" else "#B8B7B0"
INK_MUTED = "#6B6A63" if THEME == "light" else "#A8A79F"

# Data: Remote work policy opinion survey — 1,000 employees across 4 quarterly waves
# Story: Opinions gradually polarize as the debate matures
waves = ["Q1 2024", "Q2 2024", "Q3 2024", "Q4 2024"]
opinions = ["Strongly Agree", "Agree", "Neutral", "Disagree", "Strongly Disagree"]

# Imprint palette with semantic exception: sentiment scale (positive→green, negative→red)
colors = {
    "Strongly Agree": "#009E73",  # Imprint brand green — positive
    "Agree": "#99B314",  # Imprint lime — lighter positive
    "Neutral": INK_MUTED,  # Imprint muted — neutral (theme-adaptive)
    "Disagree": "#BD8233",  # Imprint ochre — cautionary
    "Strongly Disagree": "#AE3030",  # Imprint matte red — negative
}

# Flow transitions between consecutive waves (source, target, respondent_count)
flows_data = [
    # Q1 → Q2
    [
        ("Strongly Agree", "Strongly Agree", 105),
        ("Strongly Agree", "Agree", 15),
        ("Agree", "Strongly Agree", 25),
        ("Agree", "Agree", 230),
        ("Agree", "Neutral", 20),
        ("Agree", "Disagree", 5),
        ("Neutral", "Agree", 35),
        ("Neutral", "Neutral", 190),
        ("Neutral", "Disagree", 20),
        ("Neutral", "Strongly Disagree", 5),
        ("Disagree", "Agree", 5),
        ("Disagree", "Neutral", 30),
        ("Disagree", "Disagree", 175),
        ("Disagree", "Strongly Disagree", 20),
        ("Strongly Disagree", "Neutral", 10),
        ("Strongly Disagree", "Disagree", 15),
        ("Strongly Disagree", "Strongly Disagree", 95),
    ],
    # Q2 → Q3 (polarization intensifies)
    [
        ("Strongly Agree", "Strongly Agree", 120),
        ("Strongly Agree", "Agree", 10),
        ("Agree", "Strongly Agree", 40),
        ("Agree", "Agree", 215),
        ("Agree", "Neutral", 25),
        ("Agree", "Disagree", 5),
        ("Neutral", "Agree", 30),
        ("Neutral", "Neutral", 180),
        ("Neutral", "Disagree", 30),
        ("Neutral", "Strongly Disagree", 10),
        ("Disagree", "Agree", 5),
        ("Disagree", "Neutral", 25),
        ("Disagree", "Disagree", 160),
        ("Disagree", "Strongly Disagree", 25),
        ("Strongly Disagree", "Neutral", 10),
        ("Strongly Disagree", "Disagree", 10),
        ("Strongly Disagree", "Strongly Disagree", 100),
    ],
    # Q3 → Q4 (further polarization)
    [
        ("Strongly Agree", "Strongly Agree", 148),
        ("Strongly Agree", "Agree", 12),
        ("Agree", "Strongly Agree", 35),
        ("Agree", "Agree", 195),
        ("Agree", "Neutral", 25),
        ("Agree", "Disagree", 5),
        ("Neutral", "Agree", 25),
        ("Neutral", "Neutral", 175),
        ("Neutral", "Disagree", 30),
        ("Neutral", "Strongly Disagree", 10),
        ("Disagree", "Agree", 5),
        ("Disagree", "Neutral", 20),
        ("Disagree", "Disagree", 150),
        ("Disagree", "Strongly Disagree", 30),
        ("Strongly Disagree", "Neutral", 10),
        ("Strongly Disagree", "Disagree", 10),
        ("Strongly Disagree", "Strongly Disagree", 115),
    ],
]

# Compute node totals at each wave
node_totals = []
for w_idx in range(len(waves)):
    totals = {}
    if w_idx == 0:
        for op in opinions:
            totals[op] = sum(f[2] for f in flows_data[0] if f[0] == op)
    elif w_idx == len(waves) - 1:
        for op in opinions:
            totals[op] = sum(f[2] for f in flows_data[-1] if f[1] == op)
    else:
        for op in opinions:
            totals[op] = sum(f[2] for f in flows_data[w_idx - 1] if f[1] == op)
    node_totals.append(totals)

# Compute net flows per transition to identify largest shifts for highlighting
net_flows = []
for _w_idx, flows in enumerate(flows_data):
    transition_nets = {}
    for from_op, to_op, count in flows:
        if from_op != to_op:
            key = tuple(sorted([from_op, to_op]))
            if key not in transition_nets:
                transition_nets[key] = 0
            if from_op < to_op:
                transition_nets[key] += count
            else:
                transition_nets[key] -= count
    net_flows.append(transition_nets)

all_net_magnitudes = []
for nets in net_flows:
    all_net_magnitudes.extend(abs(v) for v in nets.values())
net_highlight_threshold = sorted(all_net_magnitudes, reverse=True)[2] if len(all_net_magnitudes) > 2 else 0

# Layout — reversed iteration so Strongly Agree is at top (intuitive positive-at-top convention)
x_positions = [0, 1.5, 3.0, 4.5]
node_width = 0.14
gap = 18
layout_order = list(reversed(opinions))  # bottom-to-top: SD, D, N, A, SA

node_positions = []
for w_idx in range(len(waves)):
    positions = {}
    y_cursor = 0
    for op in layout_order:
        height = node_totals[w_idx][op]
        positions[op] = {"y_start": y_cursor, "y_end": y_cursor + height}
        y_cursor += height + gap
    node_positions.append(positions)

max_y = max(node_positions[w][op]["y_end"] for w in range(len(waves)) for op in opinions)

# Create figure — 3200×1800 landscape, toolbar disabled for correct PNG dimensions
p = figure(
    width=3200,
    height=1800,
    title="alluvial-opinion-flow · python · bokeh · anyplot.ai",
    x_range=(-2.2, 7.0),
    y_range=(-110, max_y + 110),
    tools="",
    toolbar_location=None,
    min_border_bottom=80,
    min_border_left=80,
    min_border_top=110,
    min_border_right=80,
)

# Style — theme-adaptive chrome
p.title.text_font_size = "50pt"
p.title.text_font_style = "bold"
p.title.align = "center"
p.title.text_color = INK
p.xgrid.visible = False
p.ygrid.visible = False
p.xaxis.visible = False
p.yaxis.visible = False
p.outline_line_color = None
p.background_fill_color = PAGE_BG
p.border_fill_color = PAGE_BG

# Subtle background panel behind alluvial area
p.quad(
    left=x_positions[0] - node_width - 0.3,
    right=x_positions[-1] + node_width + 0.3,
    top=max_y + 10,
    bottom=-8,
    fill_color=ELEVATED_BG,
    fill_alpha=0.6,
    line_color=INK_SOFT,
    line_width=1.5,
    line_alpha=0.3,
)

# Subtitle
subtitle = Label(
    x=2.25,
    y=max_y + 72,
    text="Remote Work Policy Survey — 1,000 Employees Across 4 Quarters",
    text_font_size="20pt",
    text_align="center",
    text_baseline="top",
    text_color=INK_SOFT,
    text_font_style="italic",
)
p.add_layout(subtitle)

# Precompute all flow ribbon data for ColumnDataSource-based rendering
n_points = 50
t_param = np.linspace(0, 1, n_points)

flow_xs_list = []
flow_ys_list = []
flow_colors = []
flow_alphas = []
flow_line_widths = []
flow_from_labels = []
flow_to_labels = []
flow_counts = []
flow_wave_labels = []
flow_types = []

for w_idx, flows in enumerate(flows_data):
    x_start = x_positions[w_idx] + node_width / 2
    x_end = x_positions[w_idx + 1] - node_width / 2

    source_cursors = {op: node_positions[w_idx][op]["y_start"] for op in opinions}
    target_cursors = {op: node_positions[w_idx + 1][op]["y_start"] for op in opinions}

    for from_op, to_op, count in flows:
        if count == 0:
            continue

        y_src_bottom = source_cursors[from_op]
        y_src_top = y_src_bottom + count
        source_cursors[from_op] = y_src_top

        y_tgt_bottom = target_cursors[to_op]
        y_tgt_top = y_tgt_bottom + count
        target_cursors[to_op] = y_tgt_top

        is_stable = from_op == to_op

        is_net_highlight = False
        if not is_stable:
            key = tuple(sorted([from_op, to_op]))
            net_mag = abs(net_flows[w_idx].get(key, 0))
            is_net_highlight = net_mag >= net_highlight_threshold

        # Cubic bezier control points
        cx0 = x_start + (x_end - x_start) / 3
        cx1 = x_start + 2 * (x_end - x_start) / 3

        x_curve = (
            (1 - t_param) ** 3 * x_start
            + 3 * (1 - t_param) ** 2 * t_param * cx0
            + 3 * (1 - t_param) * t_param**2 * cx1
            + t_param**3 * x_end
        )
        y_top = (
            (1 - t_param) ** 3 * y_src_top
            + 3 * (1 - t_param) ** 2 * t_param * y_src_top
            + 3 * (1 - t_param) * t_param**2 * y_tgt_top
            + t_param**3 * y_tgt_top
        )
        y_bottom = (
            (1 - t_param) ** 3 * y_src_bottom
            + 3 * (1 - t_param) ** 2 * t_param * y_src_bottom
            + 3 * (1 - t_param) * t_param**2 * y_tgt_bottom
            + t_param**3 * y_tgt_bottom
        )

        xs = list(x_curve) + list(x_curve[::-1])
        ys = list(y_top) + list(y_bottom[::-1])

        if is_stable:
            fill_alpha = 0.6
            line_w = 0.5
        elif is_net_highlight:
            fill_alpha = 0.45
            line_w = 2.0
        else:
            fill_alpha = 0.30  # raised from 0.2 for better visibility in PNG
            line_w = 0.5

        flow_xs_list.append(xs)
        flow_ys_list.append(ys)
        flow_colors.append(colors[from_op])
        flow_alphas.append(fill_alpha)
        flow_line_widths.append(line_w)
        flow_from_labels.append(from_op)
        flow_to_labels.append(to_op)
        flow_counts.append(count)
        flow_wave_labels.append(f"{waves[w_idx]} → {waves[w_idx + 1]}")
        flow_types.append("Stable" if is_stable else "Changed")

# Render changers first (behind), then stable on top
sort_order = sorted(range(len(flow_types)), key=lambda i: flow_types[i] == "Stable")

flow_source = ColumnDataSource(
    data={
        "xs": [flow_xs_list[i] for i in sort_order],
        "ys": [flow_ys_list[i] for i in sort_order],
        "color": [flow_colors[i] for i in sort_order],
        "alpha": [flow_alphas[i] for i in sort_order],
        "line_width": [flow_line_widths[i] for i in sort_order],
        "from_op": [flow_from_labels[i] for i in sort_order],
        "to_op": [flow_to_labels[i] for i in sort_order],
        "count": [flow_counts[i] for i in sort_order],
        "wave": [flow_wave_labels[i] for i in sort_order],
        "flow_type": [flow_types[i] for i in sort_order],
    }
)

flow_renderer = p.patches(
    xs="xs",
    ys="ys",
    fill_color="color",
    fill_alpha="alpha",
    line_color="color",
    line_alpha=0.3,
    line_width="line_width",
    source=flow_source,
)

# HoverTool for flow ribbons
hover = HoverTool(
    renderers=[flow_renderer],
    tooltips=[
        ("Transition", "@wave"),
        ("From", "@from_op"),
        ("To", "@to_op"),
        ("Respondents", "@count"),
        ("Type", "@flow_type"),
    ],
    point_policy="follow_mouse",
)
p.add_tools(hover)

# TapTool with selection glyphs for interactive highlighting
flow_renderer.selection_glyph = flow_renderer.glyph.clone()
flow_renderer.selection_glyph.fill_alpha = 0.9
flow_renderer.selection_glyph.line_alpha = 0.9
flow_renderer.selection_glyph.line_width = 3
flow_renderer.nonselection_glyph = flow_renderer.glyph.clone()
flow_renderer.nonselection_glyph.fill_alpha = 0.1
flow_renderer.nonselection_glyph.line_alpha = 0.1
tap = TapTool(renderers=[flow_renderer])
p.add_tools(tap)

# Draw nodes
node_left = []
node_right = []
node_top = []
node_bottom = []
node_colors_list = []
node_op_labels = []
node_wave_labels = []
node_count_labels = []

for w_idx in range(len(waves)):
    x = x_positions[w_idx]
    for op in opinions:
        y_start = node_positions[w_idx][op]["y_start"]
        y_end = node_positions[w_idx][op]["y_end"]
        height = y_end - y_start
        if height > 0:
            node_left.append(x - node_width / 2)
            node_right.append(x + node_width / 2)
            node_top.append(y_end)
            node_bottom.append(y_start)
            node_colors_list.append(colors[op])
            node_op_labels.append(op)
            node_wave_labels.append(waves[w_idx])
            node_count_labels.append(str(int(height)))

node_source = ColumnDataSource(
    data={
        "left": node_left,
        "right": node_right,
        "top": node_top,
        "bottom": node_bottom,
        "color": node_colors_list,
        "opinion": node_op_labels,
        "wave": node_wave_labels,
        "count": node_count_labels,
    }
)

p.quad(
    left="left",
    right="right",
    top="top",
    bottom="bottom",
    fill_color="color",
    line_color=PAGE_BG,
    line_width=2,
    source=node_source,
)

# Node text labels and legend renderers
legend_renderers = {}
for w_idx in range(len(waves)):
    x = x_positions[w_idx]
    for op in opinions:
        y_start = node_positions[w_idx][op]["y_start"]
        y_end = node_positions[w_idx][op]["y_end"]
        height = y_end - y_start

        if height > 0:
            if op not in legend_renderers:
                r = p.quad(
                    left=x - node_width / 2,
                    right=x + node_width / 2,
                    top=y_end,
                    bottom=y_start,
                    fill_color=colors[op],
                    line_color=colors[op],
                    fill_alpha=0,
                    line_alpha=0,
                )
                legend_renderers[op] = r

            y_mid = (y_start + y_end) / 2
            if w_idx == 0:
                label = Label(
                    x=x - node_width / 2 - 0.05,
                    y=y_mid,
                    text=f"{op} ({int(height)})",
                    text_font_size="20pt",
                    text_baseline="middle",
                    text_align="right",
                    text_color=INK,
                )
                p.add_layout(label)
            elif w_idx == len(waves) - 1:
                label = Label(
                    x=x + node_width / 2 + 0.05,
                    y=y_mid,
                    text=f"{op} ({int(height)})",
                    text_font_size="20pt",
                    text_baseline="middle",
                    text_color=INK,
                )
                p.add_layout(label)
            else:
                label = Label(
                    x=x + node_width / 2 + 0.05,
                    y=y_mid,
                    text=str(int(height)),
                    text_font_size="20pt",
                    text_baseline="middle",
                    text_color=INK_SOFT,
                )
                p.add_layout(label)

# Wave column headers
for w_idx, wave in enumerate(waves):
    label = Label(
        x=x_positions[w_idx],
        y=-25,
        text=wave,
        text_font_size="24pt",
        text_align="center",
        text_baseline="top",
        text_color=INK,
        text_font_style="bold",
    )
    p.add_layout(label)

# Legend
legend_items = [LegendItem(label=op, renderers=[legend_renderers[op]]) for op in opinions]
legend = Legend(
    items=legend_items,
    location="top_right",
    label_text_font_size="34pt",
    label_text_color=INK_SOFT,
    glyph_width=36,
    glyph_height=36,
    spacing=12,
    padding=20,
    background_fill_alpha=0.92,
    background_fill_color=ELEVATED_BG,
    border_line_color=INK_SOFT,
    border_line_width=1.5,
    title="Opinion Categories",
    title_text_font_size="16pt",
    title_text_color=INK_MUTED,
    title_text_font_style="italic",
)
p.add_layout(legend, "right")

# Opacity encoding note
opacity_note = Label(
    x=2.25,
    y=-60,
    text="Solid flows = stable opinion  ·  Faded flows = opinion changed  ·  Bold flows = largest net shifts",
    text_font_size="20pt",
    text_align="center",
    text_color=INK_MUTED,
)
p.add_layout(opacity_note)

# Data storytelling: annotate key polarization trend
trend_annotation = Label(
    x=2.25,
    y=-90,
    text="▲ Polarization trend: Strongly Agree grew +53%  ·  Neutral shrank −8%  ·  Strongly Disagree grew +29%",
    text_font_size="20pt",
    text_align="center",
    text_color="#AE3030",
    text_font_style="bold",
)
p.add_layout(trend_annotation)

# Save HTML artifact (interactive catalog output)
output_file(f"plot-{THEME}.html")
save(p)

# Screenshot via headless Chrome — Chrome's viewport is ~139px shorter than
# --window-size, so use H + 200 buffer then crop to exact canvas dimensions.
W, H = 3200, 1800
opts = Options()
for arg in (
    "--headless=new",
    "--no-sandbox",
    "--disable-dev-shm-usage",
    "--disable-gpu",
    f"--window-size={W},{H + 200}",
    "--hide-scrollbars",
    "--force-device-scale-factor=1",
):
    opts.add_argument(arg)
driver = webdriver.Chrome(options=opts)
driver.set_window_size(W, H + 200)
driver.get(f"file://{Path(f'plot-{THEME}.html').resolve()}")
time.sleep(3)
raw = driver.get_screenshot_as_png()
driver.quit()
Image.open(io.BytesIO(raw)).crop((0, 0, W, H)).save(f"plot-{THEME}.png")
Runnable source as JSON, for any HTTP client: https://api.anyplot.ai/specs/alluvial-opinion-flow/bokeh/code. Any spec id and library id listed in llms-full.txt fit the same URL shape; every URL below is complete and callable.
{
  "spec_id": "alluvial-opinion-flow",
  "language": "python",
  "library": "bokeh",
  "page": "https://anyplot.ai/alluvial-opinion-flow/python/bokeh",
  "hub": "https://anyplot.ai/alluvial-opinion-flow",
  "code_json": "https://api.anyplot.ai/specs/alluvial-opinion-flow/bokeh/code",
  "spec_json": "https://api.anyplot.ai/specs/alluvial-opinion-flow",
  "render_light_png": "https://storage.googleapis.com/anyplot-images/plots/alluvial-opinion-flow/python/bokeh/plot-light.png",
  "render_dark_png": "https://storage.googleapis.com/anyplot-images/plots/alluvial-opinion-flow/python/bokeh/plot-dark.png",
  "interactive_light_html": "https://storage.googleapis.com/anyplot-images/plots/alluvial-opinion-flow/python/bokeh/plot-light.html",
  "interactive_dark_html": "https://storage.googleapis.com/anyplot-images/plots/alluvial-opinion-flow/python/bokeh/plot-dark.html",
  "quality_score": 87.0,
  "license": "MIT",
  "guide": "https://anyplot.ai/llms.txt"
}
Part of Opinion Flow Diagram on anyplot.ai.