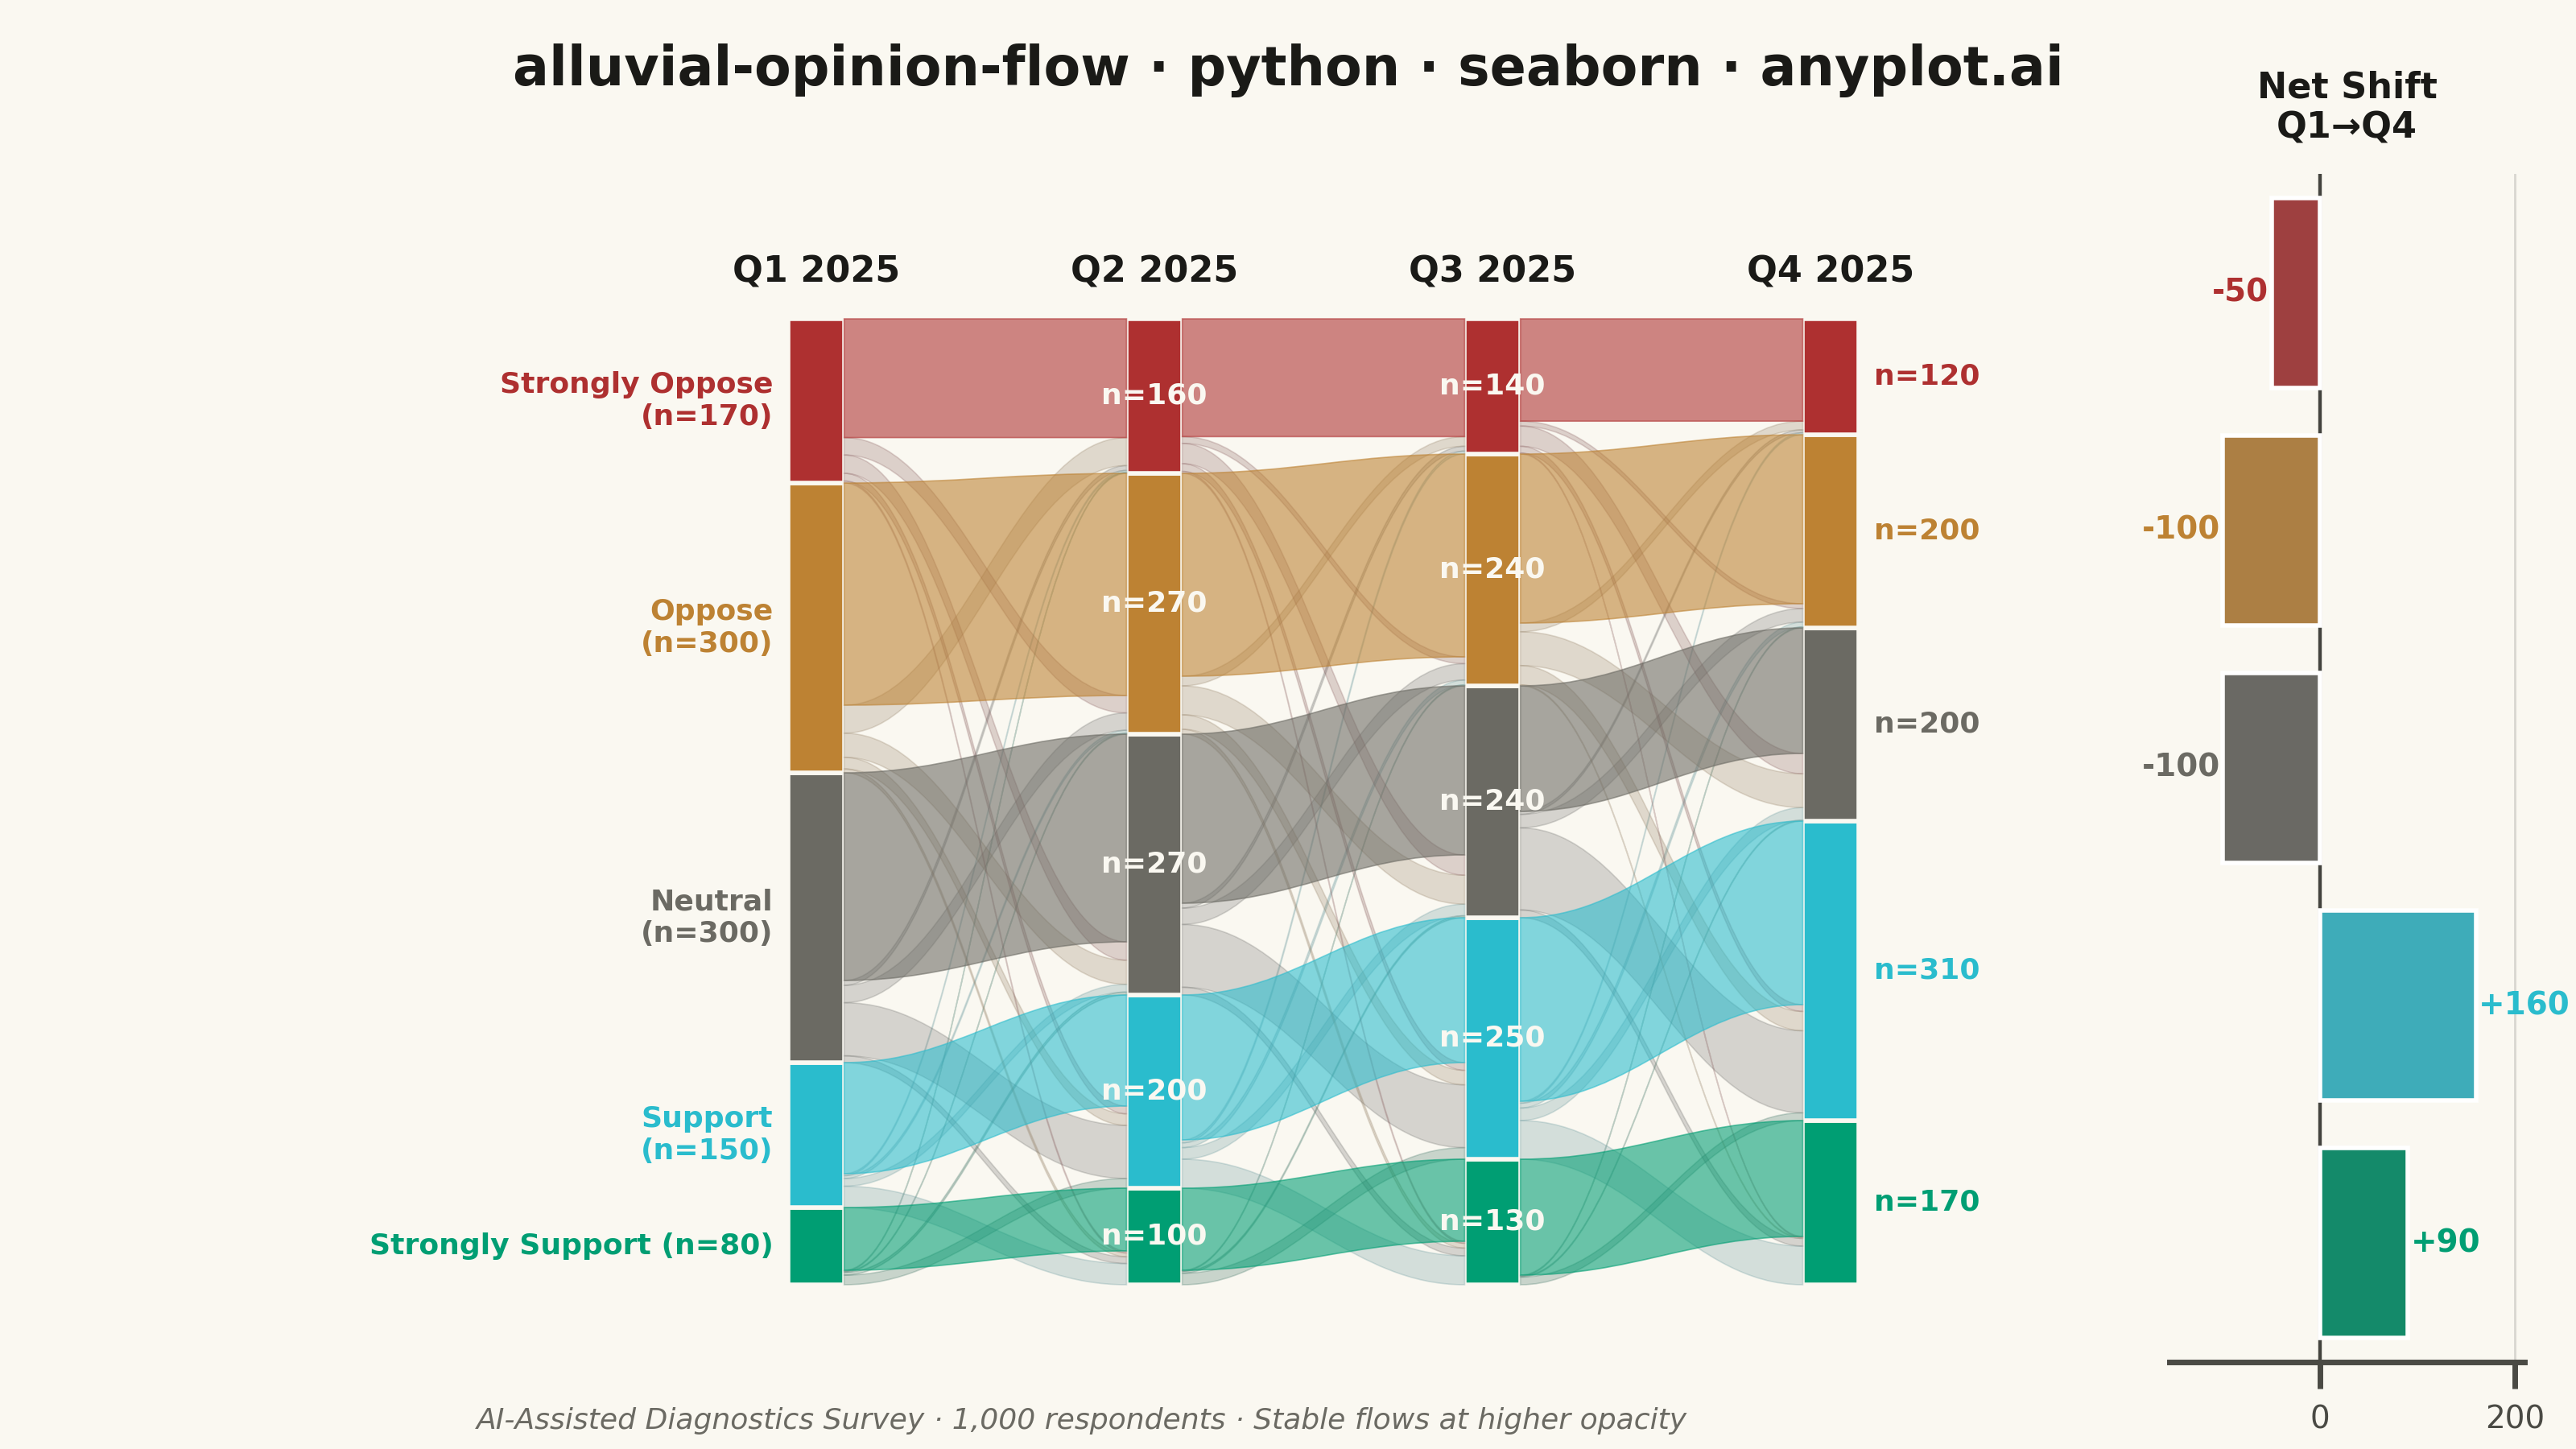
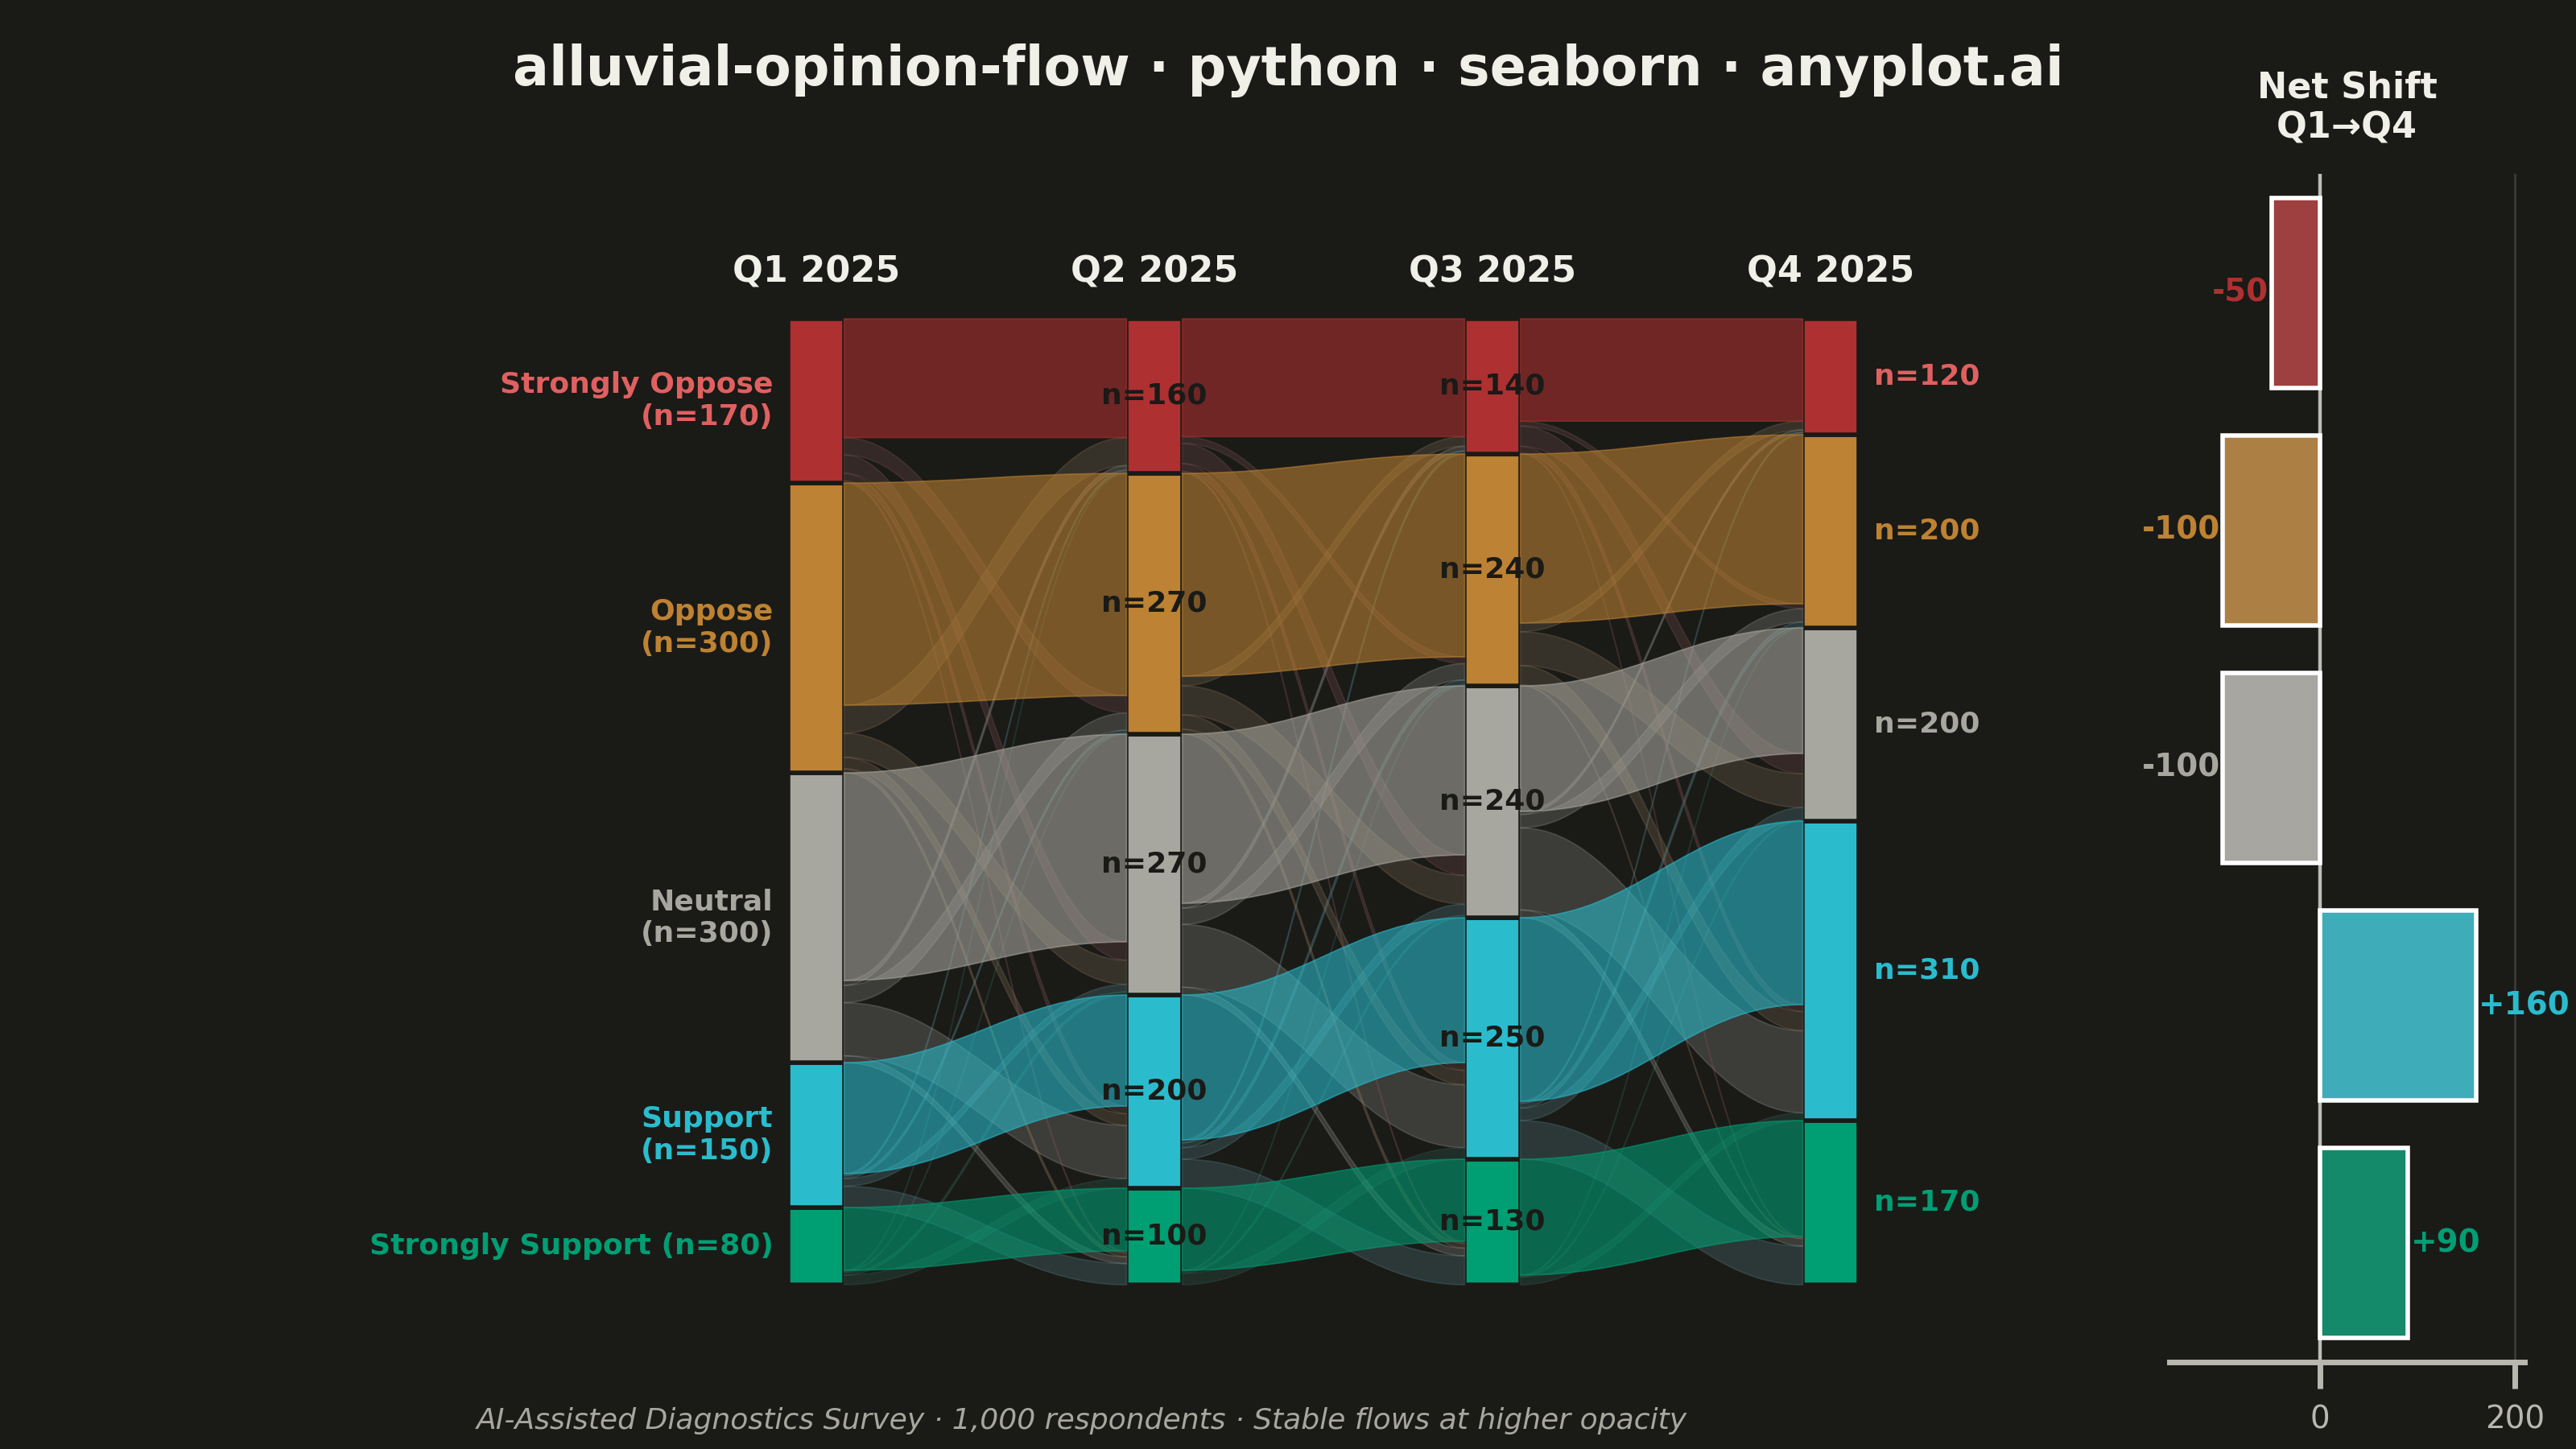
An alluvial/Sankey-style diagram showing how opinions or group memberships shift between survey waves or time periods. Flows connect the same response categories across columns, revealing patterns of opinion change, stability, and polarization. Unlike a basic alluvial diagram, this variant emphasizes distinguishing stable respondents from net changers and displays respondent totals per category at each wave.
""" anyplot.ai
alluvial-opinion-flow: Opinion Flow Diagram
Library: seaborn 0.13.2 | Python 3.13.13
Quality: 87/100 | Updated: 2026-05-30
"""

import os

import matplotlib.patches as mpatches
import matplotlib.pyplot as plt
import numpy as np
import pandas as pd
import seaborn as sns
from matplotlib.path import Path


THEME = os.getenv("ANYPLOT_THEME", "light")
PAGE_BG = "#FAF8F1" if THEME == "light" else "#1A1A17"
ELEVATED_BG = "#FFFDF6" if THEME == "light" else "#242420"
INK = "#1A1A17" if THEME == "light" else "#F0EFE8"
INK_SOFT = "#4A4A44" if THEME == "light" else "#B8B7B0"
INK_MUTED = "#6B6A63" if THEME == "light" else "#A8A79F"

sns.set_theme(
    style="ticks",
    rc={
        "figure.facecolor": PAGE_BG,
        "axes.facecolor": PAGE_BG,
        "axes.edgecolor": INK_SOFT,
        "axes.labelcolor": INK,
        "text.color": INK,
        "xtick.color": INK_SOFT,
        "ytick.color": INK_SOFT,
        "grid.color": INK,
        "grid.alpha": 0.15,
        "legend.facecolor": ELEVATED_BG,
        "legend.edgecolor": INK_SOFT,
    },
)

# Data: AI-assisted diagnostics policy survey, 1,000 respondents over 4 quarterly waves
# Pattern: gradual drift from net-skeptical to net-supportive as clinical evidence grows
waves = ["Q1 2025", "Q2 2025", "Q3 2025", "Q4 2025"]
categories = ["Strongly Support", "Support", "Neutral", "Oppose", "Strongly Oppose"]

# Imprint palette — semantic mapping: positive→green/cyan, neutral→muted, negative→ochre/red
category_colors = {
    "Strongly Support": "#009E73",
    "Support": "#2ABCCD",
    "Neutral": INK_MUTED,
    "Oppose": "#BD8233",
    "Strongly Oppose": "#AE3030",
}

# Desaturated variants for changing flows (seaborn-native desaturation — lower ratio = more muted)
changer_colors = {cat: sns.desaturate(col, 0.35) for cat, col in category_colors.items()}

# Label colors — lighter red for Strongly Oppose on dark surface to improve contrast
label_colors = dict(category_colors)
if THEME == "dark":
    label_colors["Strongly Oppose"] = "#E06060"

# Counts per category at each wave (row=category, col=wave; total=1000 per wave)
# Gradual drift: skeptics convert as AI diagnostics prove effective across trials
counts = np.array(
    [
        [80, 100, 130, 170],  # Strongly Support
        [150, 200, 250, 310],  # Support
        [300, 270, 240, 200],  # Neutral
        [300, 270, 240, 200],  # Oppose
        [170, 160, 140, 120],  # Strongly Oppose
    ]
)

# Flow transitions (row sums = source wave counts, col sums = target wave counts)
flows = [
    {  # Q1 → Q2
        ("Strongly Support", "Strongly Support"): 65,
        ("Strongly Support", "Support"): 10,
        ("Strongly Support", "Neutral"): 3,
        ("Strongly Support", "Oppose"): 1,
        ("Strongly Support", "Strongly Oppose"): 1,
        ("Support", "Strongly Support"): 22,
        ("Support", "Support"): 115,
        ("Support", "Neutral"): 8,
        ("Support", "Oppose"): 3,
        ("Support", "Strongly Oppose"): 2,
        ("Neutral", "Strongly Support"): 7,
        ("Neutral", "Support"): 55,
        ("Neutral", "Neutral"): 215,
        ("Neutral", "Oppose"): 18,
        ("Neutral", "Strongly Oppose"): 5,
        ("Oppose", "Strongly Support"): 4,
        ("Oppose", "Support"): 12,
        ("Oppose", "Neutral"): 25,
        ("Oppose", "Oppose"): 230,
        ("Oppose", "Strongly Oppose"): 29,
        ("Strongly Oppose", "Strongly Support"): 2,
        ("Strongly Oppose", "Support"): 8,
        ("Strongly Oppose", "Neutral"): 19,
        ("Strongly Oppose", "Oppose"): 18,
        ("Strongly Oppose", "Strongly Oppose"): 123,
    },
    {  # Q2 → Q3
        ("Strongly Support", "Strongly Support"): 85,
        ("Strongly Support", "Support"): 12,
        ("Strongly Support", "Neutral"): 2,
        ("Strongly Support", "Oppose"): 1,
        ("Strongly Support", "Strongly Oppose"): 0,
        ("Support", "Strongly Support"): 30,
        ("Support", "Support"): 150,
        ("Support", "Neutral"): 12,
        ("Support", "Oppose"): 5,
        ("Support", "Strongly Oppose"): 3,
        ("Neutral", "Strongly Support"): 8,
        ("Neutral", "Support"): 65,
        ("Neutral", "Neutral"): 175,
        ("Neutral", "Oppose"): 17,
        ("Neutral", "Strongly Oppose"): 5,
        ("Oppose", "Strongly Support"): 5,
        ("Oppose", "Support"): 15,
        ("Oppose", "Neutral"): 30,
        ("Oppose", "Oppose"): 210,
        ("Oppose", "Strongly Oppose"): 10,
        ("Strongly Oppose", "Strongly Support"): 2,
        ("Strongly Oppose", "Support"): 8,
        ("Strongly Oppose", "Neutral"): 21,
        ("Strongly Oppose", "Oppose"): 7,
        ("Strongly Oppose", "Strongly Oppose"): 122,
    },
    {  # Q3 → Q4
        ("Strongly Support", "Strongly Support"): 120,
        ("Strongly Support", "Support"): 8,
        ("Strongly Support", "Neutral"): 1,
        ("Strongly Support", "Oppose"): 1,
        ("Strongly Support", "Strongly Oppose"): 0,
        ("Support", "Strongly Support"): 40,
        ("Support", "Support"): 190,
        ("Support", "Neutral"): 13,
        ("Support", "Oppose"): 5,
        ("Support", "Strongly Oppose"): 2,
        ("Neutral", "Strongly Support"): 8,
        ("Neutral", "Support"): 85,
        ("Neutral", "Neutral"): 130,
        ("Neutral", "Oppose"): 14,
        ("Neutral", "Strongly Oppose"): 3,
        ("Oppose", "Strongly Support"): 1,
        ("Oppose", "Support"): 20,
        ("Oppose", "Neutral"): 35,
        ("Oppose", "Oppose"): 175,
        ("Oppose", "Strongly Oppose"): 9,
        ("Strongly Oppose", "Strongly Support"): 1,
        ("Strongly Oppose", "Support"): 7,
        ("Strongly Oppose", "Neutral"): 21,
        ("Strongly Oppose", "Oppose"): 5,
        ("Strongly Oppose", "Strongly Oppose"): 106,
    },
]

# Figure: main alluvial panel + net change sidebar
fig = plt.figure(figsize=(8, 4.5), dpi=400)
fig.patch.set_facecolor(PAGE_BG)
gs = fig.add_gridspec(1, 2, width_ratios=[5, 1])
ax = fig.add_subplot(gs[0, 0])
ax_net = fig.add_subplot(gs[0, 1])
ax.set_facecolor(PAGE_BG)
ax_net.set_facecolor(PAGE_BG)

# Main alluvial diagram
n_waves = len(waves)
x_positions = np.linspace(0, 10, n_waves)
bar_width = 0.55
total_height = 100
node_positions = {}

for wave_idx, wave in enumerate(waves):
    x = x_positions[wave_idx]
    wave_total = counts[:, wave_idx].sum()
    y_bottom = 0

    for cat_idx, category in enumerate(categories):
        height = (counts[cat_idx, wave_idx] / wave_total) * total_height
        y_top = y_bottom + height
        node_positions[(wave_idx, category)] = (y_bottom, y_top)

        ax.add_patch(
            mpatches.Rectangle(
                (x - bar_width / 2, y_bottom),
                bar_width,
                height,
                facecolor=category_colors[category],
                edgecolor=PAGE_BG,
                linewidth=1.0,
            )
        )

        count_val = counts[cat_idx, wave_idx]
        if wave_idx == 0:
            # Single-line for short nodes (≤ 8% of total) to prevent crowding
            label_text = f"{category} (n={count_val})" if height <= 8 else f"{category}\n(n={count_val})"
            ax.text(
                x - bar_width / 2 - 0.15,
                (y_bottom + y_top) / 2,
                label_text,
                ha="right",
                va="center",
                fontsize=6.5,
                fontweight="bold",
                color=label_colors[category],
            )
        elif wave_idx == n_waves - 1:
            ax.text(
                x + bar_width / 2 + 0.15,
                (y_bottom + y_top) / 2,
                f"n={count_val}",
                ha="left",
                va="center",
                fontsize=6.5,
                fontweight="bold",
                color=label_colors[category],
            )
        elif height > 9:
            ax.text(
                x,
                (y_bottom + y_top) / 2,
                f"n={count_val}",
                ha="center",
                va="center",
                fontsize=6.5,
                fontweight="bold",
                color=PAGE_BG,
            )
        y_bottom = y_top

    ax.text(x, total_height + 3, wave, ha="center", va="bottom", fontsize=8, fontweight="bold", color=INK)

# Draw Bezier flow bands — changers first (low z), stable flows on top (high z)
for flow_idx, flow_dict in enumerate(flows):
    x0 = x_positions[flow_idx]
    x1 = x_positions[flow_idx + 1]
    wave0_total = counts[:, flow_idx].sum()
    wave1_total = counts[:, flow_idx + 1].sum()

    sorted_flows = sorted(flow_dict.items(), key=lambda item: item[0][0] == item[0][1])
    source_offsets = {cat: node_positions[(flow_idx, cat)][0] for cat in categories}
    target_offsets = {cat: node_positions[(flow_idx + 1, cat)][0] for cat in categories}

    for (source_cat, target_cat), flow_value in sorted_flows:
        if flow_value <= 0:
            continue

        source_height = (flow_value / wave0_total) * total_height
        target_height = (flow_value / wave1_total) * total_height

        y0_bot = source_offsets[source_cat]
        y0_top = y0_bot + source_height
        y1_bot = target_offsets[target_cat]
        y1_top = y1_bot + target_height

        band_x0 = x0 + bar_width / 2
        band_x1 = x1 - bar_width / 2
        cx0 = band_x0 + 0.4 * (band_x1 - band_x0)
        cx1 = band_x0 + 0.6 * (band_x1 - band_x0)

        verts = [
            (band_x0, y0_bot),
            (cx0, y0_bot),
            (cx1, y1_bot),
            (band_x1, y1_bot),
            (band_x1, y1_top),
            (cx1, y1_top),
            (cx0, y0_top),
            (band_x0, y0_top),
            (band_x0, y0_bot),
        ]
        codes = [
            Path.MOVETO,
            Path.CURVE4,
            Path.CURVE4,
            Path.CURVE4,
            Path.LINETO,
            Path.CURVE4,
            Path.CURVE4,
            Path.CURVE4,
            Path.CLOSEPOLY,
        ]
        is_stable = source_cat == target_cat
        alpha = 0.58 if is_stable else 0.25
        color = category_colors[source_cat] if is_stable else changer_colors[source_cat]
        ax.add_patch(
            mpatches.PathPatch(Path(verts, codes), facecolor=color, edgecolor=color, linewidth=0.3, alpha=alpha)
        )

        source_offsets[source_cat] = y0_top
        target_offsets[target_cat] = y1_top

ax.set_xlim(-5.0, 12.5)
ax.set_ylim(-8, 115)
ax.set_aspect("auto")
ax.set_xticks([])
ax.set_yticks([])
sns.despine(ax=ax, left=True, bottom=True, top=True, right=True)

# Net change sidebar — seaborn barplot colored by category
net_changes = counts[:, -1] - counts[:, 0]
df_net = pd.DataFrame({"Category": categories, "Net Change": net_changes.tolist()})
cat_order = categories[::-1]

sns.barplot(
    data=df_net,
    x="Net Change",
    y="Category",
    hue="Category",
    palette=category_colors,
    legend=False,
    order=cat_order,
    ax=ax_net,
)

for i, cat in enumerate(cat_order):
    val = net_changes[categories.index(cat)]
    sign = "+" if val > 0 else ""
    offset = 3 if val >= 0 else -3
    ha = "left" if val >= 0 else "right"
    ax_net.text(
        val + offset, i, f"{sign}{val}", ha=ha, va="center", fontsize=7, fontweight="bold", color=category_colors[cat]
    )

ax_net.set_title("Net Shift\nQ1→Q4", fontsize=8, fontweight="bold", pad=8, color=INK)
ax_net.set_ylabel("")
ax_net.set_xlabel("")
ax_net.tick_params(axis="y", length=0)
ax_net.set_yticklabels([])
ax_net.tick_params(axis="x", labelsize=7, colors=INK_SOFT)
ax_net.axvline(0, color=INK_SOFT, linewidth=0.8, zorder=0)
ax_net.set_xlim(-155, 210)
ax_net.xaxis.grid(True, alpha=0.15, linewidth=0.5, color=INK)
sns.despine(ax=ax_net, left=True)

# Title and footnote
title = "alluvial-opinion-flow · python · seaborn · anyplot.ai"
n_chars = len(title)
ratio = 67 / n_chars if n_chars > 67 else 1.0
title_fontsize = max(round(12 * ratio), 8)
fig.suptitle(title, fontsize=title_fontsize, fontweight="bold", color=INK, y=0.97)
fig.text(
    0.42,
    0.01,
    "AI-Assisted Diagnostics Survey · 1,000 respondents · Stable flows at higher opacity",
    ha="center",
    va="bottom",
    fontsize=6.5,
    color=INK_MUTED,
    style="italic",
)

fig.subplots_adjust(left=0.12, right=0.98, top=0.88, bottom=0.06, wspace=0.08)
plt.savefig(f"plot-{THEME}.png", dpi=400, facecolor=PAGE_BG)
Runnable source as JSON, for any HTTP client: https://api.anyplot.ai/specs/alluvial-opinion-flow/seaborn/code. Any spec id and library id listed in llms-full.txt fit the same URL shape; every URL below is complete and callable.
{
  "spec_id": "alluvial-opinion-flow",
  "language": "python",
  "library": "seaborn",
  "page": "https://anyplot.ai/alluvial-opinion-flow/python/seaborn",
  "hub": "https://anyplot.ai/alluvial-opinion-flow",
  "code_json": "https://api.anyplot.ai/specs/alluvial-opinion-flow/seaborn/code",
  "spec_json": "https://api.anyplot.ai/specs/alluvial-opinion-flow",
  "render_light_png": "https://storage.googleapis.com/anyplot-images/plots/alluvial-opinion-flow/python/seaborn/plot-light.png",
  "render_dark_png": "https://storage.googleapis.com/anyplot-images/plots/alluvial-opinion-flow/python/seaborn/plot-dark.png",
  "quality_score": 87.0,
  "license": "MIT",
  "guide": "https://anyplot.ai/llms.txt"
}
Part of Opinion Flow Diagram on anyplot.ai.