The same plot in 14 other libraries — JavaScript: Chart.js, D3.js, Apache ECharts, Highcharts; Python: Altair, Bokeh, lets-plot, Matplotlib, Plotly, plotnine, Pygal, Seaborn; R: ggplot2; Julia: Makie.jl. Compare all 15 side by side: Horizontal Bar Chart in Python, R, Julia and JavaScript.
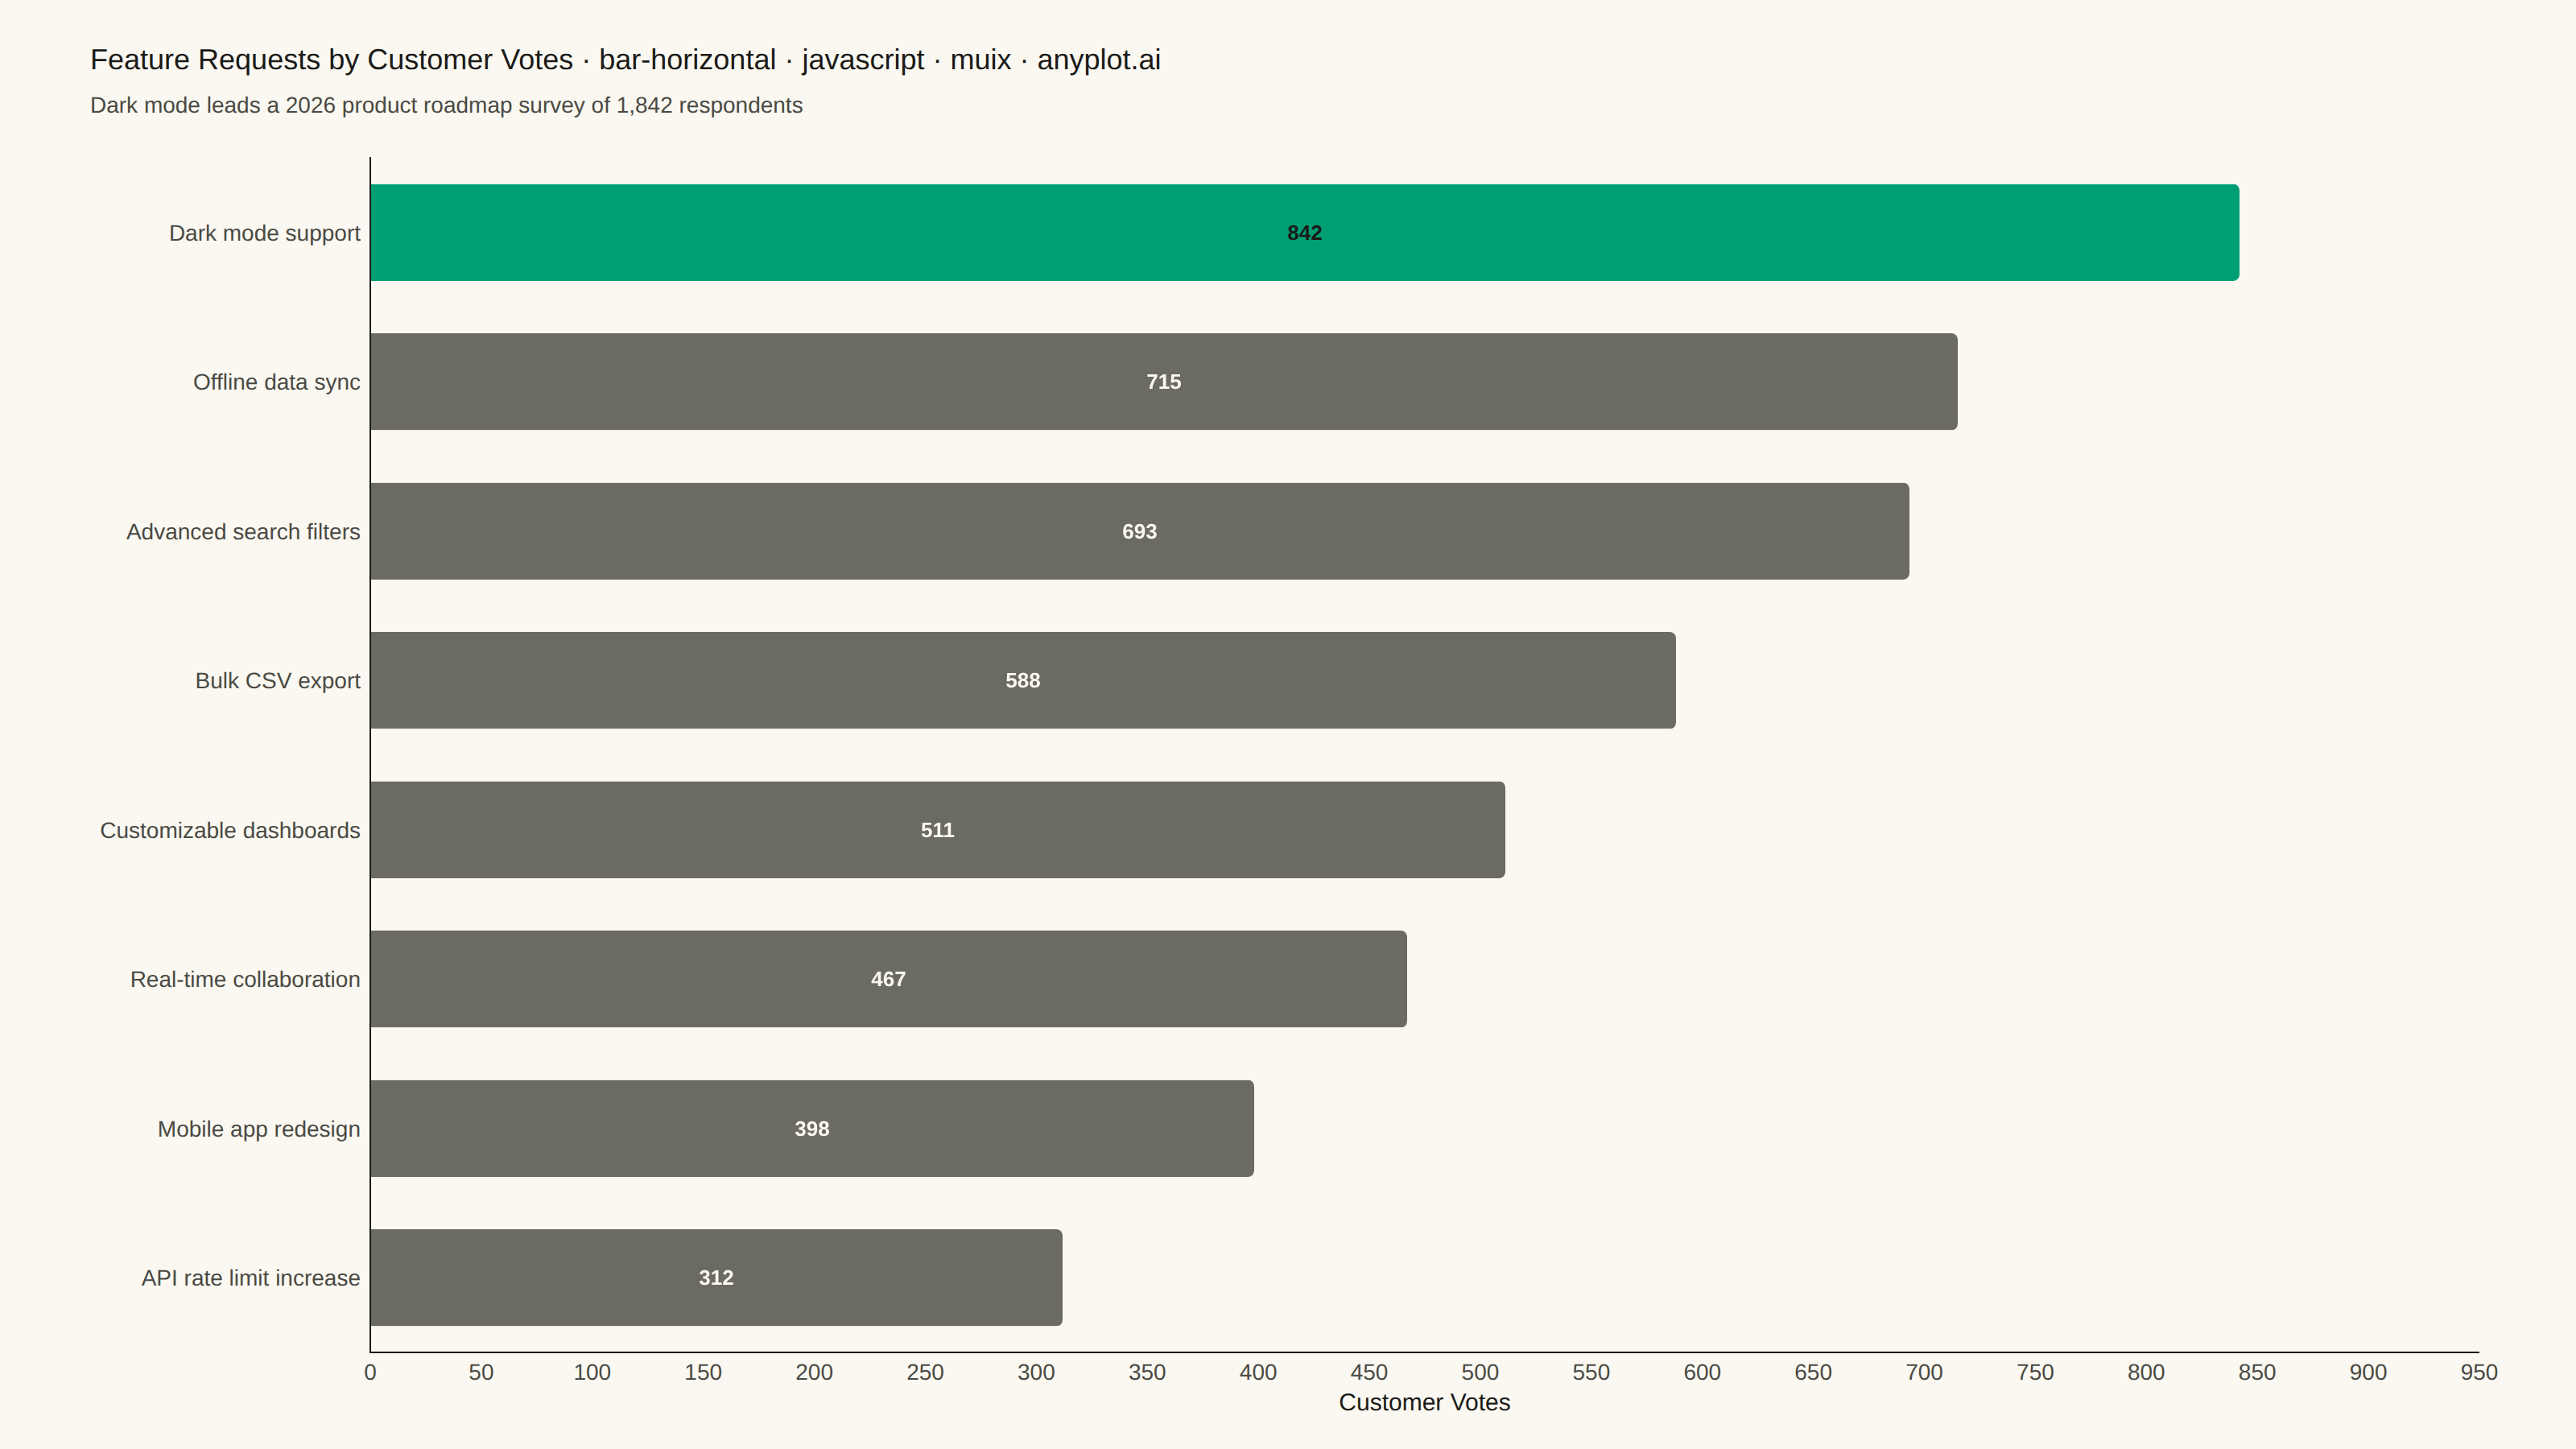
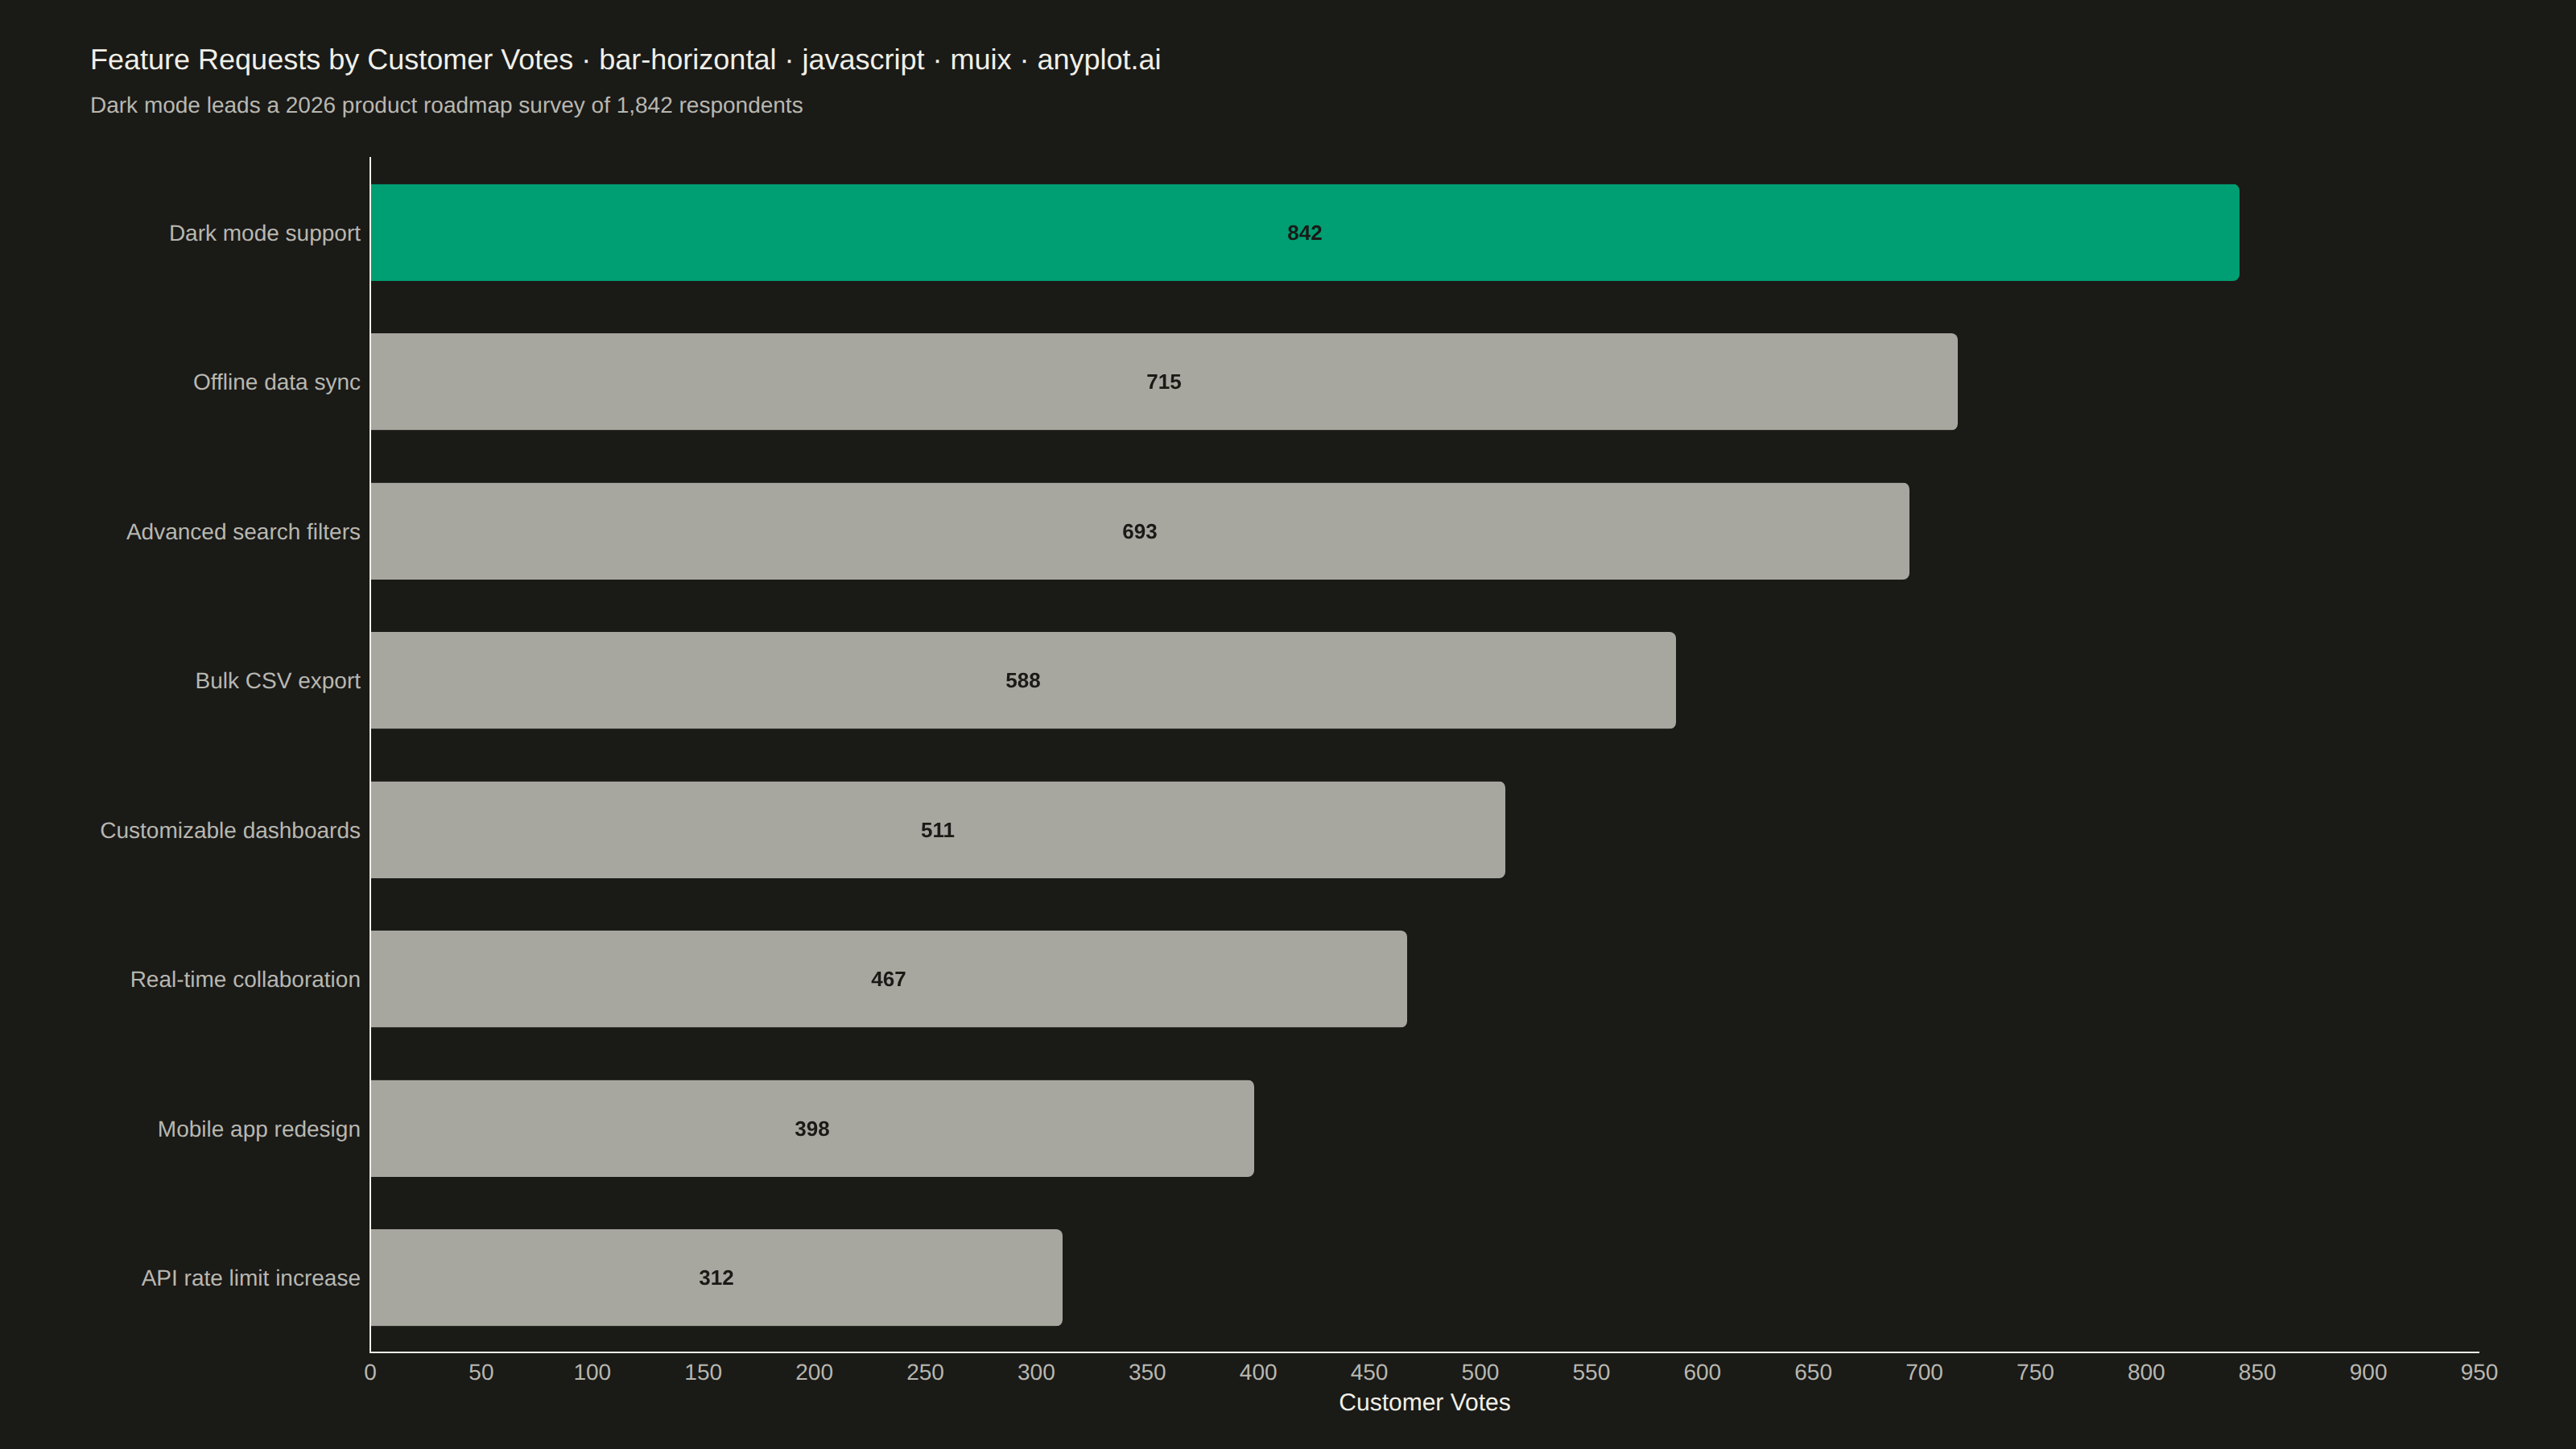
A horizontal bar chart displaying categorical data with rectangular bars extending horizontally from the y-axis. The length of each bar is proportional to the value it represents. This orientation is particularly effective when category names are long or numerous, as horizontal labels are easier to read than rotated vertical labels. Horizontal bar charts excel at rankings, comparisons, and survey results visualization.
// anyplot.ai
// bar-horizontal: Horizontal Bar Chart
// Library: muix 7.29.1 | JavaScript 22.23.1
// Quality: 93/100 | Created: 2026-08-05
import { BarChart } from "@mui/x-charts/BarChart";
import Box from "@mui/material/Box";
import Typography from "@mui/material/Typography";

const t = window.ANYPLOT_TOKENS;

// "muted" semantic anchor (other / rest) — not in ANYPLOT_TOKENS, so it's
// derived the same way the style guide defines it: theme-adaptive gray.
const MUTED = t.theme === "light" ? "#6B6A63" : "#A8A79F";

// Fixed (theme-independent) label colors — the bar fills below don't flip
// with theme, so label contrast is chosen per fill, not via t.ink/t.inkSoft.
const LABEL_ON_BRAND = "#1A1A17"; // dark ink — reads on the brand-green bar
const LABEL_ON_MUTED = t.pageBg; // page background — reads on the muted-gray bars (adapts per theme)

// --- Data (in-memory, deterministic) ----------------------------------------
// Product roadmap survey: feature requests ranked by customer votes, most
// requested first. Long descriptive labels are exactly why this ranking is
// horizontal rather than vertical — they'd collide or need rotation otherwise.
const FEATURES = [
  "Dark mode support",
  "Offline data sync",
  "Advanced search filters",
  "Bulk CSV export",
  "Customizable dashboards",
  "Real-time collaboration",
  "Mobile app redesign",
  "API rate limit increase",
];
const VOTES = [842, 715, 693, 588, 511, 467, 398, 312];

// Chart renders category index 0 at the top of the y-axis, so the array
// above (already sorted highest → lowest) reads as a top-to-bottom ranking.
// Only the top request is highlighted brand green; the rest use the "muted"
// semantic anchor (other / rest) so the eye lands on the leading request.
const BAR_COLORS = FEATURES.map((_, i) => (i === 0 ? t.palette[0] : MUTED));
const LABEL_COLORS = FEATURES.map((_, i) => (i === 0 ? LABEL_ON_BRAND : LABEL_ON_MUTED));

export default function Chart() {
  const W = window.ANYPLOT_SIZE.width; // 1600 CSS px (landscape mount)
  const H = window.ANYPLOT_SIZE.height; // 900 CSS px
  const CHART_TOP = 84;

  const title = "Feature Requests by Customer Votes · bar-horizontal · javascript · muix · anyplot.ai";
  const titleSize = title.length > 67 ? Math.round(22 * 67 / title.length) : 22;

  return (
    <Box sx={{ position: "relative", width: W, height: H, bgcolor: t.pageBg }}>
      {/* Title + subtitle */}
      <Box sx={{ position: "absolute", top: 24, left: 56, right: 56 }}>
        <Typography sx={{ color: t.ink, fontSize: titleSize, fontWeight: 500 }}>{title}</Typography>
        <Typography sx={{ color: t.inkSoft, fontSize: 14, mt: 0.5 }}>
          Dark mode leads a 2026 product roadmap survey of 1,842 respondents
        </Typography>
      </Box>

      {/* Bar chart */}
      <Box sx={{ position: "absolute", top: CHART_TOP, left: 0, right: 0, bottom: 0 }}>
        <BarChart
          width={W}
          height={H - CHART_TOP}
          layout="horizontal"
          skipAnimation
          borderRadius={4}
          xAxis={[
            {
              label: "Customer Votes",
              labelStyle: { fontSize: 15, fill: t.ink },
              tickLabelStyle: { fontSize: 14, fill: t.inkSoft },
              disableTicks: true,
              max: 950,
            },
          ]}
          yAxis={[
            {
              scaleType: "band",
              data: FEATURES,
              colorMap: { type: "ordinal", values: FEATURES, colors: BAR_COLORS },
              tickLabelStyle: { fontSize: 14, fill: t.inkSoft },
              disableTicks: true,
              categoryGapRatio: 0.35,
            },
          ]}
          series={[
            {
              id: "votes",
              label: "Votes",
              data: VOTES,
              valueFormatter: (v) => `${v} votes`,
            },
          ]}
          barLabel="value"
          slotProps={{
            barLabel: (ownerState) => ({
              style: {
                fontSize: 13,
                fontWeight: 600,
                fill: LABEL_COLORS[ownerState.dataIndex],
              },
            }),
            legend: { hidden: true },
          }}
          margin={{ top: 14, right: 60, bottom: 60, left: 230 }}
          sx={{
            "& .MuiChartsAxis-line": { stroke: t.inkSoft },
            "& .MuiChartsGrid-line": { stroke: t.grid },
          }}
        />
      </Box>
    </Box>
  );
}
Runnable source as JSON, for any HTTP client: https://api.anyplot.ai/specs/bar-horizontal/muix/code. Any spec id and library id listed in llms-full.txt fit the same URL shape; every URL below is complete and callable.
{
  "spec_id": "bar-horizontal",
  "language": "javascript",
  "library": "muix",
  "page": "https://anyplot.ai/bar-horizontal/javascript/muix",
  "hub": "https://anyplot.ai/bar-horizontal",
  "code_json": "https://api.anyplot.ai/specs/bar-horizontal/muix/code",
  "spec_json": "https://api.anyplot.ai/specs/bar-horizontal",
  "render_light_png": "https://storage.googleapis.com/anyplot-images/plots/bar-horizontal/javascript/muix/plot-light.png",
  "render_dark_png": "https://storage.googleapis.com/anyplot-images/plots/bar-horizontal/javascript/muix/plot-dark.png",
  "interactive_light_html": "https://storage.googleapis.com/anyplot-images/plots/bar-horizontal/javascript/muix/plot-light.html",
  "interactive_dark_html": "https://storage.googleapis.com/anyplot-images/plots/bar-horizontal/javascript/muix/plot-dark.html",
  "quality_score": 93.0,
  "license": "MIT",
  "guide": "https://anyplot.ai/llms.txt"
}
Part of Horizontal Bar Chart on anyplot.ai.