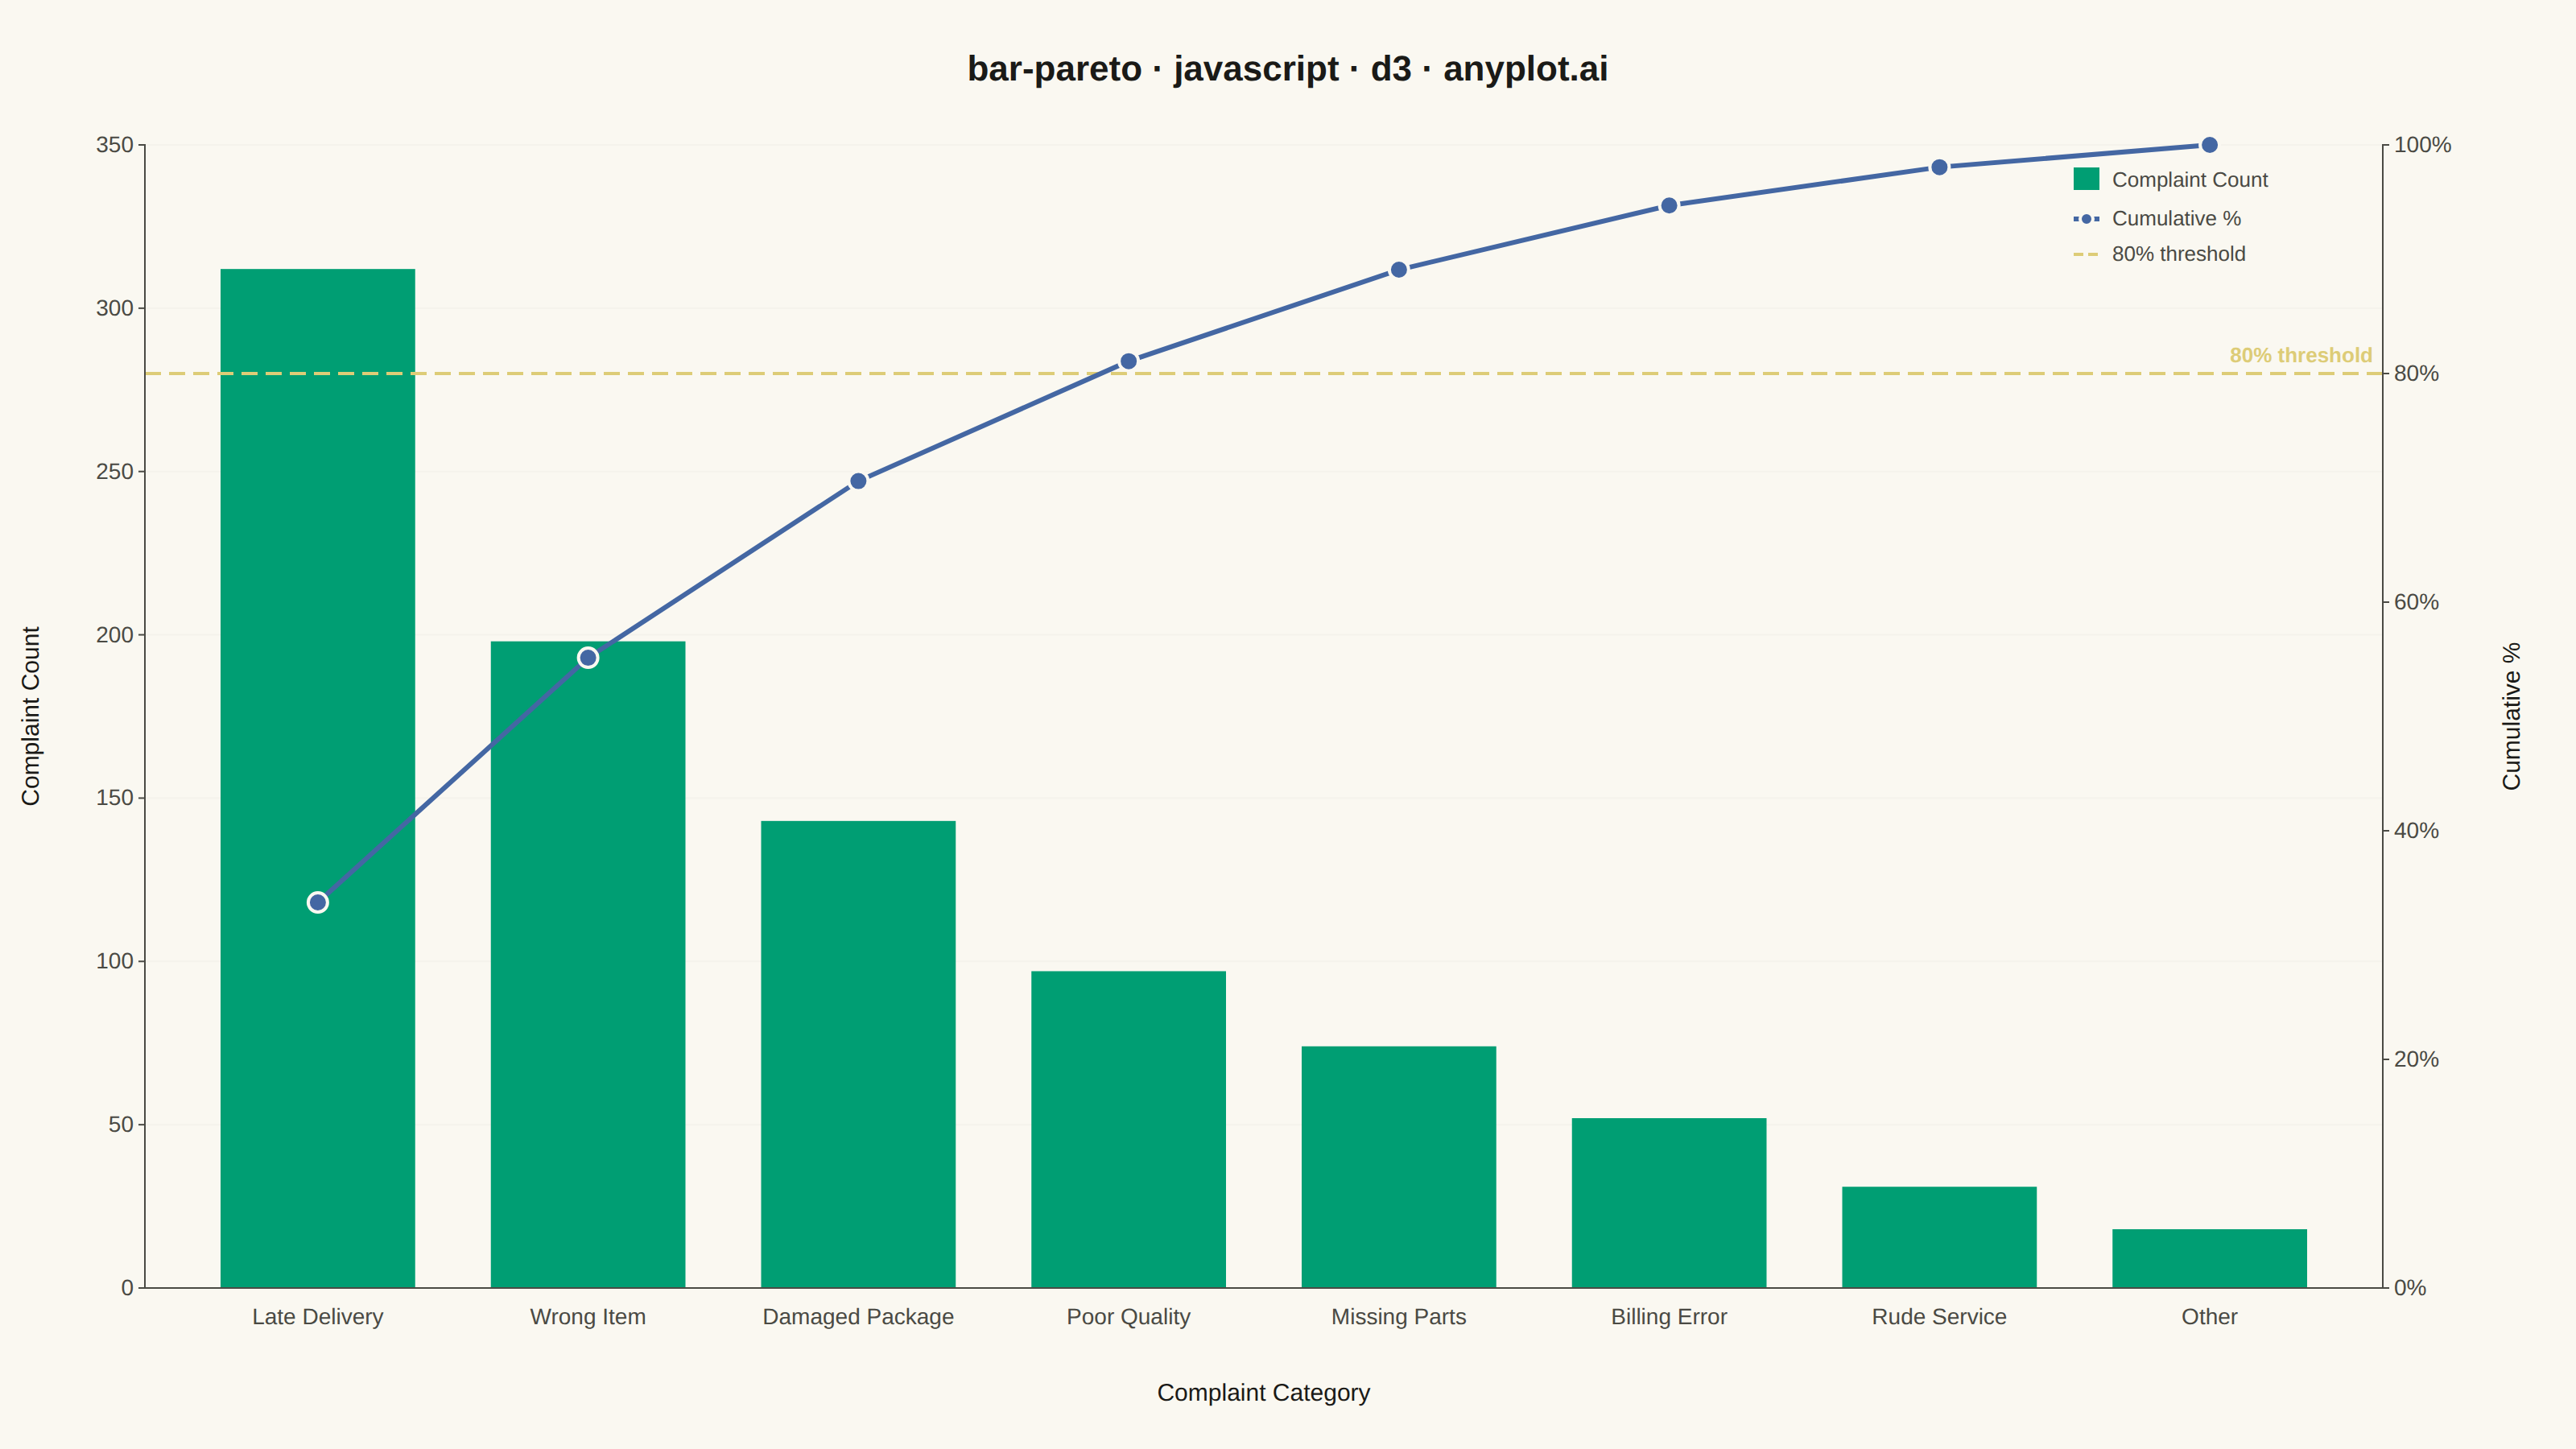
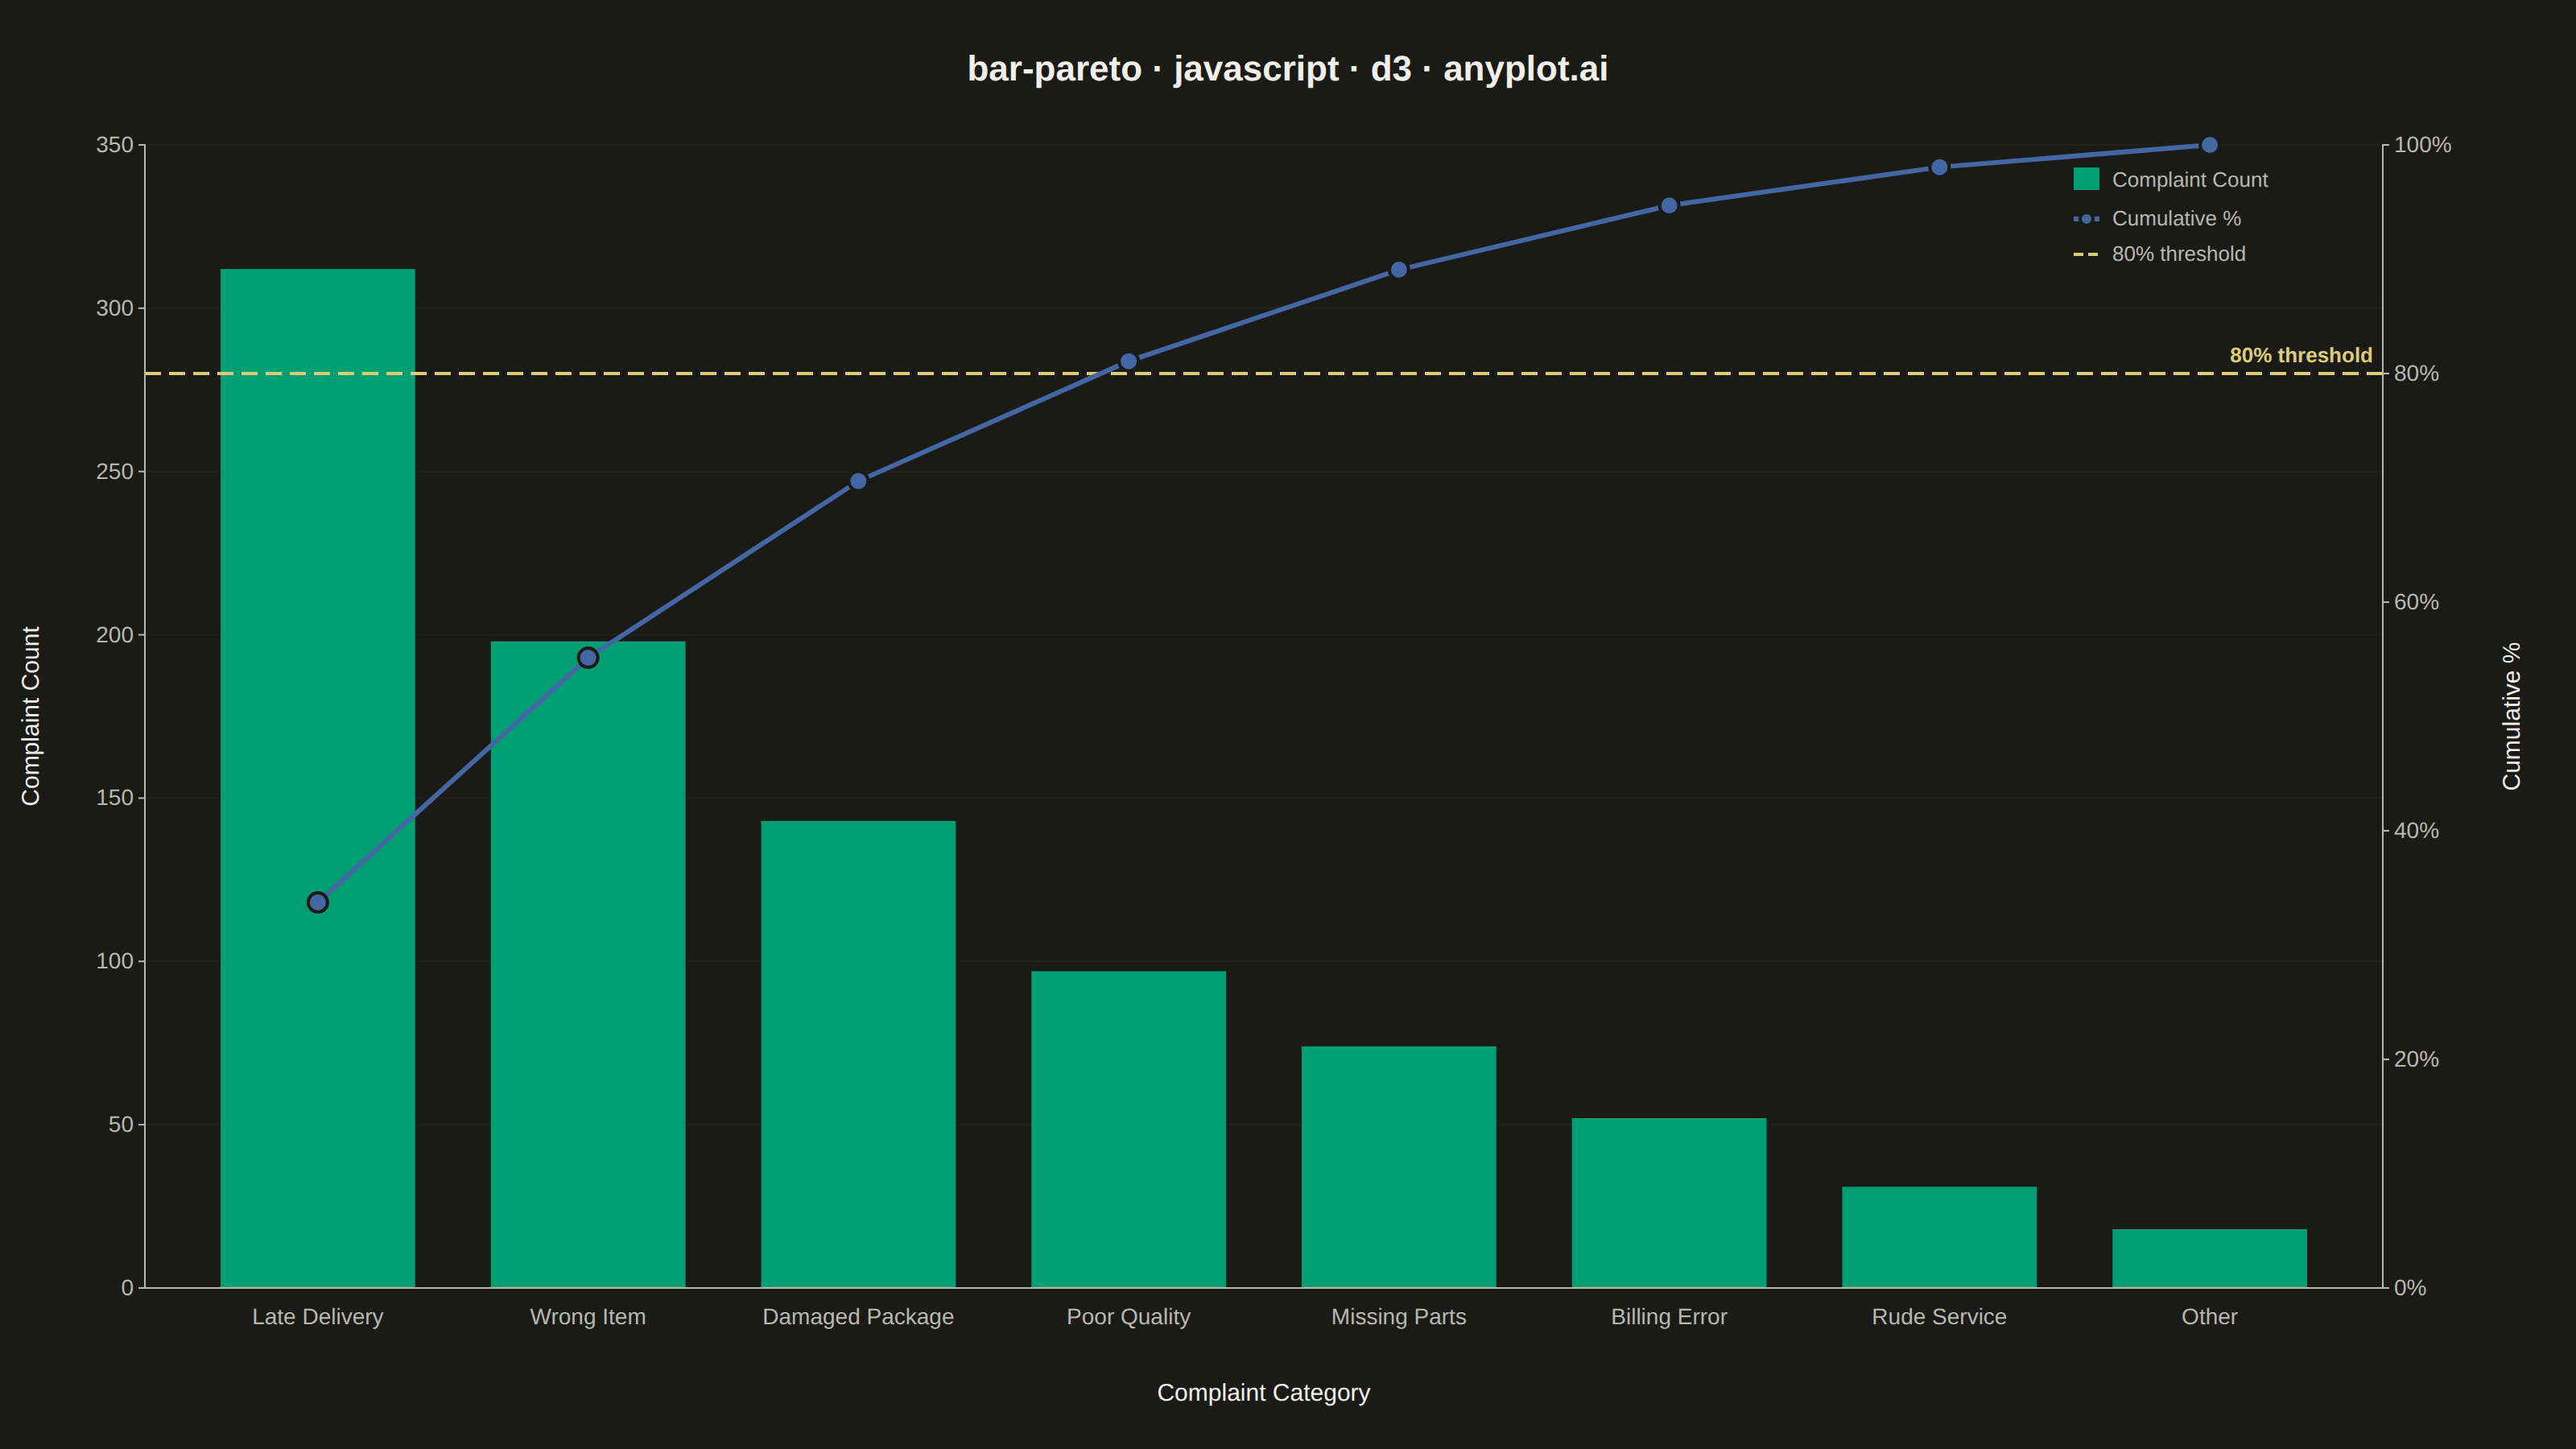
A Pareto chart combining descending-sorted bars (by frequency or count) with a cumulative percentage line overlay on a secondary y-axis. This visualization helps identify the most significant factors in a dataset by applying the Pareto principle (80/20 rule), making it one of the "7 Basic Tools of Quality" in Six Sigma and quality management. It reveals which categories contribute the most to an overall effect, enabling data-driven prioritization.
// anyplot.ai
// bar-pareto: Pareto Chart with Cumulative Line
// Library: d3 7.9.0 | JavaScript 22.22.3
// Quality: 89/100 | Created: 2026-06-20

const t = window.ANYPLOT_TOKENS;
const { width, height } = window.ANYPLOT_SIZE;

// --- Data: e-commerce complaint categories, sorted descending by count ---
const raw = [
  { category: "Late Delivery",   count: 312 },
  { category: "Wrong Item",      count: 198 },
  { category: "Damaged Package", count: 143 },
  { category: "Poor Quality",    count:  97 },
  { category: "Missing Parts",   count:  74 },
  { category: "Billing Error",   count:  52 },
  { category: "Rude Service",    count:  31 },
  { category: "Other",           count:  18 },
];

// Compute cumulative percentage (data already sorted descending)
const total = d3.sum(raw, d => d.count);
let cum = 0;
const data = raw.map(d => {
  cum += d.count;
  return { category: d.category, count: d.count, cumPct: (cum / total) * 100 };
});

// --- Layout ---
const margin = { top: 90, right: 120, bottom: 100, left: 90 };
const iw = width - margin.left - margin.right;
const ih = height - margin.top - margin.bottom;

// --- SVG ---
const svg = d3.select("#container").append("svg")
  .attr("width", width).attr("height", height);

const g = svg.append("g")
  .attr("transform", `translate(${margin.left},${margin.top})`);

// --- Scales ---
const x = d3.scaleBand()
  .domain(data.map(d => d.category))
  .range([0, iw])
  .padding(0.28);

const maxCount = d3.max(data, d => d.count);
const y = d3.scaleLinear()
  .domain([0, maxCount * 1.08]).nice()
  .range([ih, 0]);

const y2 = d3.scaleLinear()
  .domain([0, 100])
  .range([ih, 0]);

// --- Subtle horizontal gridlines ---
y.ticks(6).forEach(tick => {
  g.append("line")
    .attr("x1", 0).attr("x2", iw)
    .attr("y1", y(tick)).attr("y2", y(tick))
    .attr("stroke", t.grid)
    .attr("stroke-opacity", 0.15);
});

// --- Bars (descending, Imprint palette position 1) ---
g.selectAll(".bar").data(data).join("rect")
  .attr("class", "bar")
  .attr("x", d => x(d.category))
  .attr("y", d => y(d.count))
  .attr("width", x.bandwidth())
  .attr("height", d => ih - y(d.count))
  .attr("fill", t.palette[0]);

// --- 80% threshold reference line (amber, dashed) ---
g.append("line")
  .attr("x1", 0).attr("x2", iw)
  .attr("y1", y2(80)).attr("y2", y2(80))
  .attr("stroke", t.amber)
  .attr("stroke-width", 2)
  .attr("stroke-dasharray", "10,5");

g.append("text")
  .attr("x", iw - 6)
  .attr("y", y2(80) - 7)
  .attr("text-anchor", "end")
  .attr("fill", t.amber)
  .style("font-size", "13px")
  .style("font-weight", "600")
  .text("80% threshold");

// --- Cumulative percentage line (Imprint palette position 3, blue) ---
const lineGen = d3.line()
  .x(d => x(d.category) + x.bandwidth() / 2)
  .y(d => y2(d.cumPct));

g.append("path").datum(data)
  .attr("fill", "none")
  .attr("stroke", t.palette[2])
  .attr("stroke-width", 3)
  .attr("d", lineGen);

// Markers at center-top of each bar on the cumulative line
g.selectAll(".dot").data(data).join("circle")
  .attr("class", "dot")
  .attr("cx", d => x(d.category) + x.bandwidth() / 2)
  .attr("cy", d => y2(d.cumPct))
  .attr("r", 6)
  .attr("fill", t.palette[2])
  .attr("stroke", t.pageBg)
  .attr("stroke-width", 2);

// --- Left y-axis (raw count) ---
const leftAx = g.append("g").call(
  d3.axisLeft(y).ticks(6).tickFormat(d3.format(",")).tickSize(4)
);
leftAx.select(".domain").attr("stroke", t.inkSoft);
leftAx.selectAll(".tick line").attr("stroke", t.inkSoft);
leftAx.selectAll(".tick text")
  .attr("fill", t.inkSoft).style("font-size", "14px");

// --- Right y-axis (cumulative %) ---
const rightAx = g.append("g")
  .attr("transform", `translate(${iw},0)`)
  .call(d3.axisRight(y2).ticks(5).tickFormat(d => `${d}%`).tickSize(4));
rightAx.select(".domain").attr("stroke", t.inkSoft);
rightAx.selectAll(".tick line").attr("stroke", t.inkSoft);
rightAx.selectAll(".tick text")
  .attr("fill", t.inkSoft).style("font-size", "14px");

// --- Bottom x-axis (categories) ---
const bottomAx = g.append("g")
  .attr("transform", `translate(0,${ih})`)
  .call(d3.axisBottom(x).tickSize(0));
bottomAx.select(".domain").attr("stroke", t.inkSoft);
bottomAx.selectAll(".tick text")
  .attr("fill", t.inkSoft)
  .style("font-size", "14px")
  .attr("dy", "1.4em");

// --- Axis labels ---
// Left y-axis label (rotate -90 so text reads bottom-to-top)
g.append("text")
  .attr("transform", "rotate(-90)")
  .attr("x", -ih / 2)
  .attr("y", -66)
  .attr("text-anchor", "middle")
  .attr("fill", t.ink)
  .style("font-size", "15px")
  .text("Complaint Count");

// Right y-axis label (same rotation, positioned to the right)
g.append("text")
  .attr("transform", "rotate(-90)")
  .attr("x", -ih / 2)
  .attr("y", iw + 85)
  .attr("text-anchor", "middle")
  .attr("fill", t.ink)
  .style("font-size", "15px")
  .text("Cumulative %");

// Bottom x-axis label
g.append("text")
  .attr("x", iw / 2)
  .attr("y", ih + 70)
  .attr("text-anchor", "middle")
  .attr("fill", t.ink)
  .style("font-size", "15px")
  .text("Complaint Category");

// --- Legend (top-right of inner area) ---
const lx = iw - 192;
const ly = 14;

// Bars series
g.append("rect")
  .attr("x", lx).attr("y", ly)
  .attr("width", 16).attr("height", 14)
  .attr("fill", t.palette[0]);
g.append("text")
  .attr("x", lx + 24).attr("y", ly + 12)
  .attr("fill", t.inkSoft).style("font-size", "13px")
  .text("Complaint Count");

// Cumulative line series
g.append("line")
  .attr("x1", lx).attr("x2", lx + 16)
  .attr("y1", ly + 32).attr("y2", ly + 32)
  .attr("stroke", t.palette[2]).attr("stroke-width", 3);
g.append("circle")
  .attr("cx", lx + 8).attr("cy", ly + 32)
  .attr("r", 4)
  .attr("fill", t.palette[2])
  .attr("stroke", t.pageBg).attr("stroke-width", 2);
g.append("text")
  .attr("x", lx + 24).attr("y", ly + 36)
  .attr("fill", t.inkSoft).style("font-size", "13px")
  .text("Cumulative %");

// 80% threshold series
g.append("line")
  .attr("x1", lx).attr("x2", lx + 16)
  .attr("y1", ly + 54).attr("y2", ly + 54)
  .attr("stroke", t.amber).attr("stroke-width", 2)
  .attr("stroke-dasharray", "6,3");
g.append("text")
  .attr("x", lx + 24).attr("y", ly + 58)
  .attr("fill", t.inkSoft).style("font-size", "13px")
  .text("80% threshold");

// --- Title ---
svg.append("text")
  .attr("x", width / 2)
  .attr("y", 50)
  .attr("text-anchor", "middle")
  .attr("fill", t.ink)
  .style("font-size", "22px")
  .style("font-weight", "600")
  .text("bar-pareto · javascript · d3 · anyplot.ai");
Runnable source as JSON, for any HTTP client: https://api.anyplot.ai/specs/bar-pareto/d3/code. Any spec id and library id listed in llms-full.txt fit the same URL shape; every URL below is complete and callable.
{
  "spec_id": "bar-pareto",
  "language": "javascript",
  "library": "d3",
  "page": "https://anyplot.ai/bar-pareto/javascript/d3",
  "hub": "https://anyplot.ai/bar-pareto",
  "code_json": "https://api.anyplot.ai/specs/bar-pareto/d3/code",
  "spec_json": "https://api.anyplot.ai/specs/bar-pareto",
  "render_light_png": "https://storage.googleapis.com/anyplot-images/plots/bar-pareto/javascript/d3/plot-light.png",
  "render_dark_png": "https://storage.googleapis.com/anyplot-images/plots/bar-pareto/javascript/d3/plot-dark.png",
  "interactive_light_html": "https://storage.googleapis.com/anyplot-images/plots/bar-pareto/javascript/d3/plot-light.html",
  "interactive_dark_html": "https://storage.googleapis.com/anyplot-images/plots/bar-pareto/javascript/d3/plot-dark.html",
  "quality_score": 89.0,
  "license": "MIT",
  "guide": "https://anyplot.ai/llms.txt"
}
Part of Pareto Chart with Cumulative Line on anyplot.ai.