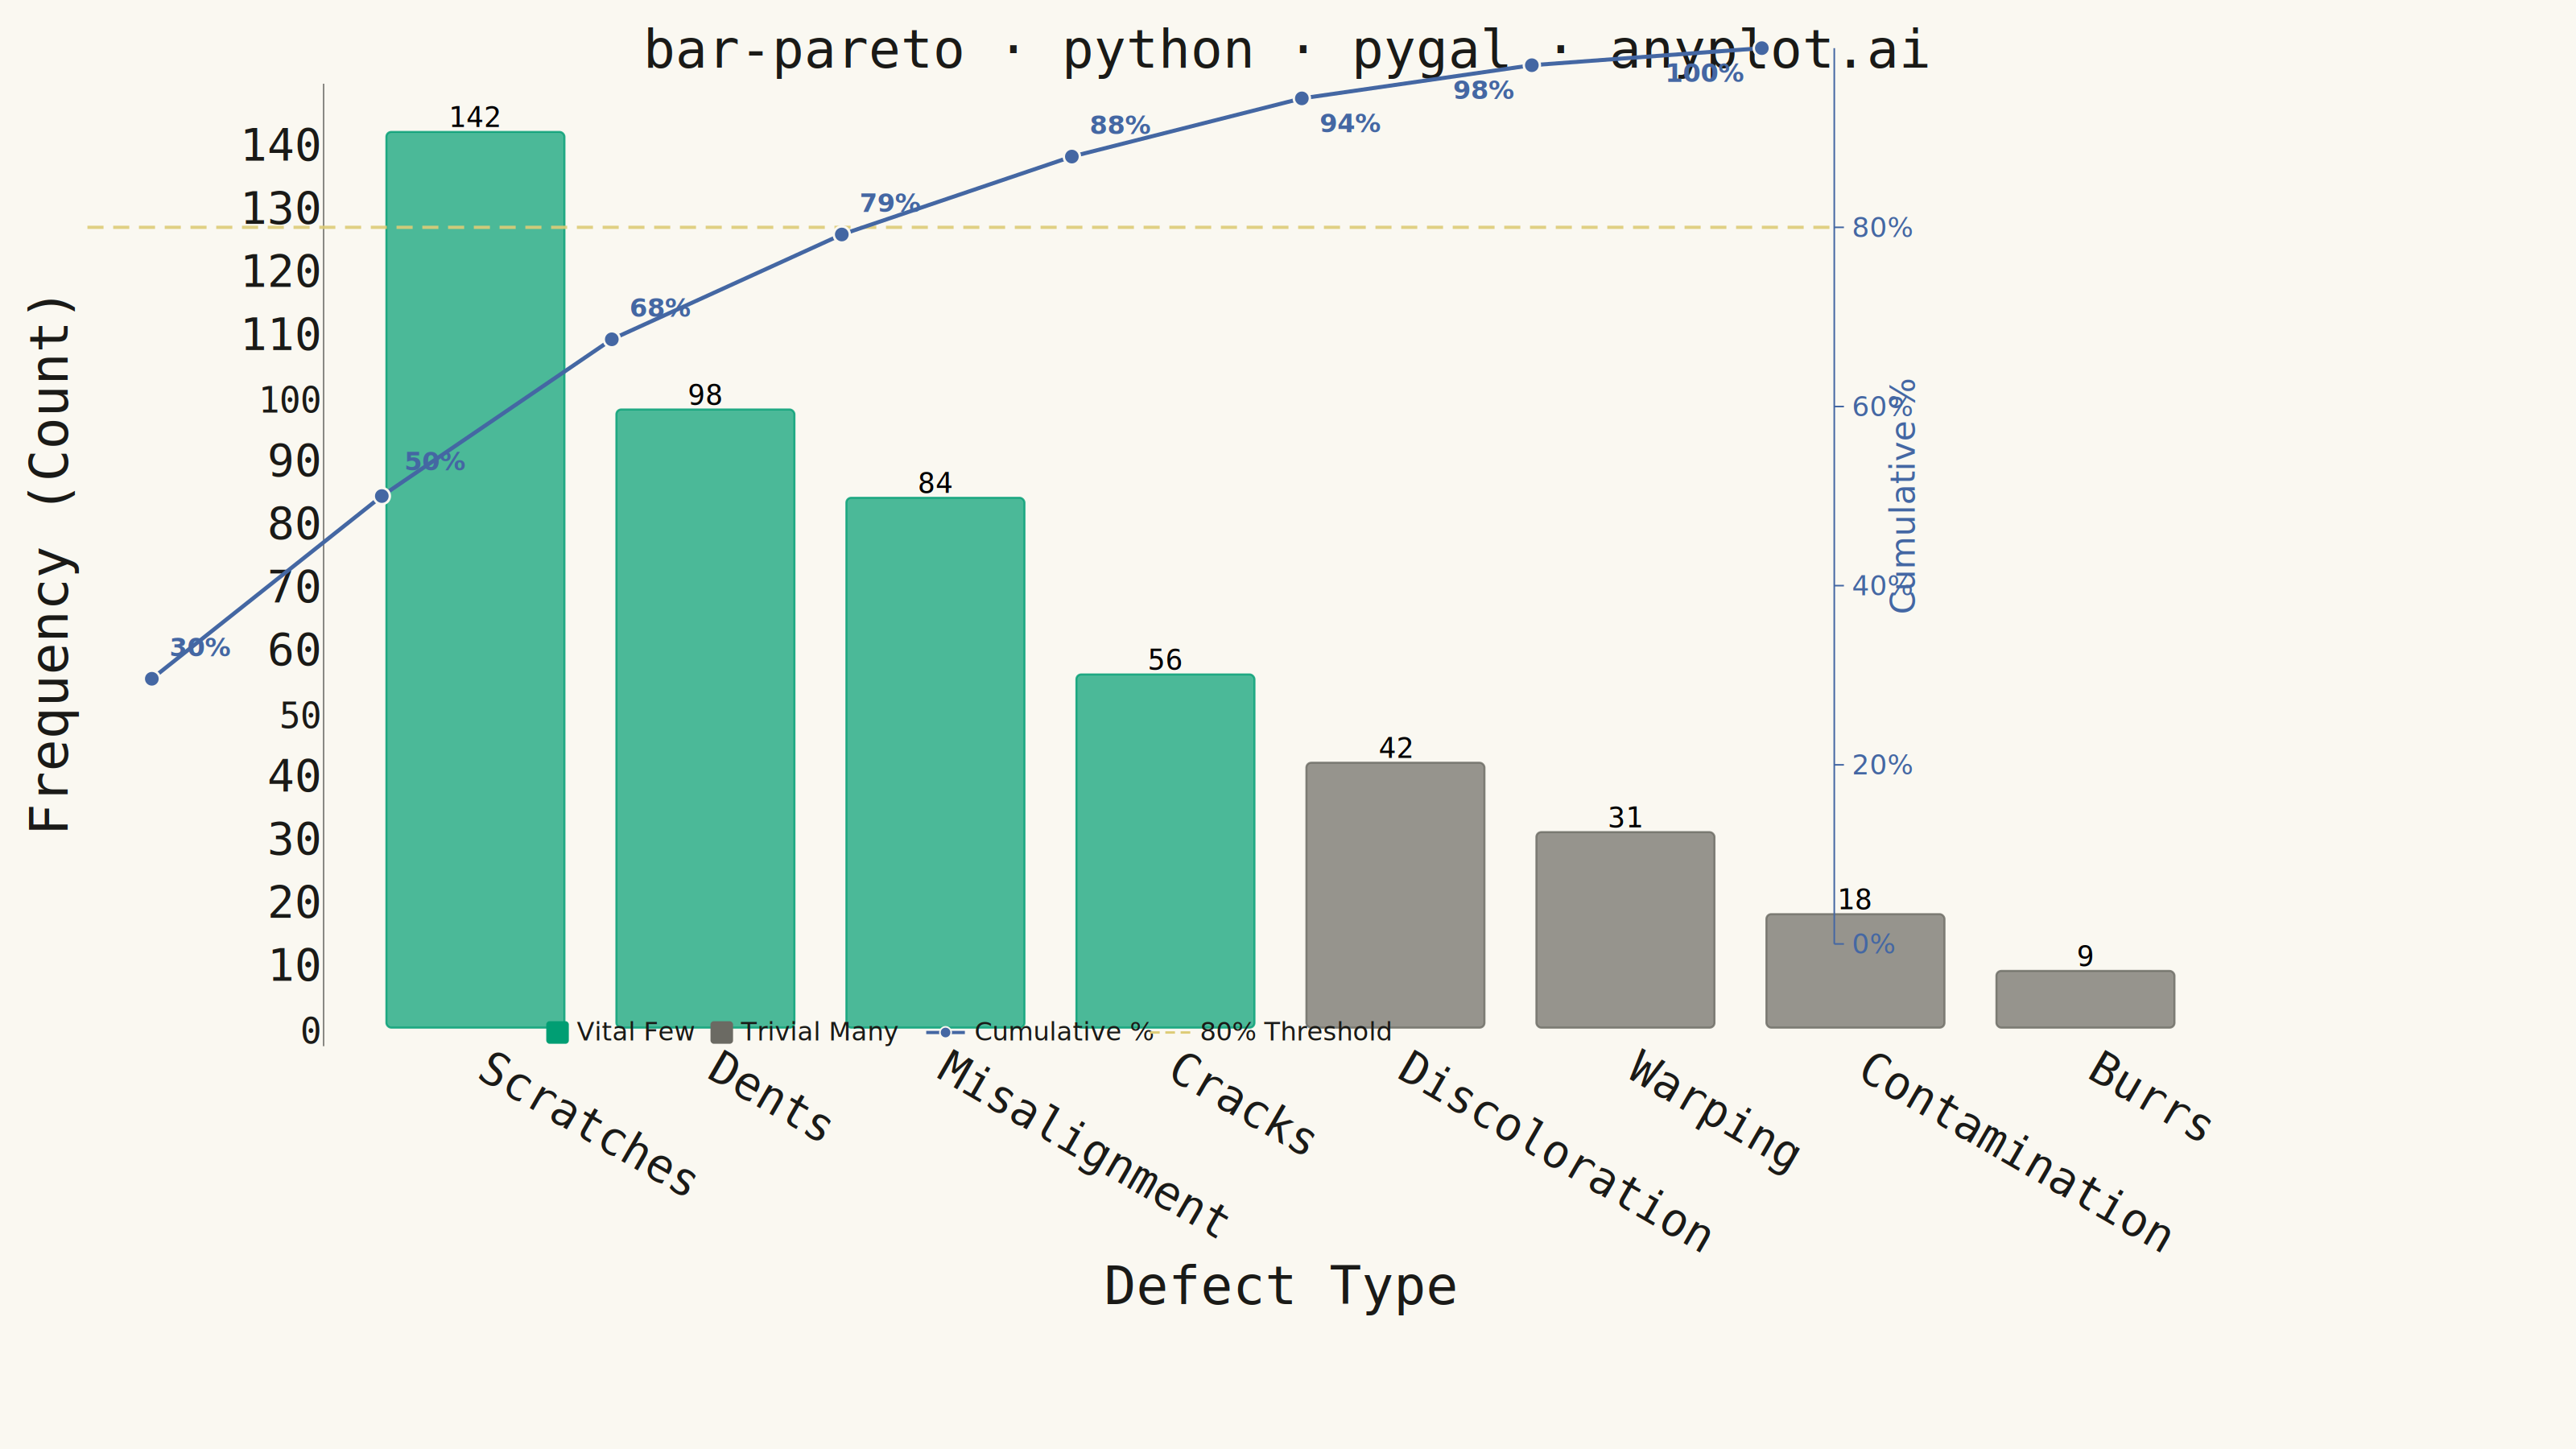
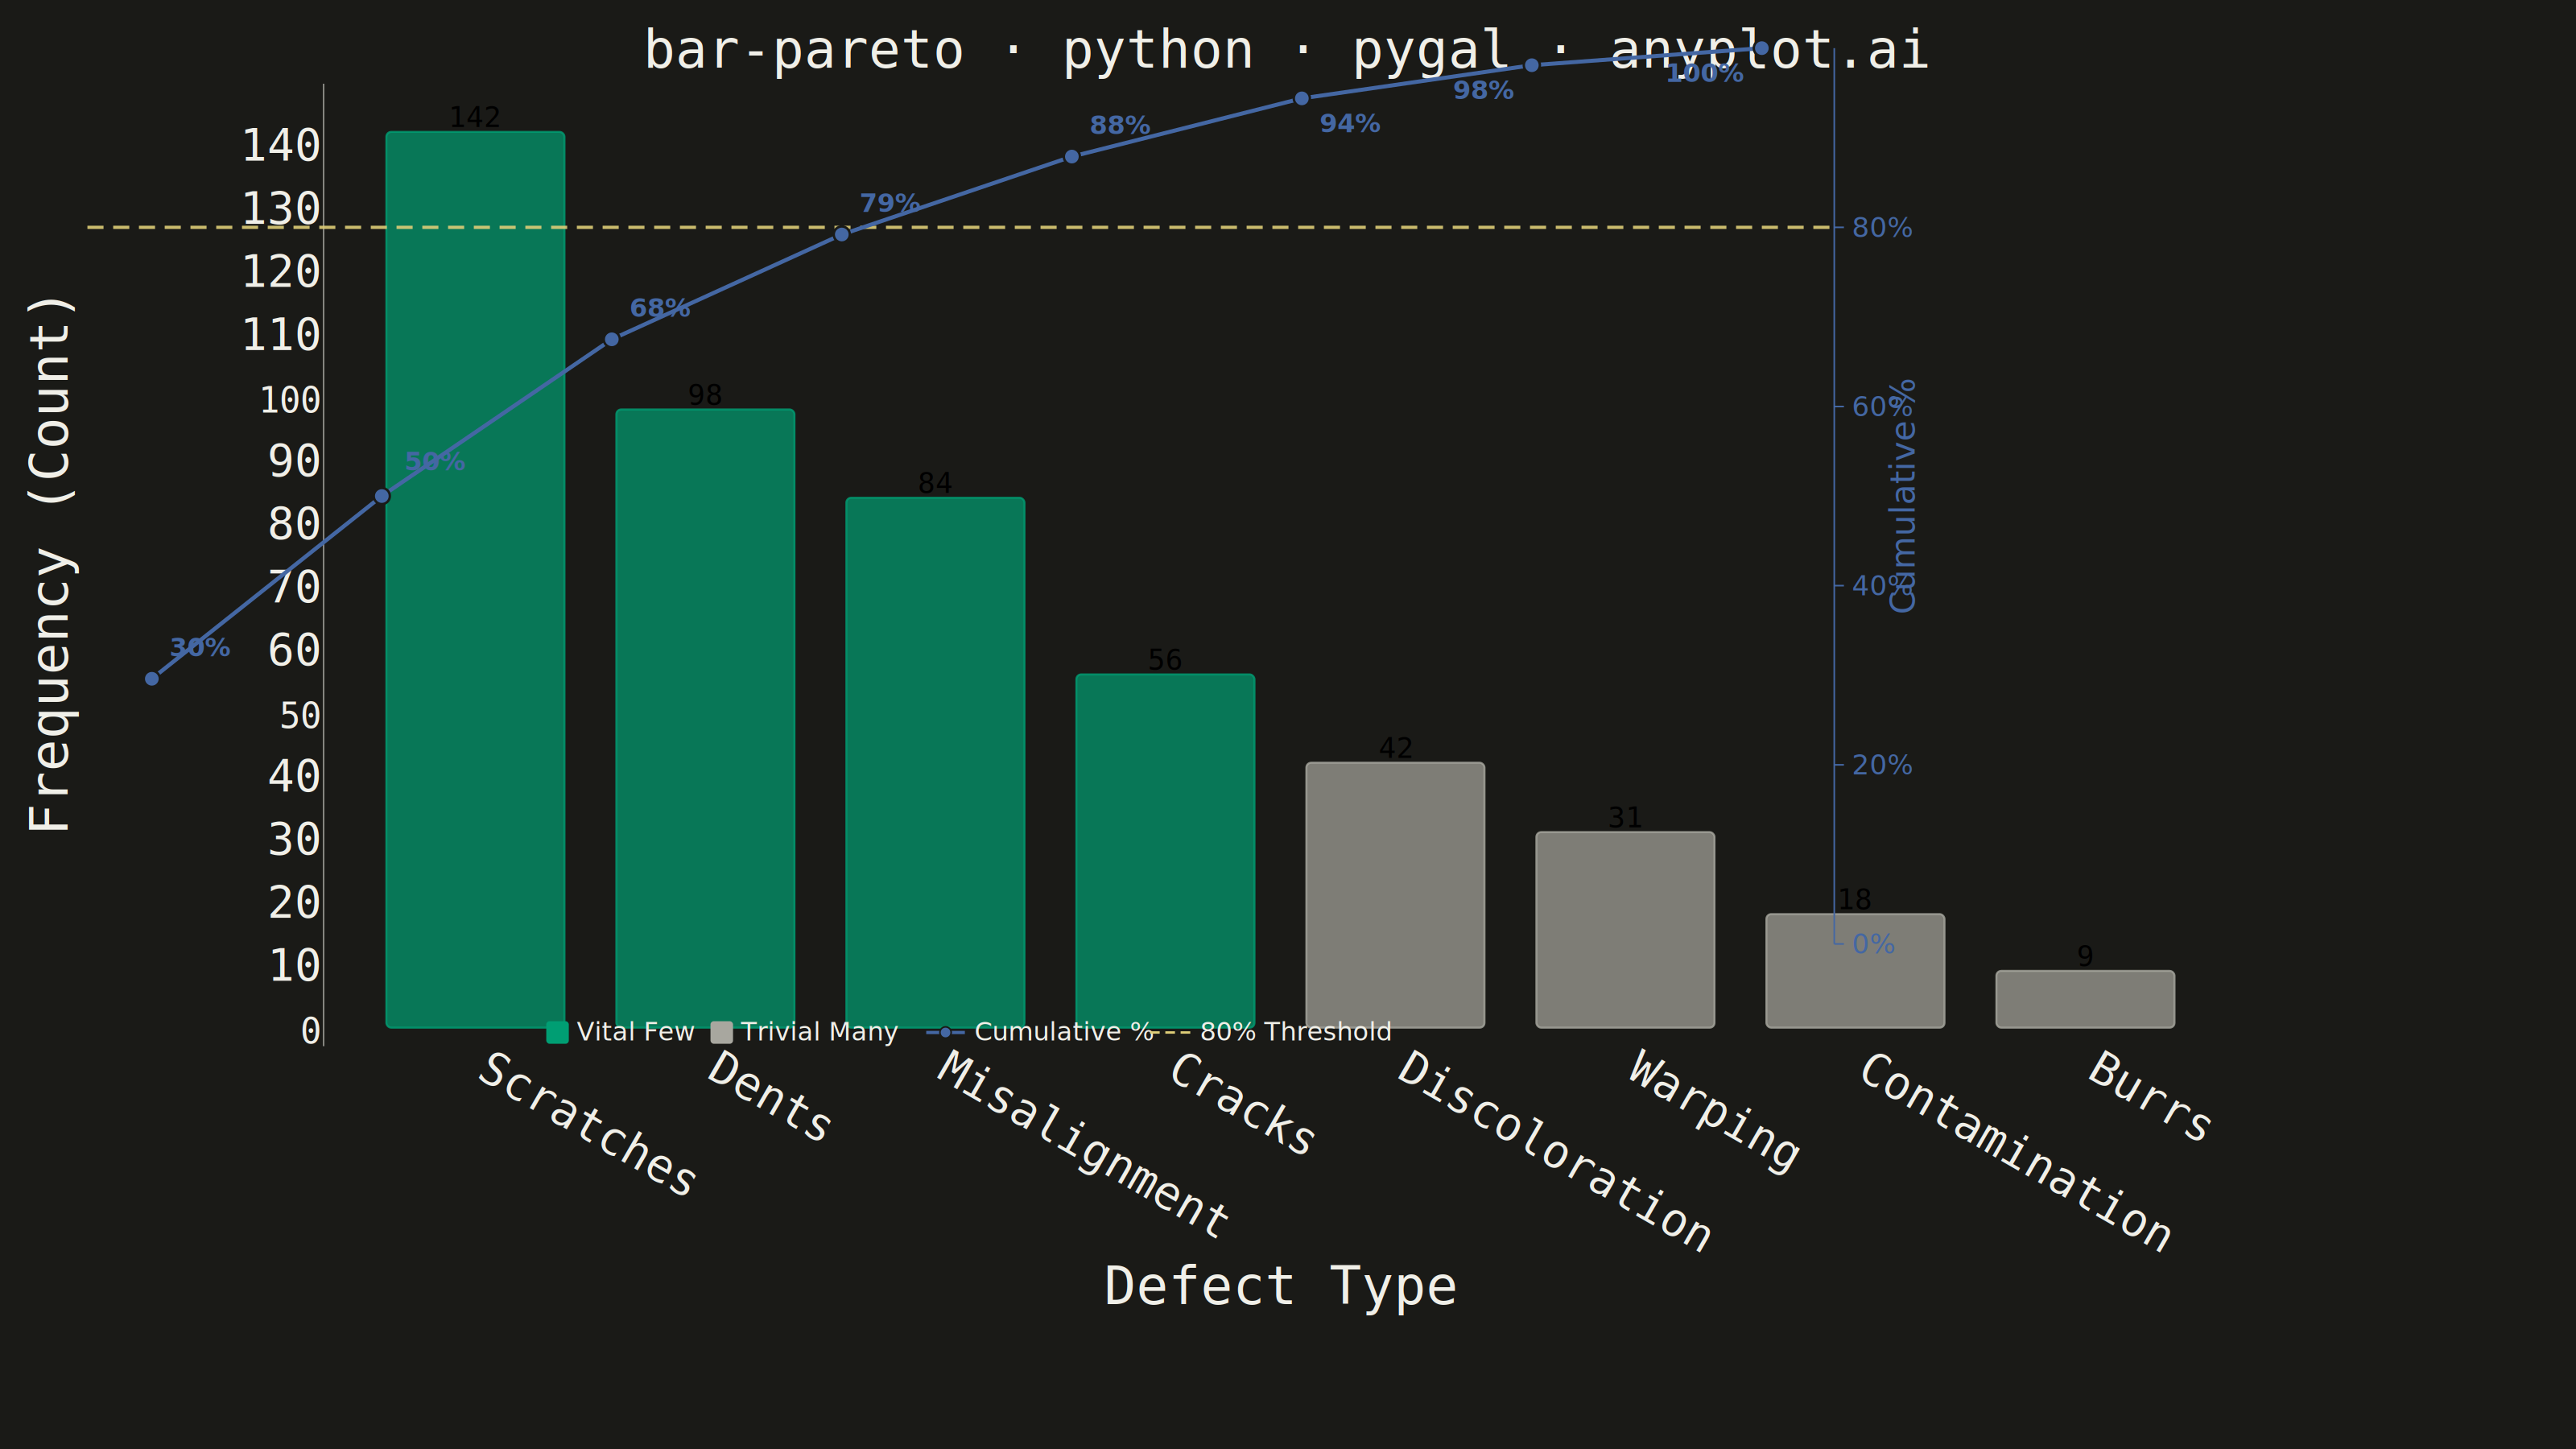
A Pareto chart combining descending-sorted bars (by frequency or count) with a cumulative percentage line overlay on a secondary y-axis. This visualization helps identify the most significant factors in a dataset by applying the Pareto principle (80/20 rule), making it one of the "7 Basic Tools of Quality" in Six Sigma and quality management. It reveals which categories contribute the most to an overall effect, enabling data-driven prioritization.
""" anyplot.ai
bar-pareto: Pareto Chart with Cumulative Line
Library: pygal 3.1.3 | Python 3.13.14
Quality: 87/100 | Updated: 2026-06-20
"""

import os
import re

import cairosvg
import pygal
from pygal.style import Style


# Theme tokens (Imprint style guide — default-style-guide.md)
THEME = os.getenv("ANYPLOT_THEME", "light")
PAGE_BG = "#FAF8F1" if THEME == "light" else "#1A1A17"
INK = "#1A1A17" if THEME == "light" else "#F0EFE8"
INK_MUTED = "#6B6A63" if THEME == "light" else "#A8A79F"

# Imprint palette — first series always #009E73
COLOR_VITAL = "#009E73"  # Imprint pos 1 — vital-few bars
COLOR_TRIVIAL = INK_MUTED  # semantic muted anchor — trivial-many (de-emphasised)
COLOR_LINE = "#4467A3"  # Imprint pos 3 — cumulative percentage line
COLOR_THRESHOLD = "#DDCC77"  # Imprint amber — 80% warning threshold

# Data — manufacturing defect analysis, sorted descending by count
categories = ["Scratches", "Dents", "Misalignment", "Cracks", "Discoloration", "Warping", "Contamination", "Burrs"]
counts = [142, 98, 84, 56, 42, 31, 18, 9]

total = sum(counts)
cumulative_pct = []
running = 0
for c in counts:
    running += c
    cumulative_pct.append(round(running / total * 100, 1))

vital_few_count = sum(1 for p in cumulative_pct if p <= 80.0)

title = "bar-pareto · python · pygal · anyplot.ai"

custom_style = Style(
    background=PAGE_BG,
    plot_background=PAGE_BG,
    foreground=INK,
    foreground_strong=INK,
    foreground_subtle=INK_MUTED,
    colors=(COLOR_VITAL,),
    title_font_size=66,
    label_font_size=56,
    major_label_font_size=44,
    value_font_size=36,
    legend_font_size=44,
    stroke_width=2.5,
)

chart = pygal.Bar(
    width=3200,
    height=1800,
    title=title,
    x_title="Defect Type",
    y_title="Frequency (Count)",
    style=custom_style,
    show_legend=False,
    print_values=True,
    print_values_position="top",
    value_formatter=lambda x: f"{x:,.0f}",
    show_y_guides=False,
    show_x_guides=False,
    margin=20,
    margin_bottom=180,
    margin_left=200,
    margin_right=420,
    spacing=18,
    rounded_bars=6,
    truncate_label=-1,
    x_label_rotation=30,
    js=[],
)

chart.x_labels = categories
chart.add("Defect Count", counts)

# Render SVG then inject cumulative-line overlays
svg_str = chart.render().decode("utf-8")

# Recolor trivial-many bars via inline style override
bar_rects = list(re.finditer(r'<rect\s[^>]*class="rect reactive tooltip-trigger"[^>]*/>', svg_str))
for i in reversed(range(len(bar_rects))):
    if i >= vital_few_count:
        m = bar_rects[i]
        old_rect = m.group(0)
        new_rect = old_rect.replace(
            'class="rect reactive tooltip-trigger"',
            f'class="rect reactive tooltip-trigger" style="fill:{COLOR_TRIVIAL};stroke:{COLOR_TRIVIAL}"',
        )
        svg_str = svg_str[: m.start()] + new_rect + svg_str[m.end() :]

# Extract bar geometry for overlay coordinate mapping
bar_matches_pos = re.findall(r'<rect\s[^>]*class="rect reactive tooltip-trigger"[^>]*/>', svg_str)

bar_centers_x = []
bar_tops_y = []
bar_bottoms_y = []

for bar_svg in bar_matches_pos:
    x_m = re.search(r'\bx="([^"]+)"', bar_svg)
    y_m = re.search(r'\by="([^"]+)"', bar_svg)
    w_m = re.search(r'\bwidth="([^"]+)"', bar_svg)
    h_m = re.search(r'\bheight="([^"]+)"', bar_svg)
    if x_m and y_m and w_m and h_m:
        x = float(x_m.group(1))
        y = float(y_m.group(1))
        w = float(w_m.group(1))
        h = float(h_m.group(1))
        bar_centers_x.append(x + w / 2)
        bar_tops_y.append(y)
        bar_bottoms_y.append(y + h)

# Derive plot coordinate system from bar geometry
y_base = max(bar_bottoms_y)
pixels_per_count = (y_base - min(bar_tops_y)) / max(counts)

y_label_values = [int(m) for m in re.findall(r"<text[^>]*>(\d+)</text>", svg_str)]
y_axis_max = max(v for v in y_label_values if v <= 200) if y_label_values else 160

y_plot_top = y_base - pixels_per_count * y_axis_max
plot_height = y_base - y_plot_top

# Cumulative percentage pixel coordinates (centred on each bar top)
cum_points = []
for i, pct in enumerate(cumulative_pct):
    cx = bar_centers_x[i]
    cy = y_base - (pct / 100.0) * plot_height
    cum_points.append((cx, cy))

# 80% reference dashed line
y_80 = y_base - 0.80 * plot_height
x_left = bar_centers_x[0] - 80
x_right = bar_centers_x[-1] + 90

ref_line_svg = f'''
<g id="reference-80">
  <line x1="{x_left:.1f}" y1="{y_80:.1f}" x2="{x_right:.1f}" y2="{y_80:.1f}"
    stroke="{COLOR_THRESHOLD}" stroke-width="4" stroke-dasharray="20,12" opacity="0.9" />
</g>
'''

# Cumulative line, dots, and percentage labels
points_str = " ".join(f"{x:.1f},{y:.1f}" for x, y in cum_points)

cumulative_svg = f'''
<g id="cumulative-overlay">
  <polyline points="{points_str}"
    fill="none" stroke="{COLOR_LINE}" stroke-width="5"
    stroke-linecap="round" stroke-linejoin="round" />
'''

for i, (cx, cy) in enumerate(cum_points):
    pct_val = cumulative_pct[i]
    bar_top = bar_tops_y[i]
    lx = cx + 22
    ly = cy - 28
    anchor = "start"
    if abs(cy - bar_top) < 70:
        ly = min(cy - 50, bar_top - 38)
    if i >= len(cum_points) - 2:
        lx = cx - 22
        anchor = "end"
    if i == 1:
        lx = cx + 28
        ly = cy - 32
    # Prevent label from creeping into the title / top margin area
    if ly < y_plot_top + 50:
        ly = cy + 42  # flip below the dot
    cumulative_svg += f'''
  <circle cx="{cx:.1f}" cy="{cy:.1f}" r="10"
    fill="{COLOR_LINE}" stroke="{PAGE_BG}" stroke-width="3" />
  <text x="{lx:.1f}" y="{ly:.1f}"
    text-anchor="{anchor}" fill="{COLOR_LINE}"
    font-size="32" font-family="sans-serif" font-weight="bold">{pct_val:.0f}%</text>
'''

cumulative_svg += "</g>"

# Secondary y-axis on the right for cumulative percentage
right_edge = bar_centers_x[-1] + 90
sec_axis_svg = '<g id="secondary-y-axis">'

for pct in [0, 20, 40, 60, 80]:
    y_pos = y_base - (pct / 100.0) * plot_height
    sec_axis_svg += f'''
  <line x1="{right_edge:.1f}" y1="{y_pos:.1f}"
    x2="{right_edge + 12:.1f}" y2="{y_pos:.1f}"
    stroke="{COLOR_LINE}" stroke-width="2" />
  <text x="{right_edge + 22:.1f}" y="{y_pos + 12:.1f}"
    fill="{COLOR_LINE}" font-size="34" font-family="sans-serif"
    text-anchor="start">{pct}%</text>
'''

sec_axis_svg += f'''
  <line x1="{right_edge:.1f}" y1="{y_base:.1f}"
    x2="{right_edge:.1f}" y2="{y_plot_top:.1f}"
    stroke="{COLOR_LINE}" stroke-width="2" />
'''

mid_y = (y_base + y_plot_top) / 2
title_x = right_edge + 100
sec_axis_svg += f'''
  <text x="{title_x:.1f}" y="{mid_y:.1f}"
    fill="{COLOR_LINE}" font-size="42" font-family="sans-serif"
    text-anchor="middle"
    transform="rotate(-90, {title_x:.1f}, {mid_y:.1f})">Cumulative %</text>
'''
sec_axis_svg += "</g>"

# Bottom legend centred below the bars
legend_cx = (bar_centers_x[0] + bar_centers_x[-1]) / 2
legend_y = y_base + 110

legend_svg = f'''
<g id="pareto-legend">
  <rect x="{legend_cx - 510:.1f}" y="{legend_y - 14:.1f}"
    width="28" height="28" rx="4" fill="{COLOR_VITAL}" />
  <text x="{legend_cx - 472:.1f}" y="{legend_y + 10:.1f}"
    fill="{INK}" font-size="32" font-family="sans-serif">Vital Few</text>

  <rect x="{legend_cx - 306:.1f}" y="{legend_y - 14:.1f}"
    width="28" height="28" rx="4" fill="{COLOR_TRIVIAL}" />
  <text x="{legend_cx - 268:.1f}" y="{legend_y + 10:.1f}"
    fill="{INK}" font-size="32" font-family="sans-serif">Trivial Many</text>

  <line x1="{legend_cx - 38:.1f}" y1="{legend_y:.1f}"
    x2="{legend_cx + 10:.1f}" y2="{legend_y:.1f}"
    stroke="{COLOR_LINE}" stroke-width="4" />
  <circle cx="{legend_cx - 14:.1f}" cy="{legend_y:.1f}" r="7"
    fill="{COLOR_LINE}" stroke="{PAGE_BG}" stroke-width="2" />
  <text x="{legend_cx + 22:.1f}" y="{legend_y + 10:.1f}"
    fill="{INK}" font-size="32" font-family="sans-serif">Cumulative %</text>

  <line x1="{legend_cx + 240:.1f}" y1="{legend_y:.1f}"
    x2="{legend_cx + 290:.1f}" y2="{legend_y:.1f}"
    stroke="{COLOR_THRESHOLD}" stroke-width="3" stroke-dasharray="12,7" />
  <text x="{legend_cx + 302:.1f}" y="{legend_y + 10:.1f}"
    fill="{INK}" font-size="32" font-family="sans-serif">80% Threshold</text>
</g>
'''

# Inject all overlays before the closing </svg> tag
injection = ref_line_svg + cumulative_svg + sec_axis_svg + legend_svg
svg_str = svg_str.replace("</svg>", injection + "\n</svg>")

# Save
cairosvg.svg2png(
    bytestring=svg_str.encode("utf-8"), write_to=f"plot-{THEME}.png", output_width=3200, output_height=1800
)
with open(f"plot-{THEME}.html", "wb") as f:
    f.write(svg_str.encode("utf-8"))
Runnable source as JSON, for any HTTP client: https://api.anyplot.ai/specs/bar-pareto/pygal/code. Any spec id and library id listed in llms-full.txt fit the same URL shape; every URL below is complete and callable.
{
  "spec_id": "bar-pareto",
  "language": "python",
  "library": "pygal",
  "page": "https://anyplot.ai/bar-pareto/python/pygal",
  "hub": "https://anyplot.ai/bar-pareto",
  "code_json": "https://api.anyplot.ai/specs/bar-pareto/pygal/code",
  "spec_json": "https://api.anyplot.ai/specs/bar-pareto",
  "render_light_png": "https://storage.googleapis.com/anyplot-images/plots/bar-pareto/python/pygal/plot-light.png",
  "render_dark_png": "https://storage.googleapis.com/anyplot-images/plots/bar-pareto/python/pygal/plot-dark.png",
  "interactive_light_html": "https://storage.googleapis.com/anyplot-images/plots/bar-pareto/python/pygal/plot-light.html",
  "interactive_dark_html": "https://storage.googleapis.com/anyplot-images/plots/bar-pareto/python/pygal/plot-dark.html",
  "quality_score": 87.0,
  "license": "MIT",
  "guide": "https://anyplot.ai/llms.txt"
}
Part of Pareto Chart with Cumulative Line on anyplot.ai.