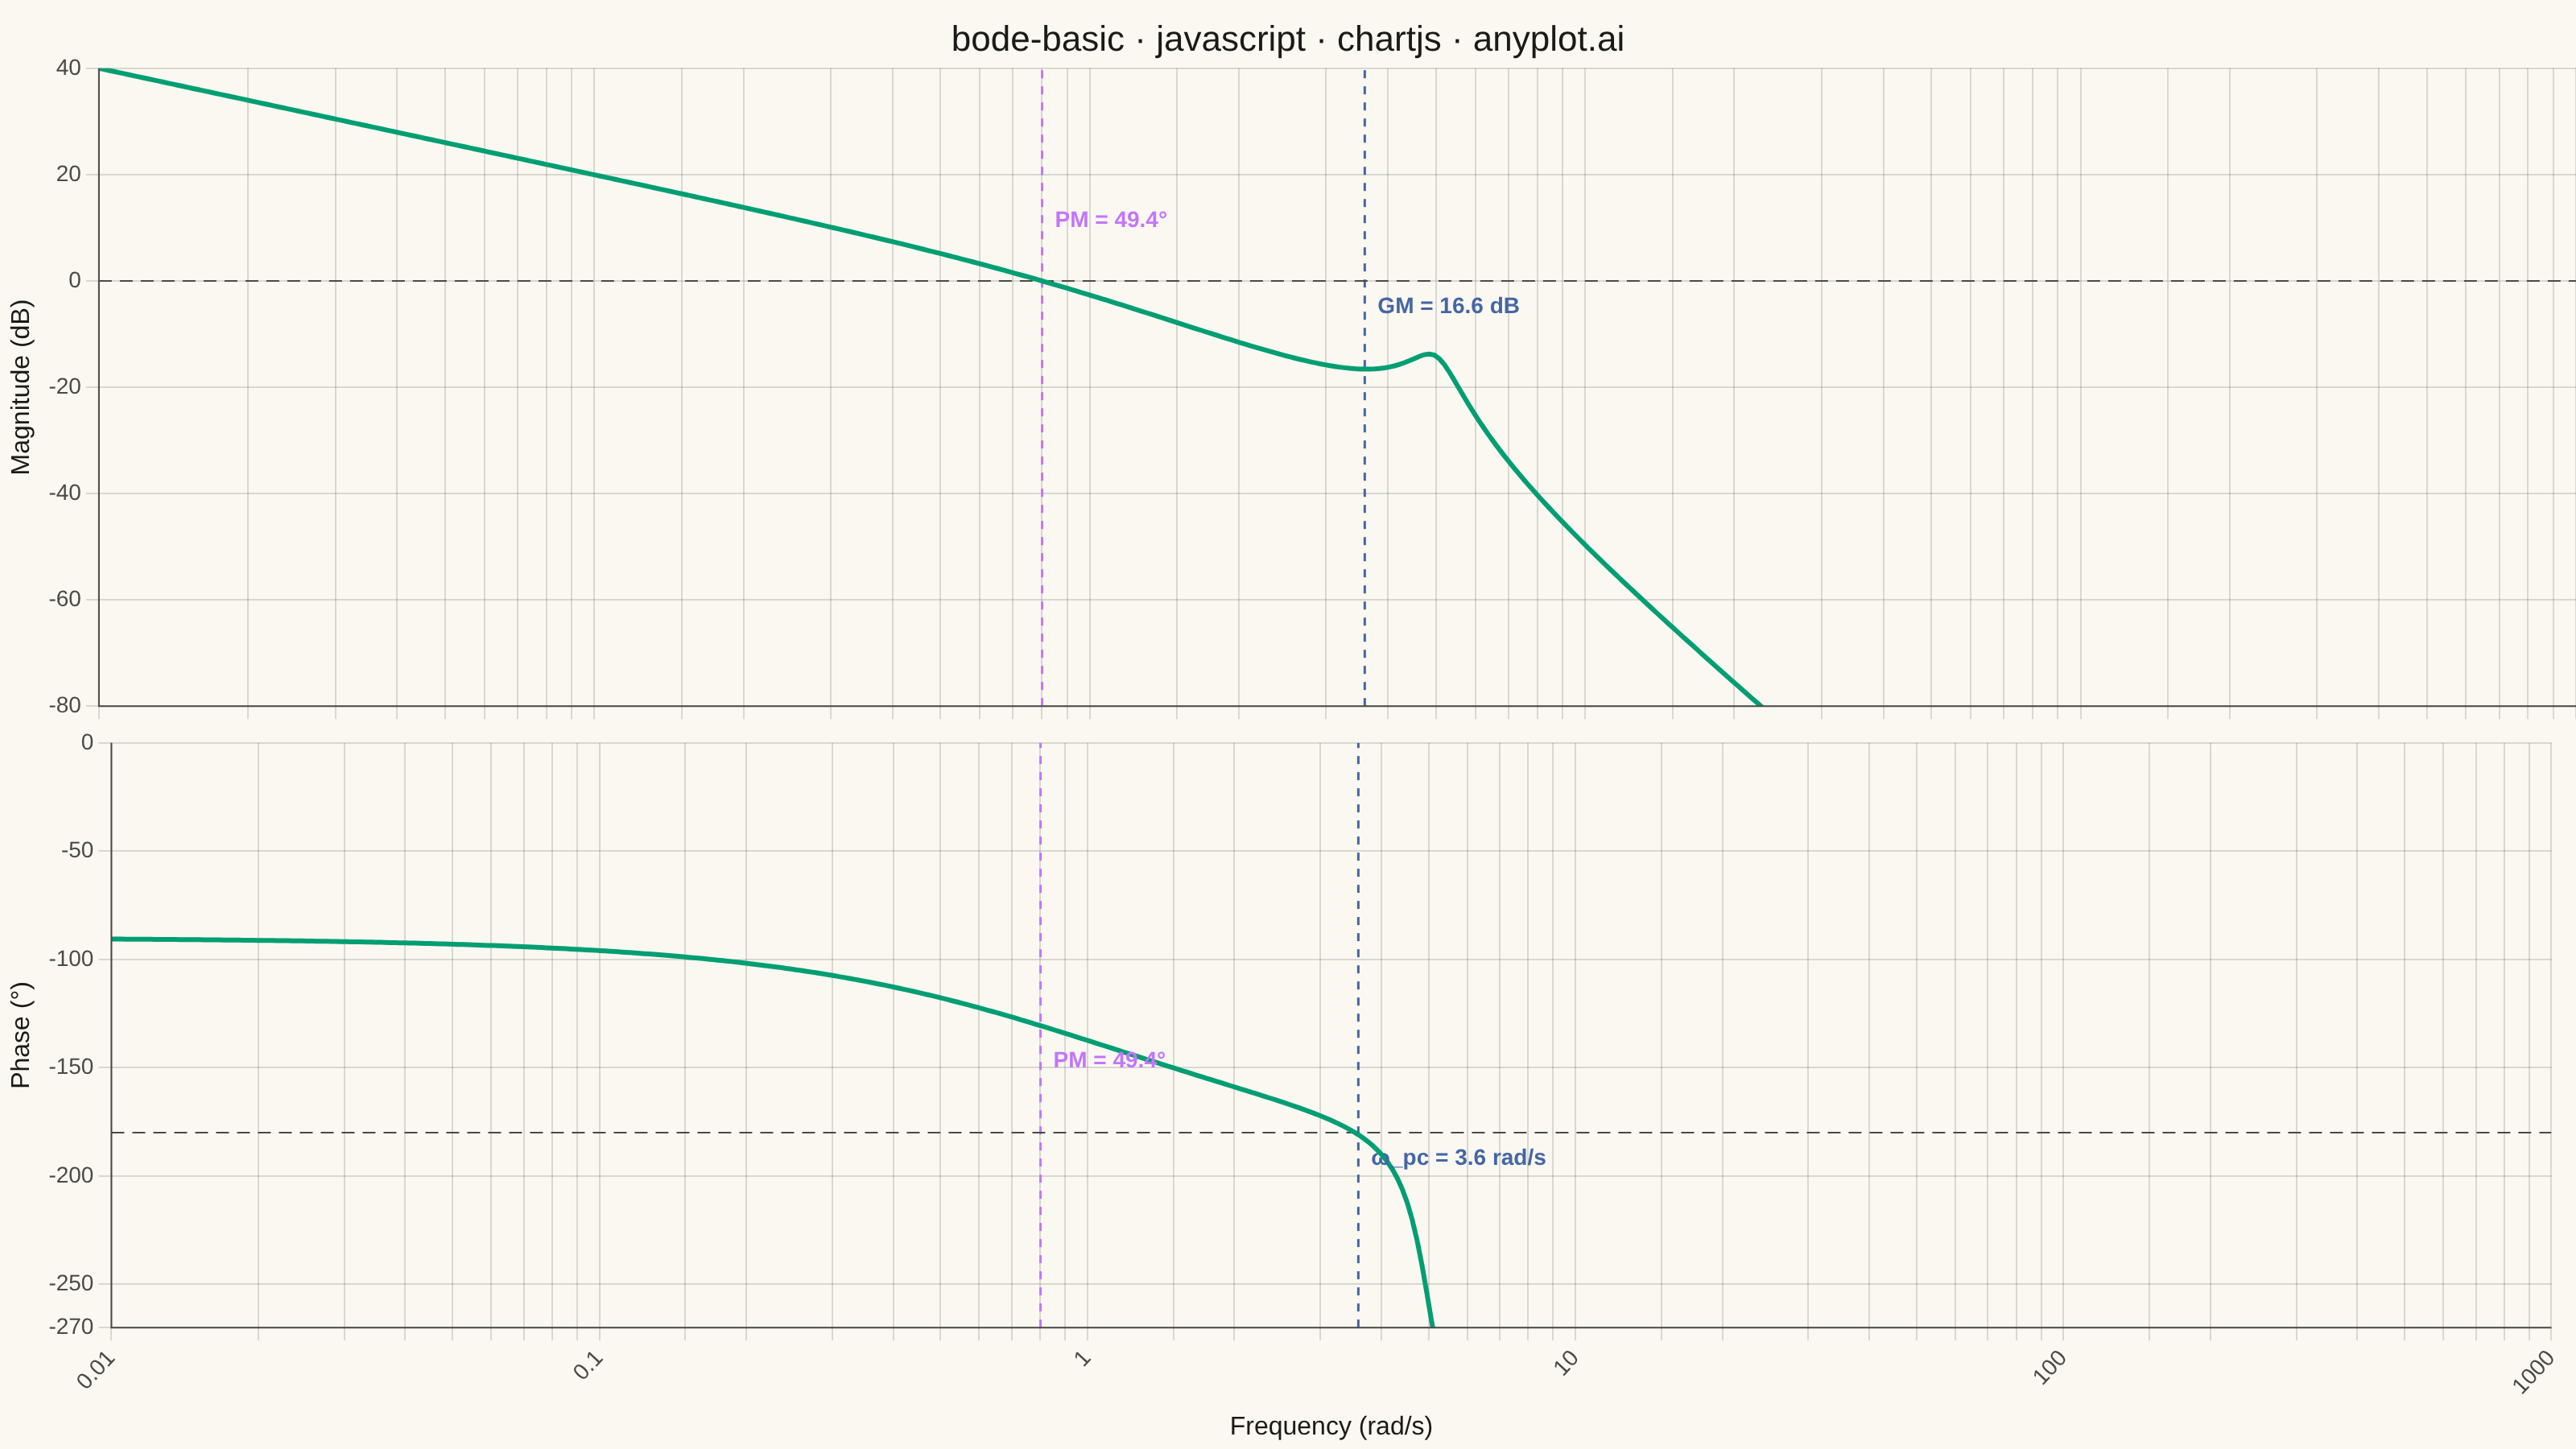
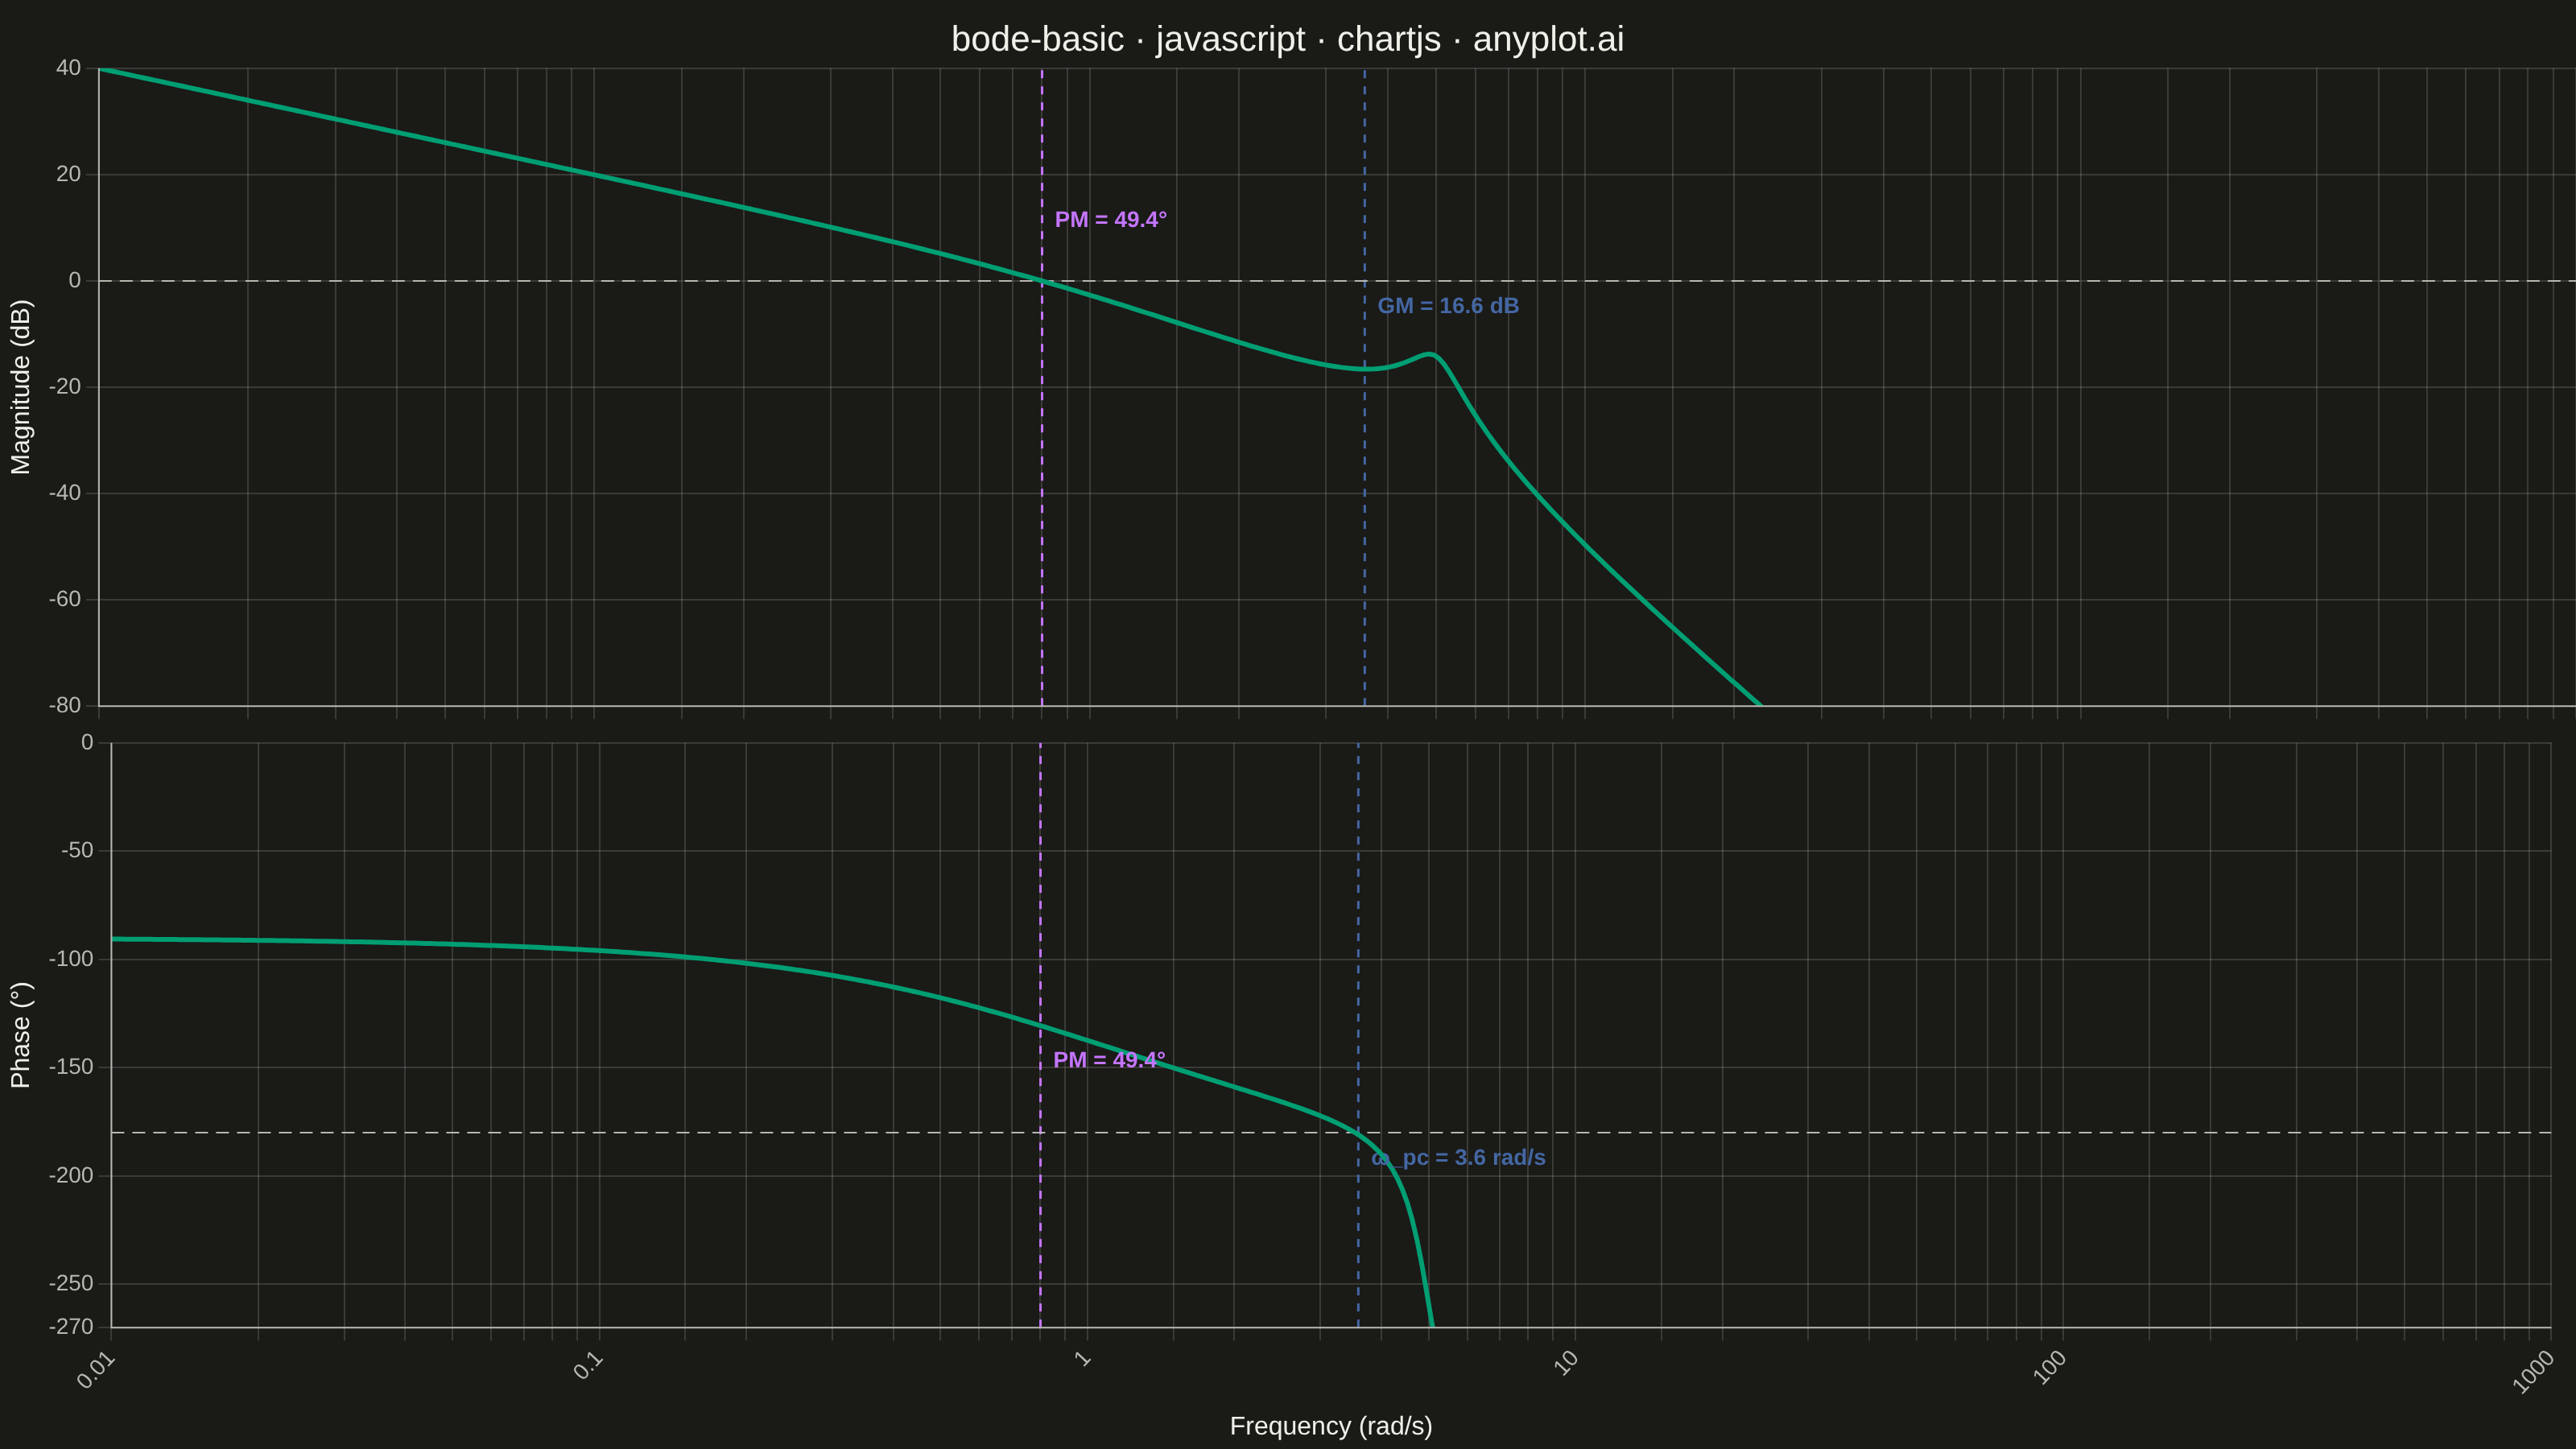
A Bode plot displays a system's frequency response as two vertically aligned panels: magnitude (in decibels) on top and phase (in degrees) on the bottom, both plotted against frequency on a shared logarithmic scale. This visualization is fundamental in control systems engineering and signal processing for analyzing how a system responds to sinusoidal inputs across a range of frequencies, revealing stability characteristics, bandwidth, and resonance behavior.
// anyplot.ai
// bode-basic: Bode Plot for Frequency Response
// Library: chartjs 4.4.7 | JavaScript 22.22.3
// Quality: 88/100 | Created: 2026-06-17

const t = window.ANYPLOT_TOKENS;

// Open-loop transfer function G(jω) = 1 / (jω · (1 + jω/p1) · ((jω/ωn)² + 2ζ(jω/ωn) + 1))
// Real pole at ω=1 rad/s, underdamped complex pair at ωn=5 rad/s (ζ=0.1) → resonance peak
const p1 = 1, wn = 5, zeta = 0.1;
const N = 500;
const W_MIN = 0.01, W_MAX = 1000;

const magData = [], phaseData = [];
let gainCrossFreq = null, phaseCrossFreq = null;
let phaseMargin = null, gainMargin = null;

for (let i = 0; i < N; i++) {
  const w = Math.pow(10, Math.log10(W_MIN) + (i / (N - 1)) * (Math.log10(W_MAX) - Math.log10(W_MIN)));

  // Underdamped second-order factor denominator: (1 - (ω/ωn)²) + j(2ζω/ωn)
  const re = 1 - (w / wn) ** 2;
  const im = 2 * zeta * w / wn;

  // |G| = (1/ω) · 1/sqrt(1+(ω/p1)²) · 1/sqrt(re²+im²)
  const mag = (1 / w) * (1 / Math.sqrt(1 + (w / p1) ** 2)) * (1 / Math.sqrt(re * re + im * im));
  const magDb = 20 * Math.log10(mag);

  // phase(G) = -90° - atan(ω/p1) - atan2(im, re) [degrees]
  const phase = -90 - (Math.atan(w / p1) * 180 / Math.PI) - (Math.atan2(im, re) * 180 / Math.PI);

  magData.push({ x: w, y: magDb });
  phaseData.push({ x: w, y: phase });

  if (i > 0) {
    if (gainCrossFreq === null && magData[i - 1].y > 0 && magDb <= 0) {
      gainCrossFreq = w;
      phaseMargin = 180 + phase;
    }
    if (phaseCrossFreq === null && phaseData[i - 1].y > -180 && phase <= -180) {
      phaseCrossFreq = w;
      gainMargin = -magDb;
    }
  }
}

// --- Layout: flex column, top = magnitude, bottom = phase ---
const container = document.getElementById('container');
container.style.display = 'flex';
container.style.flexDirection = 'column';
container.style.background = t.pageBg;
container.style.boxSizing = 'border-box';

function addPanel() {
  const wrap = document.createElement('div');
  wrap.style.cssText = 'position:relative;flex:1;width:100%;min-height:0;overflow:hidden';
  container.appendChild(wrap);
  const canvas = document.createElement('canvas');
  wrap.appendChild(canvas);
  return canvas;
}

const magCanvas = addPanel();
const phaseCanvas = addPanel();

// Log-axis tick formatter: show powers of 10 only
const logTickCallback = (val) => {
  const exp = Math.log10(val);
  const rounded = Math.round(exp);
  if (Math.abs(exp - rounded) < 0.02) {
    if (rounded >= 0) return String(Math.round(Math.pow(10, rounded)));
    return (Math.pow(10, rounded)).toFixed(-rounded);
  }
  return '';
};

const logXBase = {
  type: 'logarithmic',
  min: W_MIN,
  max: W_MAX,
  border: { display: false },
  grid: { color: t.grid },
  ticks: { color: t.inkSoft, font: { size: 14 }, callback: logTickCallback }
};

// L-frame plugin: draw only left + bottom axis lines (remove default box)
function makeLFramePlugin() {
  return {
    id: 'lFrame',
    afterDraw(chart) {
      const { ctx, chartArea } = chart;
      ctx.save();
      ctx.strokeStyle = t.inkSoft;
      ctx.lineWidth = 1;
      ctx.beginPath();
      ctx.moveTo(chartArea.left, chartArea.top);
      ctx.lineTo(chartArea.left, chartArea.bottom);
      ctx.lineTo(chartArea.right, chartArea.bottom);
      ctx.stroke();
      ctx.restore();
    }
  };
}

// Custom afterDraw plugin for margin annotations
function makeMarginPlugin(annotations) {
  return {
    id: 'marginLabels',
    afterDraw(chart) {
      const ctx = chart.ctx;
      const xScale = chart.scales.x;
      const yScale = chart.scales.y;
      ctx.save();
      ctx.font = 'bold 14px sans-serif';
      ctx.textBaseline = 'bottom';
      for (const ann of annotations) {
        if (ann.xValue == null) continue;
        const xPx = xScale.getPixelForValue(ann.xValue);
        const yPx = yScale.getPixelForValue(ann.yValue);
        ctx.fillStyle = ann.color;
        ctx.textAlign = ann.align || 'left';
        ctx.fillText(ann.text, xPx + (ann.dx || 6), yPx + (ann.dy || -4));
      }
      ctx.restore();
    }
  };
}

const MAG_MIN = -80, MAG_MAX = 40;
const PHASE_MIN = -270, PHASE_MAX = 0;

// ---- Magnitude chart datasets ----
const magDatasets = [
  {
    label: 'Magnitude',
    data: magData,
    borderColor: t.palette[0],
    backgroundColor: 'transparent',
    showLine: true,
    pointRadius: 0,
    borderWidth: 3
  },
  {
    label: '0 dB',
    data: [{ x: W_MIN, y: 0 }, { x: W_MAX, y: 0 }],
    borderColor: t.inkSoft,
    backgroundColor: 'transparent',
    showLine: true,
    pointRadius: 0,
    borderWidth: 1,
    borderDash: [8, 5]
  }
];

if (gainCrossFreq !== null) {
  magDatasets.push({
    label: 'Phase margin',
    data: [{ x: gainCrossFreq, y: MAG_MIN }, { x: gainCrossFreq, y: MAG_MAX }],
    borderColor: t.palette[1],
    backgroundColor: 'transparent',
    showLine: true,
    pointRadius: 0,
    borderWidth: 1.5,
    borderDash: [5, 5]
  });
}

if (phaseCrossFreq !== null) {
  magDatasets.push({
    label: 'Gain margin',
    data: [{ x: phaseCrossFreq, y: MAG_MIN }, { x: phaseCrossFreq, y: MAG_MAX }],
    borderColor: t.palette[2],
    backgroundColor: 'transparent',
    showLine: true,
    pointRadius: 0,
    borderWidth: 1.5,
    borderDash: [5, 5]
  });
}

const magAnnotations = [];
if (gainCrossFreq !== null && phaseMargin !== null) {
  magAnnotations.push({
    xValue: gainCrossFreq,
    yValue: 8,
    text: 'PM = ' + phaseMargin.toFixed(1) + '°',
    color: t.palette[1],
    align: 'left',
    dx: 8,
    dy: 0
  });
}
if (phaseCrossFreq !== null && gainMargin !== null) {
  magAnnotations.push({
    xValue: phaseCrossFreq,
    yValue: -gainMargin / 2,
    text: 'GM = ' + gainMargin.toFixed(1) + ' dB',
    color: t.palette[2],
    align: 'left',
    dx: 8,
    dy: 0
  });
}

new Chart(magCanvas, {
  type: 'scatter',
  data: { datasets: magDatasets },
  options: {
    responsive: true,
    maintainAspectRatio: false,
    animation: false,
    plugins: {
      title: {
        display: true,
        text: 'bode-basic · javascript · chartjs · anyplot.ai',
        color: t.ink,
        font: { size: 22, weight: '500' },
        padding: { top: 12, bottom: 4 }
      },
      legend: { display: false },
      tooltip: { enabled: false }
    },
    scales: {
      x: Object.assign({}, logXBase, {
        ticks: Object.assign({}, logXBase.ticks, { display: false })
      }),
      y: {
        min: MAG_MIN,
        max: MAG_MAX,
        border: { display: false },
        ticks: { color: t.inkSoft, font: { size: 14 } },
        grid: { color: t.grid },
        title: { display: true, text: 'Magnitude (dB)', color: t.ink, font: { size: 16 } }
      }
    }
  },
  plugins: [makeLFramePlugin(), makeMarginPlugin(magAnnotations)]
});

// ---- Phase chart datasets ----
const phaseDatasets = [
  {
    label: 'Phase',
    data: phaseData,
    borderColor: t.palette[0],
    backgroundColor: 'transparent',
    showLine: true,
    pointRadius: 0,
    borderWidth: 3
  },
  {
    label: '-180°',
    data: [{ x: W_MIN, y: -180 }, { x: W_MAX, y: -180 }],
    borderColor: t.inkSoft,
    backgroundColor: 'transparent',
    showLine: true,
    pointRadius: 0,
    borderWidth: 1,
    borderDash: [8, 5]
  }
];

if (gainCrossFreq !== null) {
  phaseDatasets.push({
    label: 'Phase margin',
    data: [{ x: gainCrossFreq, y: PHASE_MIN }, { x: gainCrossFreq, y: PHASE_MAX }],
    borderColor: t.palette[1],
    backgroundColor: 'transparent',
    showLine: true,
    pointRadius: 0,
    borderWidth: 1.5,
    borderDash: [5, 5]
  });
}

if (phaseCrossFreq !== null) {
  phaseDatasets.push({
    label: 'Gain margin',
    data: [{ x: phaseCrossFreq, y: PHASE_MIN }, { x: phaseCrossFreq, y: PHASE_MAX }],
    borderColor: t.palette[2],
    backgroundColor: 'transparent',
    showLine: true,
    pointRadius: 0,
    borderWidth: 1.5,
    borderDash: [5, 5]
  });
}

const phaseAnnotations = [];
if (gainCrossFreq !== null && phaseMargin !== null) {
  phaseAnnotations.push({
    xValue: gainCrossFreq,
    yValue: -180 + phaseMargin / 2,
    text: 'PM = ' + phaseMargin.toFixed(1) + '°',
    color: t.palette[1],
    align: 'left',
    dx: 8,
    dy: 0
  });
}
if (phaseCrossFreq !== null) {
  phaseAnnotations.push({
    xValue: phaseCrossFreq,
    yValue: -200,
    text: 'ω_pc = ' + phaseCrossFreq.toFixed(1) + ' rad/s',
    color: t.palette[2],
    align: 'left',
    dx: 8,
    dy: 0
  });
}

new Chart(phaseCanvas, {
  type: 'scatter',
  data: { datasets: phaseDatasets },
  options: {
    responsive: true,
    maintainAspectRatio: false,
    animation: false,
    plugins: {
      title: { display: false },
      legend: { display: false },
      tooltip: { enabled: false }
    },
    scales: {
      x: Object.assign({}, logXBase, {
        title: { display: true, text: 'Frequency (rad/s)', color: t.ink, font: { size: 16 } }
      }),
      y: {
        min: PHASE_MIN,
        max: PHASE_MAX,
        border: { display: false },
        ticks: { color: t.inkSoft, font: { size: 14 } },
        grid: { color: t.grid },
        title: { display: true, text: 'Phase (°)', color: t.ink, font: { size: 16 } }
      }
    }
  },
  plugins: [makeLFramePlugin(), makeMarginPlugin(phaseAnnotations)]
});
Runnable source as JSON, for any HTTP client: https://api.anyplot.ai/specs/bode-basic/chartjs/code. Any spec id and library id listed in llms-full.txt fit the same URL shape; every URL below is complete and callable.
{
  "spec_id": "bode-basic",
  "language": "javascript",
  "library": "chartjs",
  "page": "https://anyplot.ai/bode-basic/javascript/chartjs",
  "hub": "https://anyplot.ai/bode-basic",
  "code_json": "https://api.anyplot.ai/specs/bode-basic/chartjs/code",
  "spec_json": "https://api.anyplot.ai/specs/bode-basic",
  "render_light_png": "https://storage.googleapis.com/anyplot-images/plots/bode-basic/javascript/chartjs/plot-light.png",
  "render_dark_png": "https://storage.googleapis.com/anyplot-images/plots/bode-basic/javascript/chartjs/plot-dark.png",
  "interactive_light_html": "https://storage.googleapis.com/anyplot-images/plots/bode-basic/javascript/chartjs/plot-light.html",
  "interactive_dark_html": "https://storage.googleapis.com/anyplot-images/plots/bode-basic/javascript/chartjs/plot-dark.html",
  "quality_score": 88.0,
  "license": "MIT",
  "guide": "https://anyplot.ai/llms.txt"
}
Part of Bode Plot for Frequency Response on anyplot.ai.