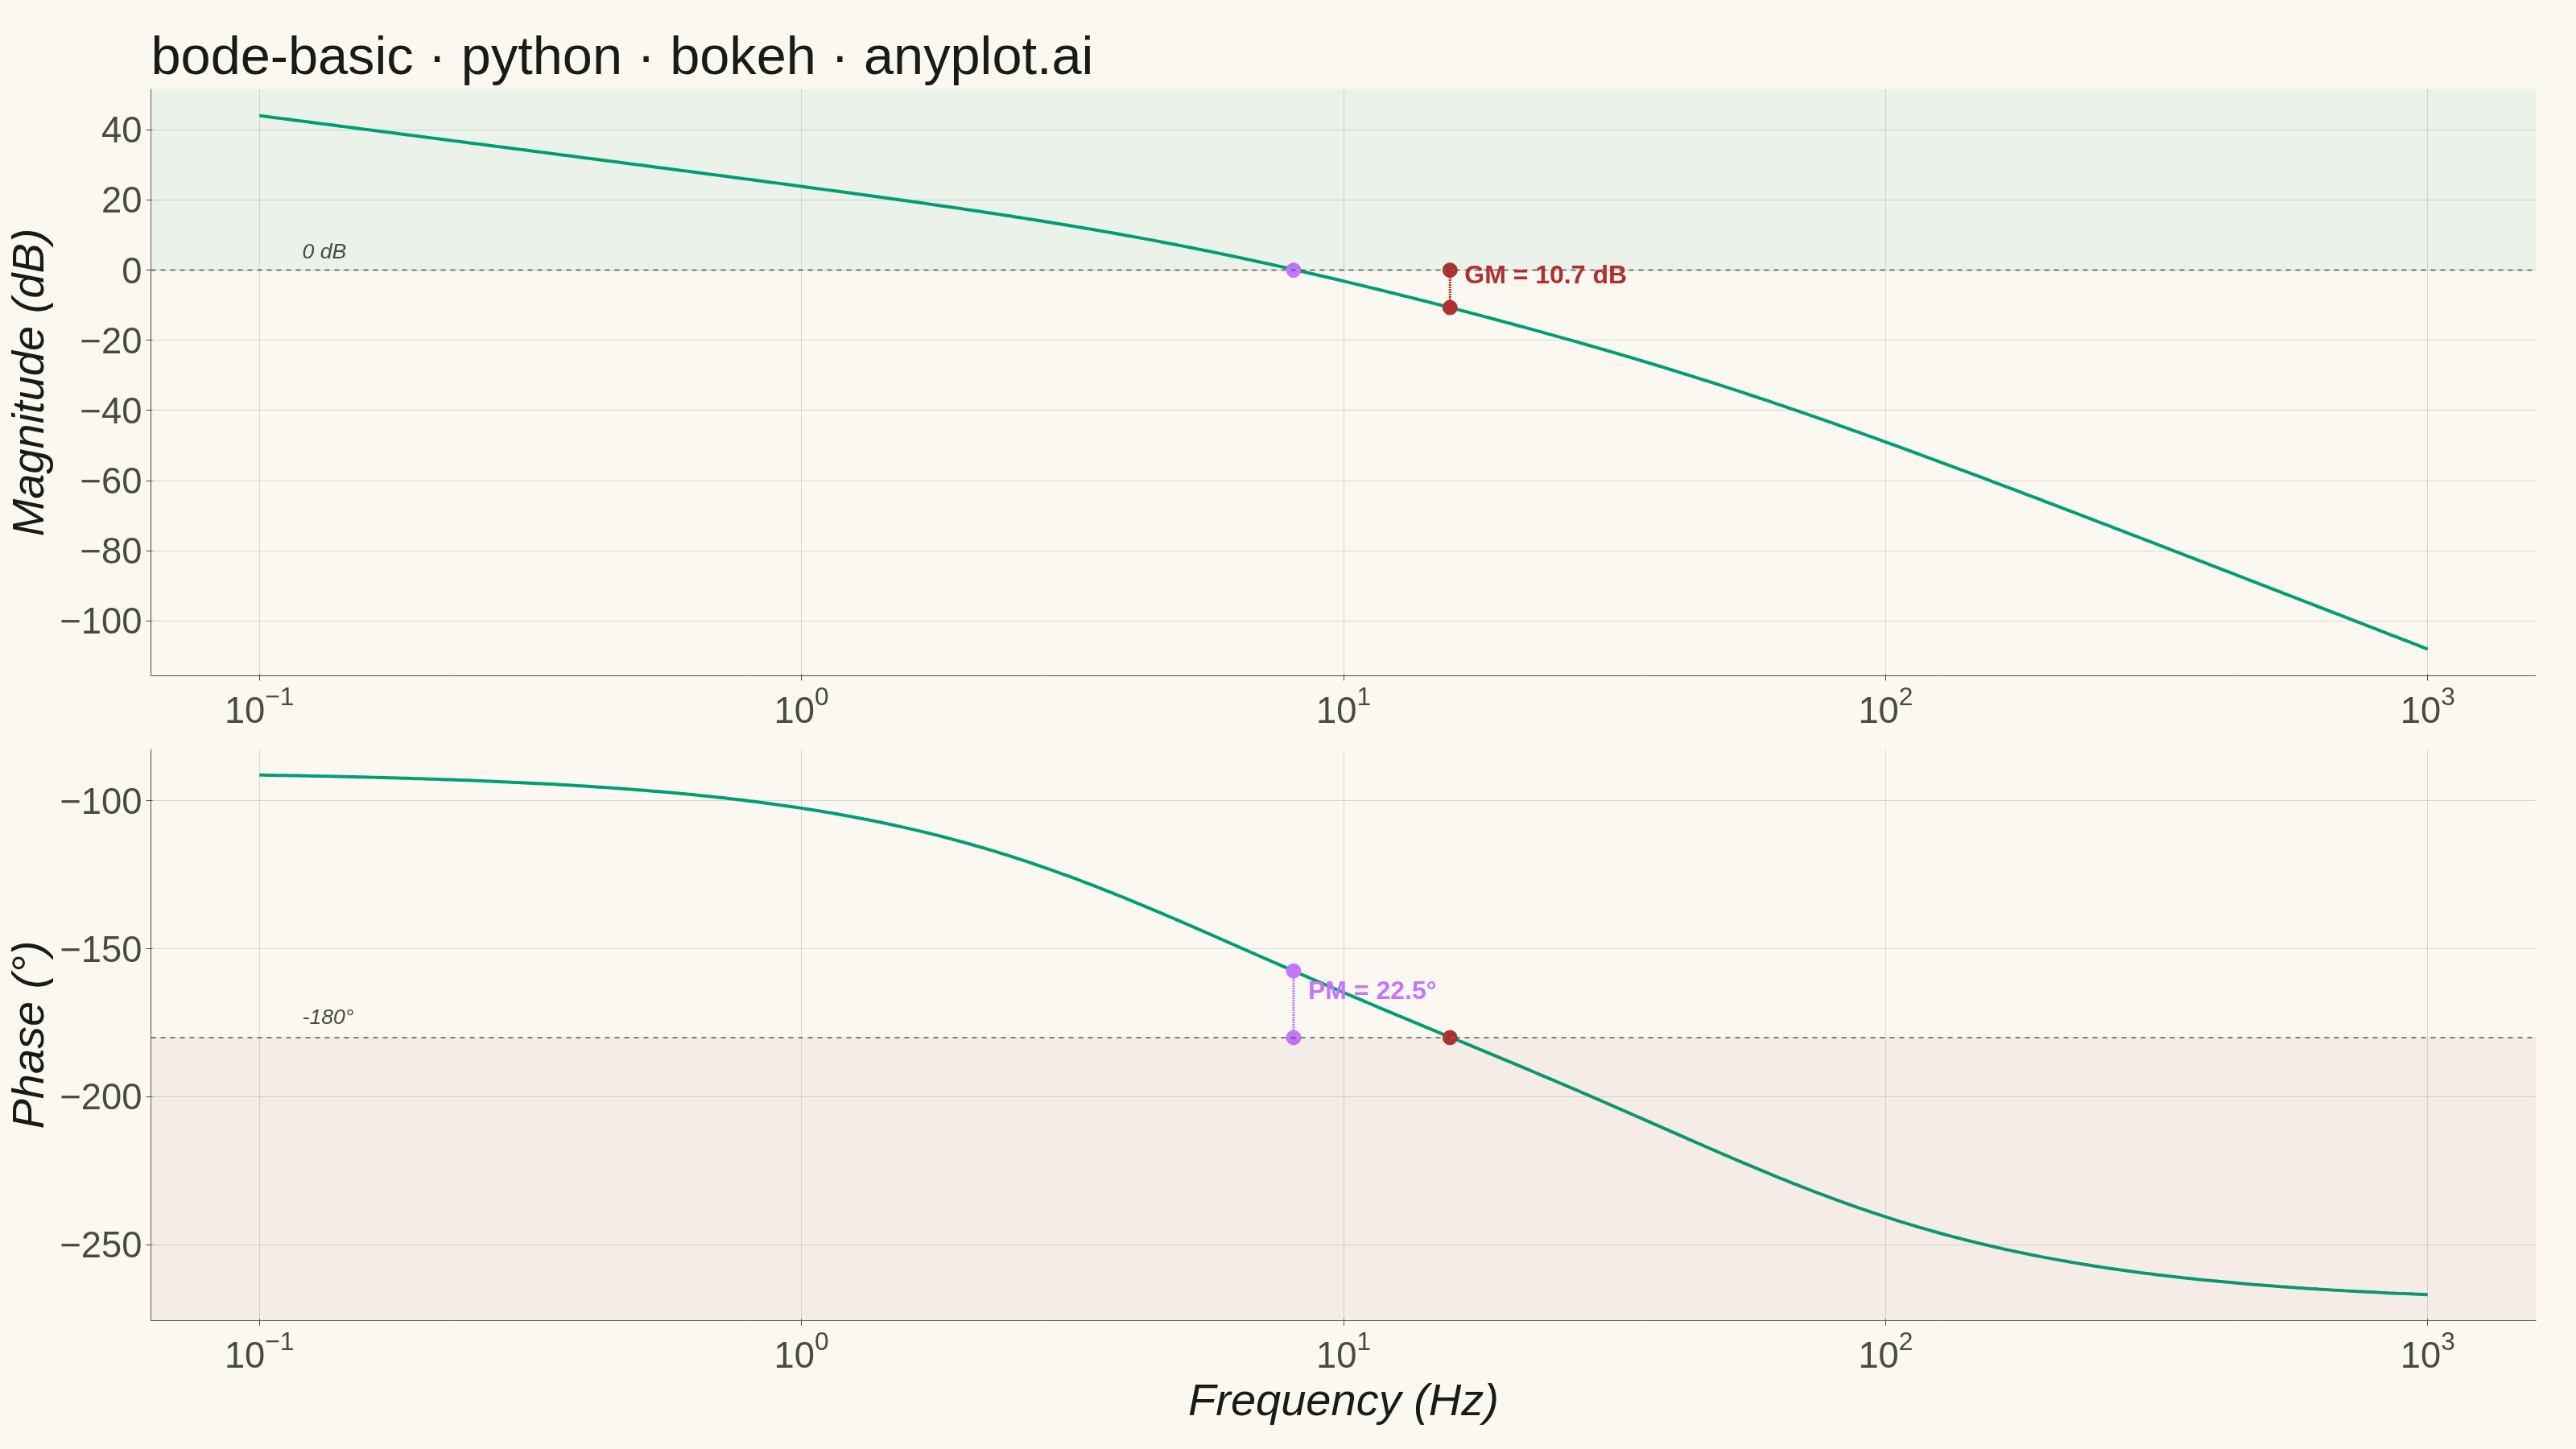
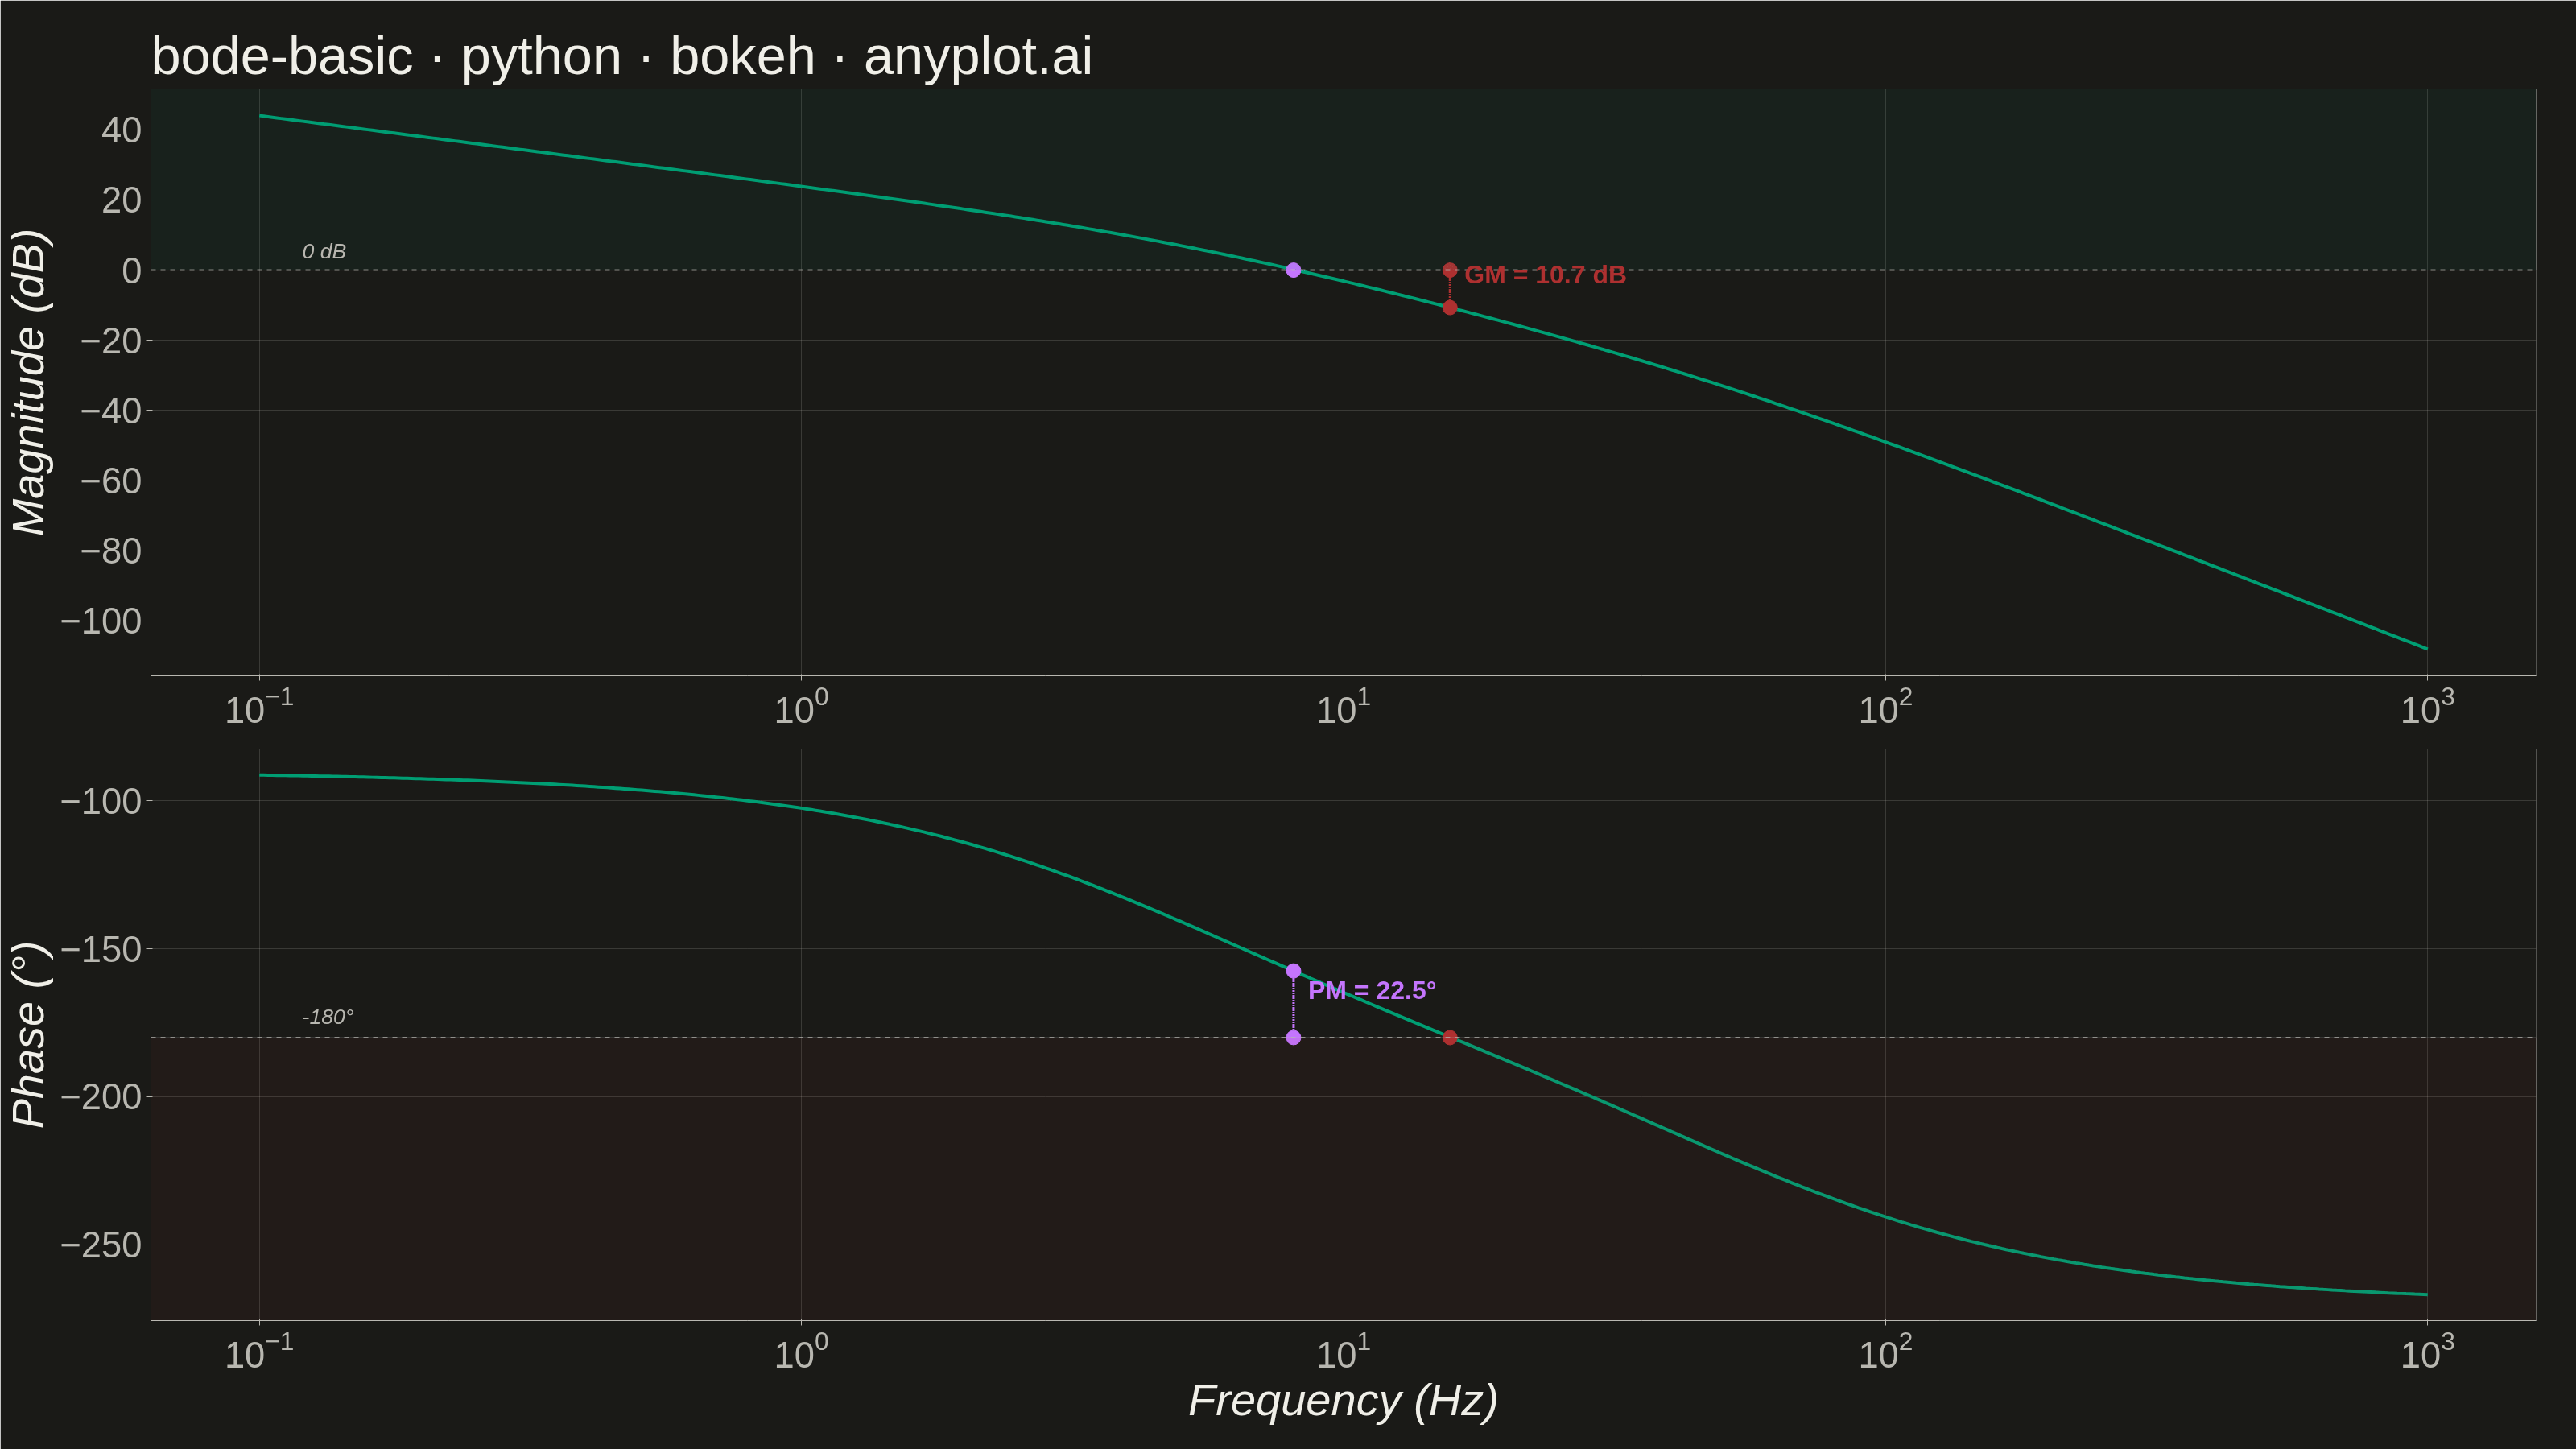
A Bode plot displays a system's frequency response as two vertically aligned panels: magnitude (in decibels) on top and phase (in degrees) on the bottom, both plotted against frequency on a shared logarithmic scale. This visualization is fundamental in control systems engineering and signal processing for analyzing how a system responds to sinusoidal inputs across a range of frequencies, revealing stability characteristics, bandwidth, and resonance behavior.
""" anyplot.ai
bode-basic: Bode Plot for Frequency Response
Library: bokeh 3.9.1 | Python 3.13.13
Quality: 91/100 | Updated: 2026-06-17
"""

import os
import sys


# Prevent self-import: this file is named bokeh.py, which shadows the installed
# bokeh package when its directory sits at the front of sys.path.
_this_dir = os.path.dirname(os.path.abspath(__file__))
sys.path = [p for p in sys.path if os.path.abspath(p or ".") != _this_dir]

import time
from pathlib import Path

import numpy as np
from bokeh.io import output_file, save
from bokeh.layouts import column
from bokeh.models import BoxAnnotation, ColumnDataSource, HoverTool, Label, Span
from bokeh.plotting import figure
from selenium import webdriver
from selenium.webdriver.chrome.options import Options


# Theme tokens — Imprint palette, theme-adaptive chrome
THEME = os.getenv("ANYPLOT_THEME", "light")
PAGE_BG = "#FAF8F1" if THEME == "light" else "#1A1A17"
INK = "#1A1A17" if THEME == "light" else "#F0EFE8"
INK_SOFT = "#4A4A44" if THEME == "light" else "#B8B7B0"

# Imprint palette — frequency response curves always use brand green (first series)
BRAND = "#009E73"  # Imprint position 1 — Bode curves
GM_COLOR = "#AE3030"  # Imprint position 5 — gain margin (semantic red: stability risk)
PM_COLOR = "#C475FD"  # Imprint position 2 — phase margin

# Data — third-order open-loop transfer function: H(s) = K / (s * (s/w1+1) * (s/w2+1))
K = 100
w1 = 2 * np.pi * 5  # pole at 5 Hz
w2 = 2 * np.pi * 50  # pole at 50 Hz

frequency_hz = np.logspace(-1, 3, 500)
omega = 2 * np.pi * frequency_hz
s = 1j * omega

H = K / (s * (s / w1 + 1) * (s / w2 + 1))
magnitude_db = 20 * np.log10(np.abs(H))
phase_deg = np.degrees(np.unwrap(np.angle(H)))

# Gain crossover: where |H(jw)| = 0 dB
sign_changes = np.diff(np.sign(magnitude_db))
gc_indices = np.where(sign_changes != 0)[0]
gain_cross_idx = gc_indices[0] if len(gc_indices) > 0 else np.argmin(np.abs(magnitude_db))
gain_cross_freq = frequency_hz[gain_cross_idx]
phase_at_gain_cross = phase_deg[gain_cross_idx]
phase_margin = 180 + phase_at_gain_cross

# Phase crossover: where ∠H(jw) = -180°
phase_shifted = phase_deg + 180
sign_changes_phase = np.diff(np.sign(phase_shifted))
pc_indices = np.where(sign_changes_phase != 0)[0]
phase_cross_idx = pc_indices[0] if len(pc_indices) > 0 else np.argmin(np.abs(phase_deg + 180))
phase_cross_freq = frequency_hz[phase_cross_idx]
mag_at_phase_cross = magnitude_db[phase_cross_idx]
gain_margin = -mag_at_phase_cross

source = ColumnDataSource(data={"frequency": frequency_hz, "magnitude": magnitude_db, "phase": phase_deg})

TITLE = "bode-basic · python · bokeh · anyplot.ai"

# Magnitude plot (top panel) — width=3200 height=900, two panels stack to 3200×1800
p_mag = figure(
    width=3200,
    height=900,
    x_axis_type="log",
    x_axis_label="",
    y_axis_label="Magnitude (dB)",
    title=TITLE,
    toolbar_location=None,
    min_border_bottom=30,
    min_border_left=180,
    min_border_top=110,
    min_border_right=50,
)

p_mag.add_layout(BoxAnnotation(bottom=0, fill_color=BRAND, fill_alpha=0.06))
p_mag.line("frequency", "magnitude", source=source, line_width=4, color=BRAND)
p_mag.add_layout(
    Span(location=0, dimension="width", line_color=INK_SOFT, line_width=2, line_dash="dashed", line_alpha=0.7)
)
p_mag.add_layout(Label(x=0.12, y=2, text="0 dB", text_font_size="20pt", text_color=INK_SOFT, text_font_style="italic"))
p_mag.scatter([phase_cross_freq], [mag_at_phase_cross], size=18, color=GM_COLOR, marker="circle")
p_mag.scatter([phase_cross_freq], [0], size=18, color=GM_COLOR, marker="circle")
p_mag.segment(
    x0=[phase_cross_freq],
    y0=[mag_at_phase_cross],
    x1=[phase_cross_freq],
    y1=[0],
    line_width=3,
    color=GM_COLOR,
    line_dash="dotted",
)
p_mag.add_layout(
    Label(
        x=phase_cross_freq,
        y=mag_at_phase_cross / 2,
        text=f"GM = {gain_margin:.1f} dB",
        text_font_size="24pt",
        text_font_style="bold",
        text_color=GM_COLOR,
        x_offset=18,
    )
)
p_mag.scatter([gain_cross_freq], [0], size=18, color=PM_COLOR, marker="circle")
p_mag.add_tools(
    HoverTool(
        tooltips=[("Frequency", "@frequency{0.00} Hz"), ("Magnitude", "@magnitude{0.0} dB")],
        mode="vline",
        line_policy="nearest",
    )
)

p_mag.background_fill_color = PAGE_BG
p_mag.border_fill_color = PAGE_BG
p_mag.outline_line_color = None
p_mag.title.text_color = INK
p_mag.title.text_font_size = "50pt"
p_mag.title.text_font_style = "normal"
p_mag.xaxis.axis_label_text_color = INK
p_mag.yaxis.axis_label_text_color = INK
p_mag.xaxis.major_label_text_color = INK_SOFT
p_mag.yaxis.major_label_text_color = INK_SOFT
p_mag.xaxis.axis_line_color = INK_SOFT
p_mag.yaxis.axis_line_color = INK_SOFT
p_mag.xaxis.major_tick_line_color = INK_SOFT
p_mag.yaxis.major_tick_line_color = INK_SOFT
p_mag.xaxis.minor_tick_line_color = None
p_mag.yaxis.minor_tick_line_color = None
p_mag.yaxis.axis_label_text_font_size = "42pt"
p_mag.xaxis.axis_label_text_font_size = "42pt"
p_mag.xaxis.major_label_text_font_size = "34pt"
p_mag.yaxis.major_label_text_font_size = "34pt"
p_mag.ygrid.grid_line_alpha = 0.15
p_mag.xgrid.grid_line_alpha = 0.15
p_mag.ygrid.grid_line_color = INK
p_mag.xgrid.grid_line_color = INK

# Phase plot (bottom panel)
p_phase = figure(
    width=3200,
    height=900,
    x_axis_type="log",
    x_axis_label="Frequency (Hz)",
    y_axis_label="Phase (°)",
    x_range=p_mag.x_range,
    toolbar_location=None,
    min_border_bottom=160,
    min_border_left=180,
    min_border_top=30,
    min_border_right=50,
)

p_phase.add_layout(BoxAnnotation(top=-180, fill_color=GM_COLOR, fill_alpha=0.06))
p_phase.line("frequency", "phase", source=source, line_width=4, color=BRAND)
p_phase.add_layout(
    Span(location=-180, dimension="width", line_color=INK_SOFT, line_width=2, line_dash="dashed", line_alpha=0.7)
)
p_phase.add_layout(
    Label(x=0.12, y=-177, text="-180°", text_font_size="20pt", text_color=INK_SOFT, text_font_style="italic")
)
p_phase.scatter([gain_cross_freq], [phase_at_gain_cross], size=18, color=PM_COLOR, marker="circle")
p_phase.scatter([gain_cross_freq], [-180], size=18, color=PM_COLOR, marker="circle")
p_phase.segment(
    x0=[gain_cross_freq],
    y0=[phase_at_gain_cross],
    x1=[gain_cross_freq],
    y1=[-180],
    line_width=3,
    color=PM_COLOR,
    line_dash="dotted",
)
p_phase.add_layout(
    Label(
        x=gain_cross_freq,
        y=(phase_at_gain_cross + (-180)) / 2,
        text=f"PM = {phase_margin:.1f}°",
        text_font_size="24pt",
        text_font_style="bold",
        text_color=PM_COLOR,
        x_offset=18,
    )
)
p_phase.scatter([phase_cross_freq], [-180], size=18, color=GM_COLOR, marker="circle")
p_phase.add_tools(
    HoverTool(
        tooltips=[("Frequency", "@frequency{0.00} Hz"), ("Phase", "@phase{0.0}°")], mode="vline", line_policy="nearest"
    )
)

p_phase.background_fill_color = PAGE_BG
p_phase.border_fill_color = PAGE_BG
p_phase.outline_line_color = None
p_phase.xaxis.axis_label_text_color = INK
p_phase.yaxis.axis_label_text_color = INK
p_phase.xaxis.major_label_text_color = INK_SOFT
p_phase.yaxis.major_label_text_color = INK_SOFT
p_phase.xaxis.axis_line_color = INK_SOFT
p_phase.yaxis.axis_line_color = INK_SOFT
p_phase.xaxis.major_tick_line_color = INK_SOFT
p_phase.yaxis.major_tick_line_color = INK_SOFT
p_phase.xaxis.minor_tick_line_color = None
p_phase.yaxis.minor_tick_line_color = None
p_phase.yaxis.axis_label_text_font_size = "42pt"
p_phase.xaxis.axis_label_text_font_size = "42pt"
p_phase.xaxis.major_label_text_font_size = "34pt"
p_phase.yaxis.major_label_text_font_size = "34pt"
p_phase.ygrid.grid_line_alpha = 0.15
p_phase.xgrid.grid_line_alpha = 0.15
p_phase.ygrid.grid_line_color = INK
p_phase.xgrid.grid_line_color = INK

# Layout — two 900px panels stacked to 3200×1800 total
layout = column(p_mag, p_phase, spacing=0)

# Save interactive HTML catalog artifact
output_file(f"plot-{THEME}.html")
save(layout)

# Screenshot with headless Chrome — CDP setDeviceMetricsOverride forces exact
# inner viewport (--window-size alone is consumed by browser chrome in headless).
W, H = 3200, 1800
opts = Options()
for arg in (
    "--headless=new",
    "--no-sandbox",
    "--disable-dev-shm-usage",
    "--disable-gpu",
    f"--window-size={W},{H}",
    "--hide-scrollbars",
):
    opts.add_argument(arg)
driver = webdriver.Chrome(options=opts)
driver.execute_cdp_cmd(
    "Emulation.setDeviceMetricsOverride", {"width": W, "height": H, "deviceScaleFactor": 1, "mobile": False}
)
driver.get(f"file://{Path(f'plot-{THEME}.html').resolve()}")
time.sleep(3)
driver.save_screenshot(f"plot-{THEME}.png")
driver.quit()

# Belt-and-braces: pad/crop to exact dims so the post-render gate always passes
from PIL import Image as _PILImage


_img = _PILImage.open(f"plot-{THEME}.png").convert("RGB")
if _img.size != (W, H):
    _norm = _PILImage.new("RGB", (W, H), PAGE_BG)
    _norm.paste(_img, ((W - _img.size[0]) // 2, (H - _img.size[1]) // 2))
    _norm.save(f"plot-{THEME}.png")
Runnable source as JSON, for any HTTP client: https://api.anyplot.ai/specs/bode-basic/bokeh/code. Any spec id and library id listed in llms-full.txt fit the same URL shape; every URL below is complete and callable.
{
  "spec_id": "bode-basic",
  "language": "python",
  "library": "bokeh",
  "page": "https://anyplot.ai/bode-basic/python/bokeh",
  "hub": "https://anyplot.ai/bode-basic",
  "code_json": "https://api.anyplot.ai/specs/bode-basic/bokeh/code",
  "spec_json": "https://api.anyplot.ai/specs/bode-basic",
  "render_light_png": "https://storage.googleapis.com/anyplot-images/plots/bode-basic/python/bokeh/plot-light.png",
  "render_dark_png": "https://storage.googleapis.com/anyplot-images/plots/bode-basic/python/bokeh/plot-dark.png",
  "interactive_light_html": "https://storage.googleapis.com/anyplot-images/plots/bode-basic/python/bokeh/plot-light.html",
  "interactive_dark_html": "https://storage.googleapis.com/anyplot-images/plots/bode-basic/python/bokeh/plot-dark.html",
  "quality_score": 91.0,
  "license": "MIT",
  "guide": "https://anyplot.ai/llms.txt"
}
Part of Bode Plot for Frequency Response on anyplot.ai.