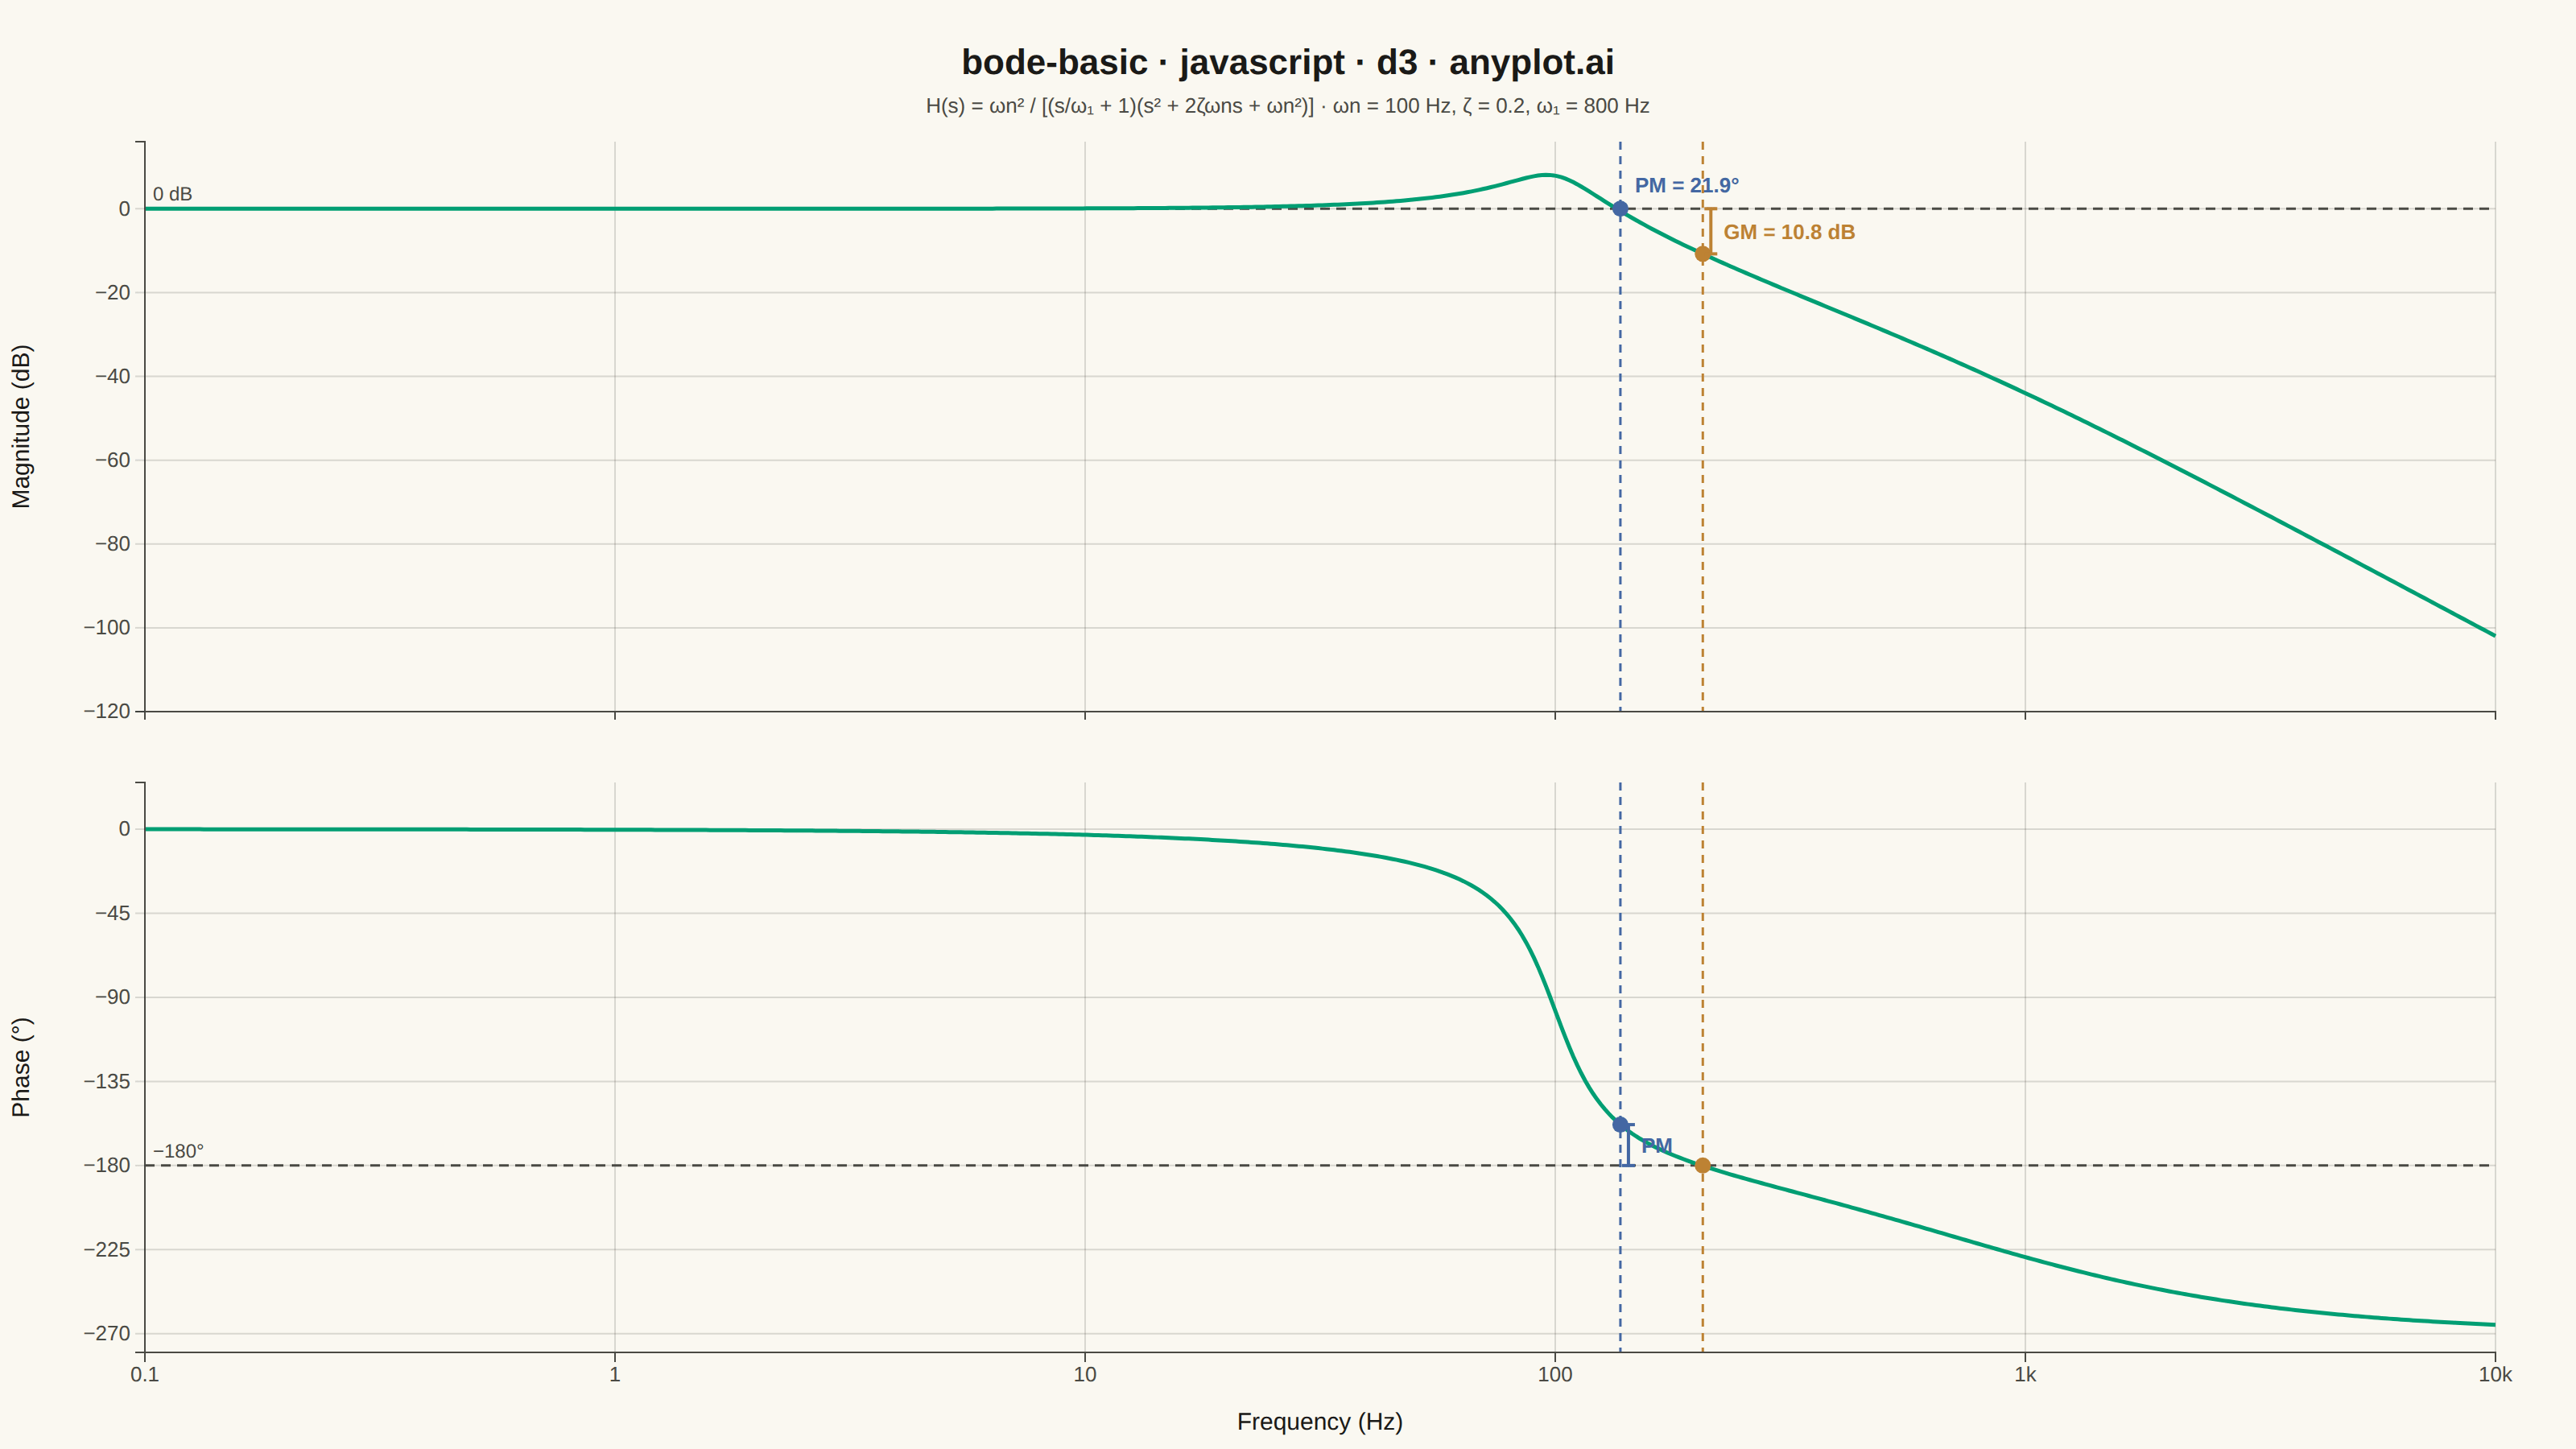
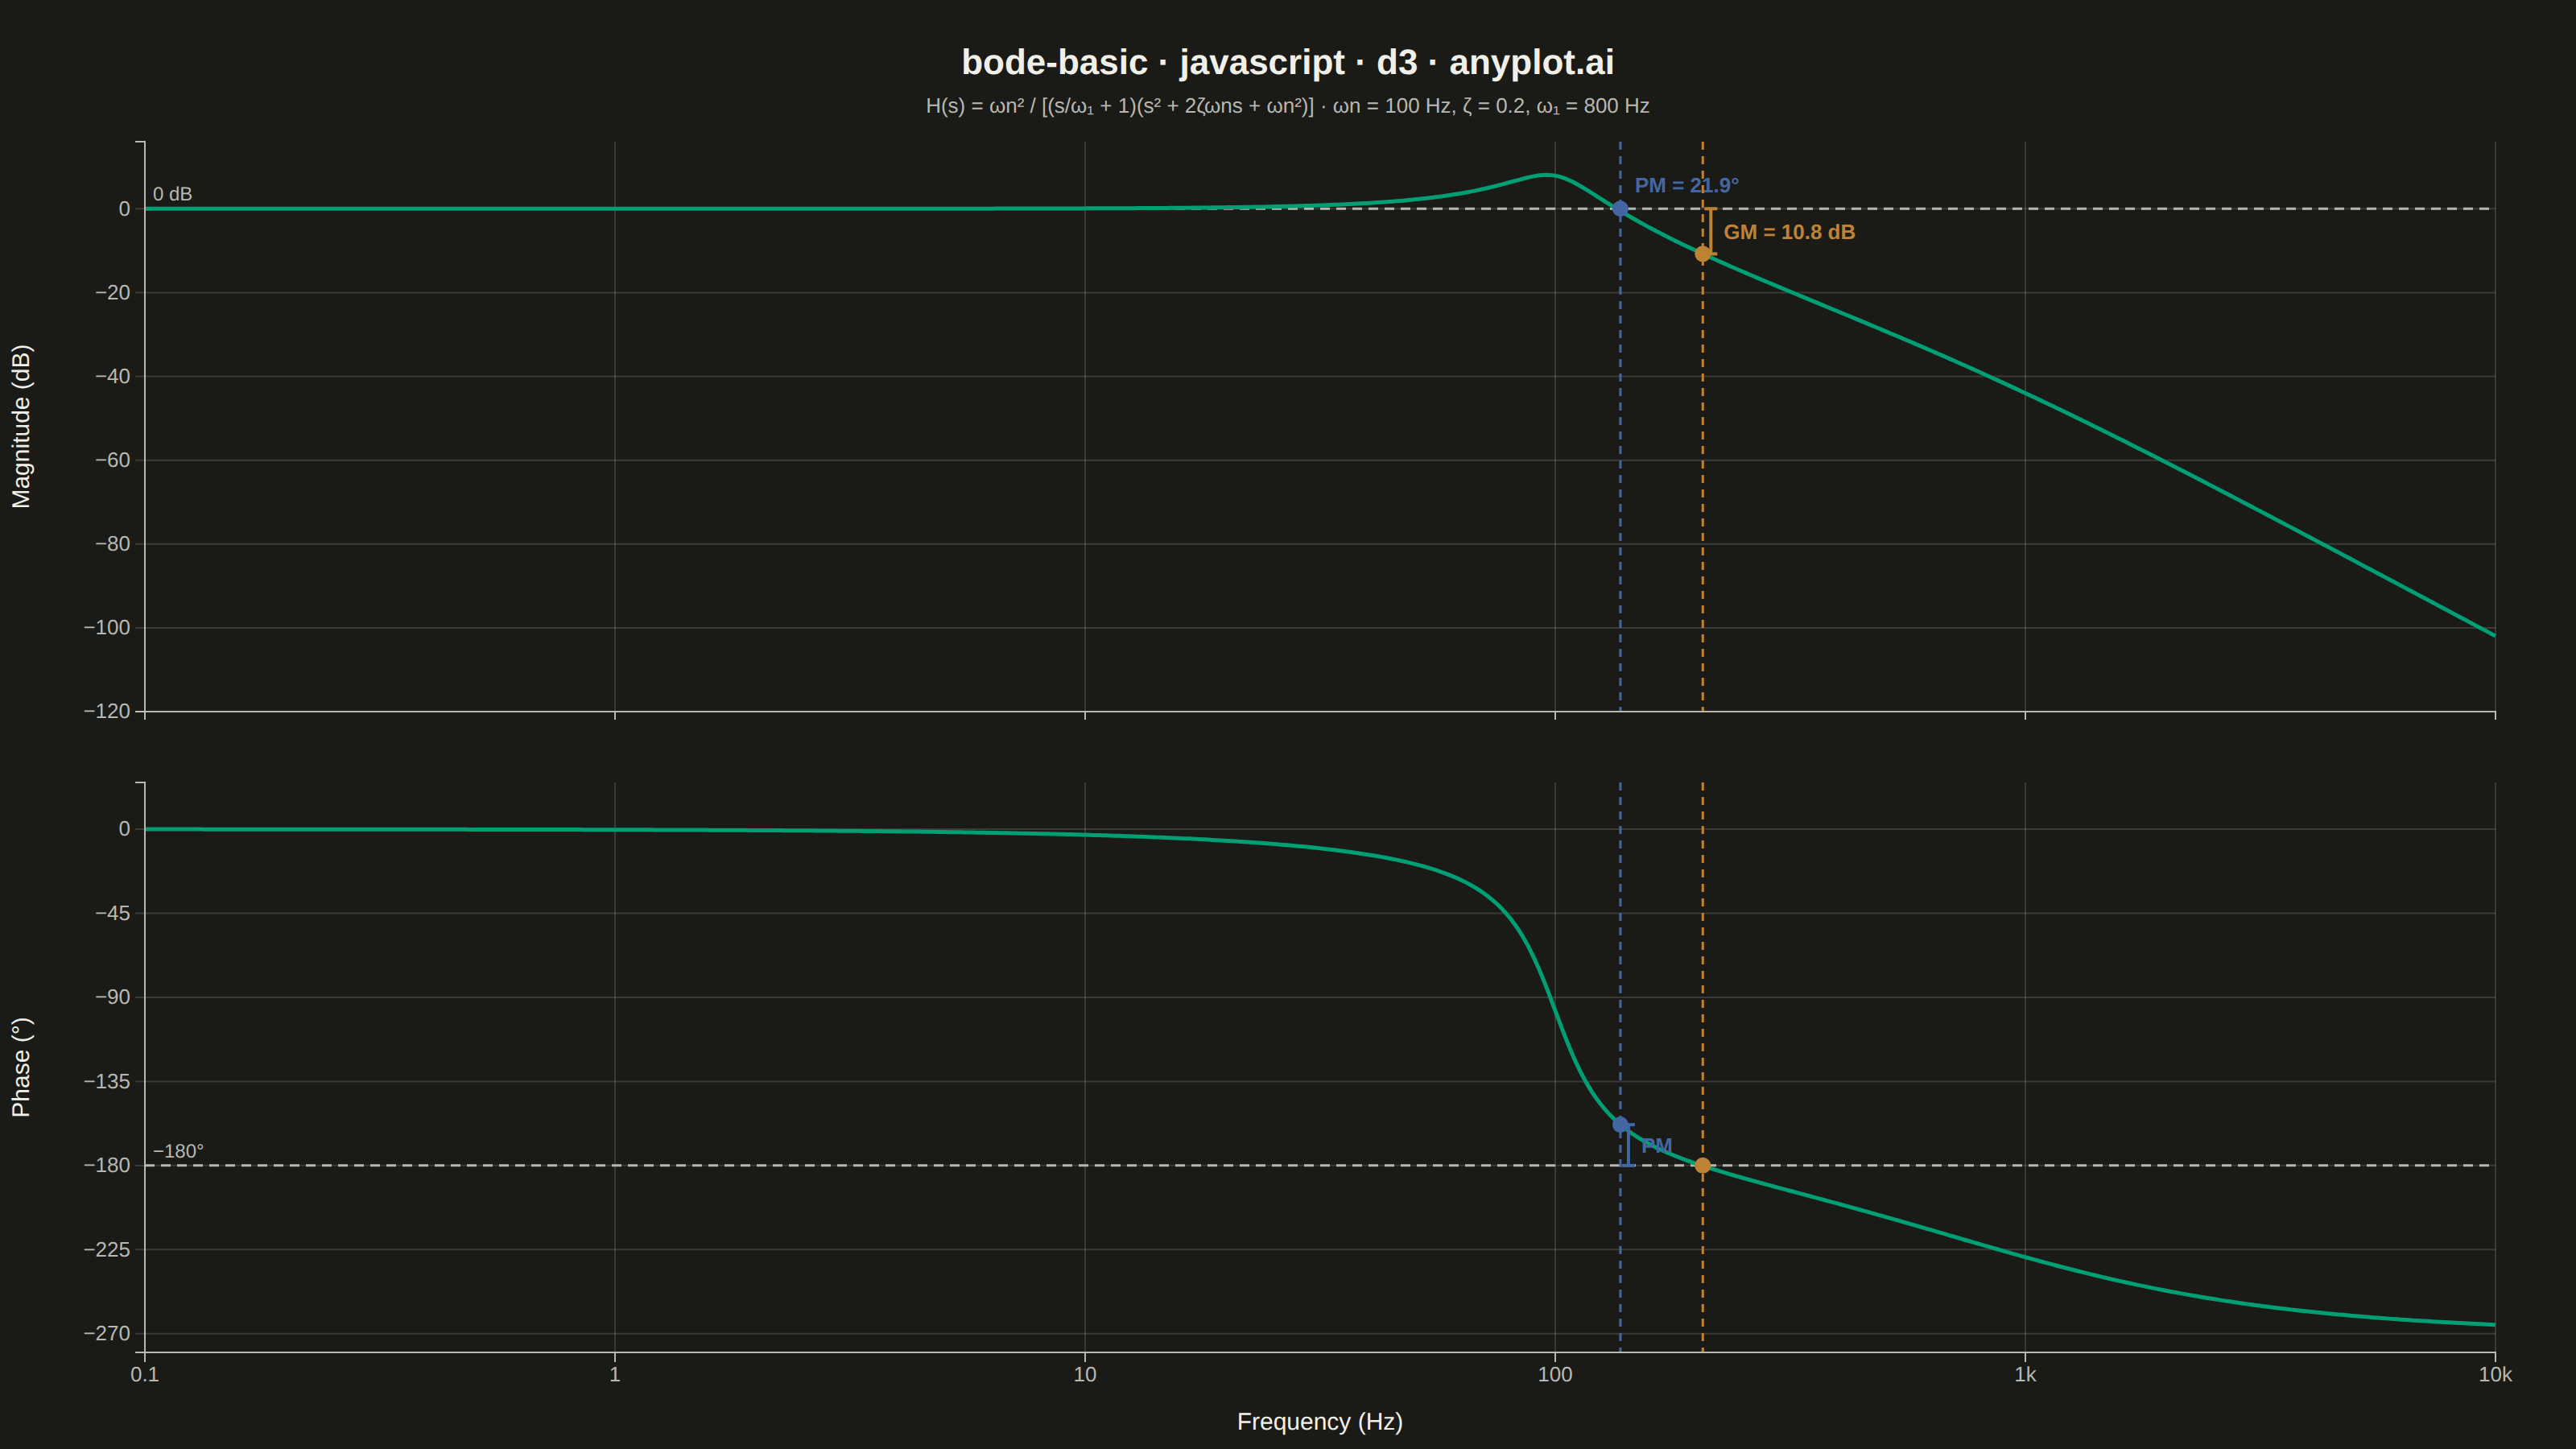
A Bode plot displays a system's frequency response as two vertically aligned panels: magnitude (in decibels) on top and phase (in degrees) on the bottom, both plotted against frequency on a shared logarithmic scale. This visualization is fundamental in control systems engineering and signal processing for analyzing how a system responds to sinusoidal inputs across a range of frequencies, revealing stability characteristics, bandwidth, and resonance behavior.
// anyplot.ai
// bode-basic: Bode Plot for Frequency Response
// Library: d3 7.9.0 | JavaScript 22.22.3
// Quality: 91/100 | Created: 2026-06-17

const t = window.ANYPLOT_TOKENS;
const { width, height } = window.ANYPLOT_SIZE;

// System: H(s) = ωn² / [(s/ω₁ + 1)(s² + 2ζωns + ωn²)]
// Third-order low-pass — natural freq 100 Hz, extra pole at 800 Hz, ζ = 0.2
const fn = 100;
const wn = 2 * Math.PI * fn;
const zeta = 0.2;
const f1 = 800;
const w1 = 2 * Math.PI * f1;

function complexDiv(ar, ai, br, bi) {
  const d = br * br + bi * bi;
  return [(ar * br + ai * bi) / d, (ai * br - ar * bi) / d];
}

// Log-spaced frequencies 0.1–10 000 Hz (600 points)
const N = 600;
const fMin = 0.1;
const fMax = 10000;
const rawData = Array.from({ length: N }, (_, i) => {
  const f = fMin * Math.pow(fMax / fMin, i / (N - 1));
  const w = 2 * Math.PI * f;
  const d1r = 1;
  const d1i = w / w1;
  const d2r = wn * wn - w * w;
  const d2i = 2 * zeta * wn * w;
  const dr = d1r * d2r - d1i * d2i;
  const di = d1r * d2i + d1i * d2r;
  const [Hr, Hi] = complexDiv(wn * wn, 0, dr, di);
  const magnitude = 20 * Math.log10(Math.sqrt(Hr * Hr + Hi * Hi));
  const phase = Math.atan2(Hi, Hr) * 180 / Math.PI;
  return { f, magnitude, phase };
});

// Unwrap phase so it tracks continuously past ±180°
const data = [];
let prevPhase = null;
for (const { f, magnitude, phase: wp } of rawData) {
  let phase = wp;
  if (prevPhase !== null) {
    let dp = phase - prevPhase;
    if (dp > 180) dp -= 360;
    if (dp < -180) dp += 360;
    phase = prevPhase + dp;
  }
  prevPhase = phase;
  data.push({ f, magnitude, phase });
}

// Gain crossover: magnitude descends through 0 dB
let gcIdx = -1;
for (let i = 1; i < data.length; i++) {
  if (data[i - 1].magnitude >= 0 && data[i].magnitude < 0) { gcIdx = i; break; }
}
const fGC = gcIdx > 0 ? data[gcIdx].f : null;
const phaseAtGC = gcIdx > 0 ? data[gcIdx].phase : null;
const phaseMargin = phaseAtGC !== null ? phaseAtGC + 180 : null;

// Phase crossover: phase descends through −180°
let pcIdx = -1;
for (let i = 1; i < data.length; i++) {
  if (data[i - 1].phase > -180 && data[i].phase <= -180) { pcIdx = i; break; }
}
const fPC = pcIdx > 0 ? data[pcIdx].f : null;
const magAtPC = pcIdx > 0 ? data[pcIdx].magnitude : null;
const gainMargin = magAtPC !== null ? -magAtPC : null;

// Layout
const margin = { top: 88, right: 50, bottom: 60, left: 90 };
const panelGap = 44;
const iw = width - margin.left - margin.right;
const panelH = (height - margin.top - margin.bottom - panelGap) / 2;

const svg = d3.select("#container")
  .append("svg")
  .attr("width", width)
  .attr("height", height);

// Title
svg.append("text")
  .attr("x", width / 2)
  .attr("y", 46)
  .attr("text-anchor", "middle")
  .attr("fill", t.ink)
  .style("font-size", "22px")
  .style("font-weight", "600")
  .text("bode-basic · javascript · d3 · anyplot.ai");

// Subtitle — system description
svg.append("text")
  .attr("x", width / 2)
  .attr("y", 70)
  .attr("text-anchor", "middle")
  .attr("fill", t.inkSoft)
  .style("font-size", "13px")
  .text("H(s) = ωn² / [(s/ω₁ + 1)(s² + 2ζωns + ωn²)]  ·  ωn = 100 Hz, ζ = 0.2, ω₁ = 800 Hz");

// Shared log-frequency x-scale
const xScale = d3.scaleLog().domain([fMin, fMax]).range([0, iw]);
const xTickVals = [0.1, 1, 10, 100, 1000, 10000];

// ── Magnitude panel ──────────────────────────────────────────────────────────
const magExtent = d3.extent(data, d => d.magnitude);
const yMagLo = Math.floor(magExtent[0] / 10) * 10 - 10;
const yMagHi = Math.ceil(magExtent[1] / 10) * 10 + 6;
const yMag = d3.scaleLinear().domain([yMagLo, yMagHi]).range([panelH, 0]);

const gMag = svg.append("g")
  .attr("transform", `translate(${margin.left},${margin.top})`);

// Horizontal gridlines
yMag.ticks(6).forEach(v => {
  gMag.append("line")
    .attr("x1", 0).attr("x2", iw)
    .attr("y1", yMag(v)).attr("y2", yMag(v))
    .attr("stroke", t.grid).attr("stroke-width", 1);
});

// Vertical frequency gridlines
xTickVals.forEach(fv => {
  gMag.append("line")
    .attr("x1", xScale(fv)).attr("x2", xScale(fv))
    .attr("y1", 0).attr("y2", panelH)
    .attr("stroke", t.grid).attr("stroke-width", 1);
});

// 0 dB reference line
gMag.append("line")
  .attr("x1", 0).attr("x2", iw)
  .attr("y1", yMag(0)).attr("y2", yMag(0))
  .attr("stroke", t.inkSoft)
  .attr("stroke-width", 1.5)
  .attr("stroke-dasharray", "6,4");

gMag.append("text")
  .attr("x", 5).attr("y", yMag(0) - 5)
  .attr("fill", t.inkSoft).style("font-size", "12px")
  .text("0 dB");

// Magnitude curve
gMag.append("path")
  .datum(data)
  .attr("fill", "none")
  .attr("stroke", t.palette[0])
  .attr("stroke-width", 2.5)
  .attr("d", d3.line().x(d => xScale(d.f)).y(d => yMag(d.magnitude)));

// Gain-crossover vertical (phase margin marker)
if (fGC !== null) {
  const xGC = xScale(fGC);
  gMag.append("line")
    .attr("x1", xGC).attr("x2", xGC)
    .attr("y1", 0).attr("y2", panelH)
    .attr("stroke", t.palette[2])
    .attr("stroke-width", 1.5)
    .attr("stroke-dasharray", "5,4");
  gMag.append("circle")
    .attr("cx", xGC).attr("cy", yMag(0))
    .attr("r", 5).attr("fill", t.palette[2]);
  gMag.append("text")
    .attr("x", xGC + 9).attr("y", yMag(0) - 10)
    .attr("fill", t.palette[2]).style("font-size", "13px").style("font-weight", "600")
    .text(`PM = ${phaseMargin.toFixed(1)}°`);
}

// Phase-crossover vertical (gain margin marker)
if (fPC !== null) {
  const xPC = xScale(fPC);
  gMag.append("line")
    .attr("x1", xPC).attr("x2", xPC)
    .attr("y1", 0).attr("y2", panelH)
    .attr("stroke", t.palette[3])
    .attr("stroke-width", 1.5)
    .attr("stroke-dasharray", "5,4");
  gMag.append("circle")
    .attr("cx", xPC).attr("cy", yMag(magAtPC))
    .attr("r", 5).attr("fill", t.palette[3]);
  // Bracket from magAtPC up to 0 dB
  const yTop = yMag(0);
  const yBot = yMag(magAtPC);
  const bx = xPC + 5;
  gMag.append("line")
    .attr("x1", bx).attr("x2", bx)
    .attr("y1", yTop).attr("y2", yBot)
    .attr("stroke", t.palette[3]).attr("stroke-width", 2);
  for (const yy of [yTop, yBot]) {
    gMag.append("line")
      .attr("x1", bx - 4).attr("x2", bx + 4)
      .attr("y1", yy).attr("y2", yy)
      .attr("stroke", t.palette[3]).attr("stroke-width", 2);
  }
  gMag.append("text")
    .attr("x", bx + 8).attr("y", (yTop + yBot) / 2 + 5)
    .attr("fill", t.palette[3]).style("font-size", "13px").style("font-weight", "600")
    .text(`GM = ${gainMargin.toFixed(1)} dB`);
}

// Magnitude x-axis — tick marks only (labels on phase panel below)
const xMagG = gMag.append("g")
  .attr("transform", `translate(0,${panelH})`)
  .call(d3.axisBottom(xScale).tickValues(xTickVals).tickFormat(() => "").tickSize(5));
xMagG.selectAll("line").attr("stroke", t.inkSoft);
xMagG.select(".domain").attr("stroke", t.inkSoft);

// Magnitude y-axis
const yMagG = gMag.append("g").call(d3.axisLeft(yMag).ticks(6));
yMagG.selectAll("text").attr("fill", t.inkSoft).style("font-size", "13px");
yMagG.selectAll("line").attr("stroke", t.grid);
yMagG.select(".domain").attr("stroke", t.inkSoft);

// Remove top spine of magnitude panel
gMag.append("line")
  .attr("x1", 0).attr("x2", iw)
  .attr("y1", 0).attr("y2", 0)
  .attr("stroke", "none");

// Magnitude y-axis label
gMag.append("text")
  .attr("transform", "rotate(-90)")
  .attr("x", -panelH / 2).attr("y", -72)
  .attr("text-anchor", "middle")
  .attr("fill", t.ink).style("font-size", "15px")
  .text("Magnitude (dB)");

// ── Phase panel ──────────────────────────────────────────────────────────────
const phaseMin = d3.min(data, d => d.phase);
const yPhaseLo = Math.floor(phaseMin / 45) * 45 - 10;
const yPhase = d3.scaleLinear().domain([yPhaseLo, 25]).range([panelH, 0]);

const gPhase = svg.append("g")
  .attr("transform", `translate(${margin.left},${margin.top + panelH + panelGap})`);

// Horizontal gridlines at canonical phase angles
const phaseGridVals = [0, -45, -90, -135, -180, -225, -270].filter(p => p >= yPhaseLo - 5);
phaseGridVals.forEach(v => {
  gPhase.append("line")
    .attr("x1", 0).attr("x2", iw)
    .attr("y1", yPhase(v)).attr("y2", yPhase(v))
    .attr("stroke", t.grid).attr("stroke-width", 1);
});

// Vertical frequency gridlines
xTickVals.forEach(fv => {
  gPhase.append("line")
    .attr("x1", xScale(fv)).attr("x2", xScale(fv))
    .attr("y1", 0).attr("y2", panelH)
    .attr("stroke", t.grid).attr("stroke-width", 1);
});

// −180° reference line
gPhase.append("line")
  .attr("x1", 0).attr("x2", iw)
  .attr("y1", yPhase(-180)).attr("y2", yPhase(-180))
  .attr("stroke", t.inkSoft)
  .attr("stroke-width", 1.5)
  .attr("stroke-dasharray", "6,4");

gPhase.append("text")
  .attr("x", 5).attr("y", yPhase(-180) - 5)
  .attr("fill", t.inkSoft).style("font-size", "12px")
  .text("−180°");

// Phase curve
gPhase.append("path")
  .datum(data)
  .attr("fill", "none")
  .attr("stroke", t.palette[0])
  .attr("stroke-width", 2.5)
  .attr("d", d3.line().x(d => xScale(d.f)).y(d => yPhase(d.phase)));

// Gain-crossover on phase panel — shows phase margin graphically
if (fGC !== null) {
  const xGC = xScale(fGC);
  gPhase.append("line")
    .attr("x1", xGC).attr("x2", xGC)
    .attr("y1", 0).attr("y2", panelH)
    .attr("stroke", t.palette[2])
    .attr("stroke-width", 1.5)
    .attr("stroke-dasharray", "5,4");
  gPhase.append("circle")
    .attr("cx", xGC).attr("cy", yPhase(phaseAtGC))
    .attr("r", 5).attr("fill", t.palette[2]);
  // Bracket from phaseAtGC to −180°
  const y1 = yPhase(phaseAtGC);
  const y2 = yPhase(-180);
  const bx = xGC + 5;
  gPhase.append("line")
    .attr("x1", bx).attr("x2", bx)
    .attr("y1", y1).attr("y2", y2)
    .attr("stroke", t.palette[2]).attr("stroke-width", 2);
  for (const yy of [y1, y2]) {
    gPhase.append("line")
      .attr("x1", bx - 4).attr("x2", bx + 4)
      .attr("y1", yy).attr("y2", yy)
      .attr("stroke", t.palette[2]).attr("stroke-width", 2);
  }
  gPhase.append("text")
    .attr("x", bx + 8).attr("y", (y1 + y2) / 2 + 5)
    .attr("fill", t.palette[2]).style("font-size", "13px").style("font-weight", "600")
    .text("PM");
}

// Phase-crossover on phase panel
if (fPC !== null) {
  const xPC = xScale(fPC);
  gPhase.append("line")
    .attr("x1", xPC).attr("x2", xPC)
    .attr("y1", 0).attr("y2", panelH)
    .attr("stroke", t.palette[3])
    .attr("stroke-width", 1.5)
    .attr("stroke-dasharray", "5,4");
  gPhase.append("circle")
    .attr("cx", xPC).attr("cy", yPhase(-180))
    .attr("r", 5).attr("fill", t.palette[3]);
}

// Phase x-axis with frequency labels
const xPhaseG = gPhase.append("g")
  .attr("transform", `translate(0,${panelH})`)
  .call(
    d3.axisBottom(xScale)
      .tickValues(xTickVals)
      .tickFormat(d => d >= 1000 ? `${d / 1000}k` : `${d}`)
  );
xPhaseG.selectAll("text").attr("fill", t.inkSoft).style("font-size", "13px");
xPhaseG.selectAll("line").attr("stroke", t.inkSoft);
xPhaseG.select(".domain").attr("stroke", t.inkSoft);

// Phase y-axis
const yPhaseG = gPhase.append("g")
  .call(d3.axisLeft(yPhase).tickValues(phaseGridVals));
yPhaseG.selectAll("text").attr("fill", t.inkSoft).style("font-size", "13px");
yPhaseG.selectAll("line").attr("stroke", t.grid);
yPhaseG.select(".domain").attr("stroke", t.inkSoft);

// Phase y-axis label
gPhase.append("text")
  .attr("transform", "rotate(-90)")
  .attr("x", -panelH / 2).attr("y", -72)
  .attr("text-anchor", "middle")
  .attr("fill", t.ink).style("font-size", "15px")
  .text("Phase (°)");

// X-axis label (bottom of phase panel)
gPhase.append("text")
  .attr("x", iw / 2).attr("y", panelH + 48)
  .attr("text-anchor", "middle")
  .attr("fill", t.ink).style("font-size", "15px")
  .text("Frequency (Hz)");
Runnable source as JSON, for any HTTP client: https://api.anyplot.ai/specs/bode-basic/d3/code. Any spec id and library id listed in llms-full.txt fit the same URL shape; every URL below is complete and callable.
{
  "spec_id": "bode-basic",
  "language": "javascript",
  "library": "d3",
  "page": "https://anyplot.ai/bode-basic/javascript/d3",
  "hub": "https://anyplot.ai/bode-basic",
  "code_json": "https://api.anyplot.ai/specs/bode-basic/d3/code",
  "spec_json": "https://api.anyplot.ai/specs/bode-basic",
  "render_light_png": "https://storage.googleapis.com/anyplot-images/plots/bode-basic/javascript/d3/plot-light.png",
  "render_dark_png": "https://storage.googleapis.com/anyplot-images/plots/bode-basic/javascript/d3/plot-dark.png",
  "interactive_light_html": "https://storage.googleapis.com/anyplot-images/plots/bode-basic/javascript/d3/plot-light.html",
  "interactive_dark_html": "https://storage.googleapis.com/anyplot-images/plots/bode-basic/javascript/d3/plot-dark.html",
  "quality_score": 91.0,
  "license": "MIT",
  "guide": "https://anyplot.ai/llms.txt"
}
Part of Bode Plot for Frequency Response on anyplot.ai.