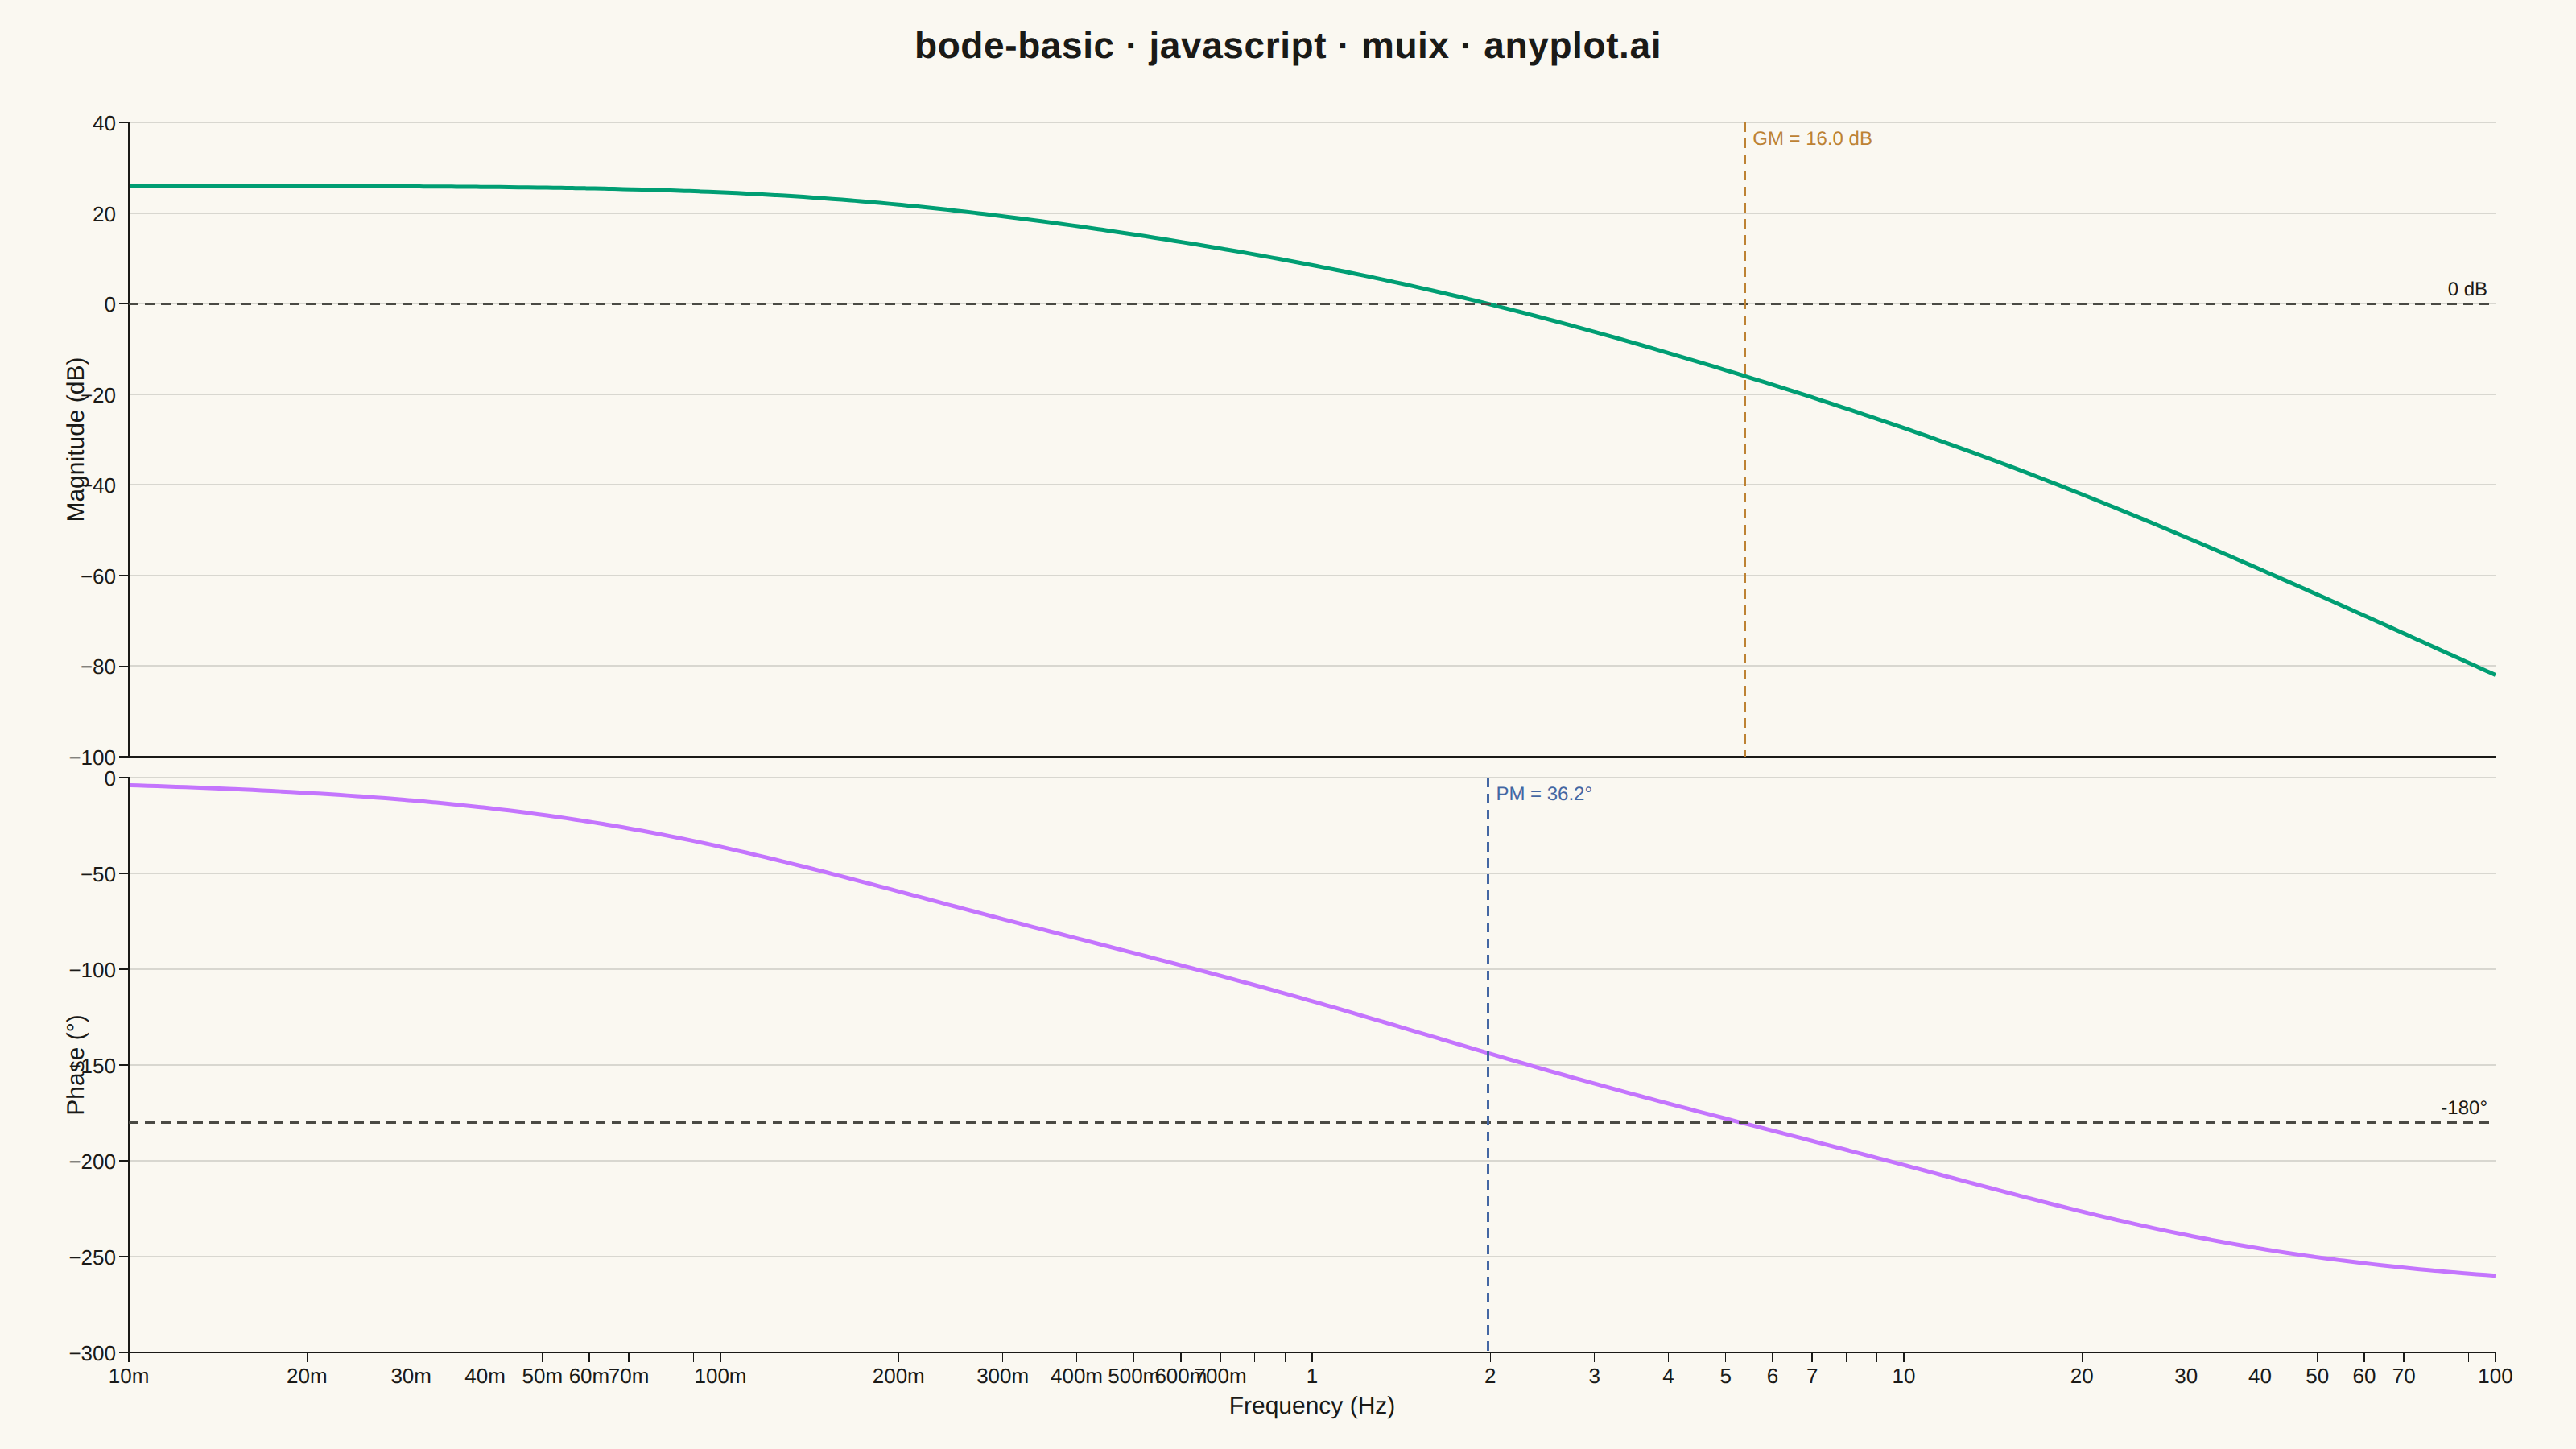
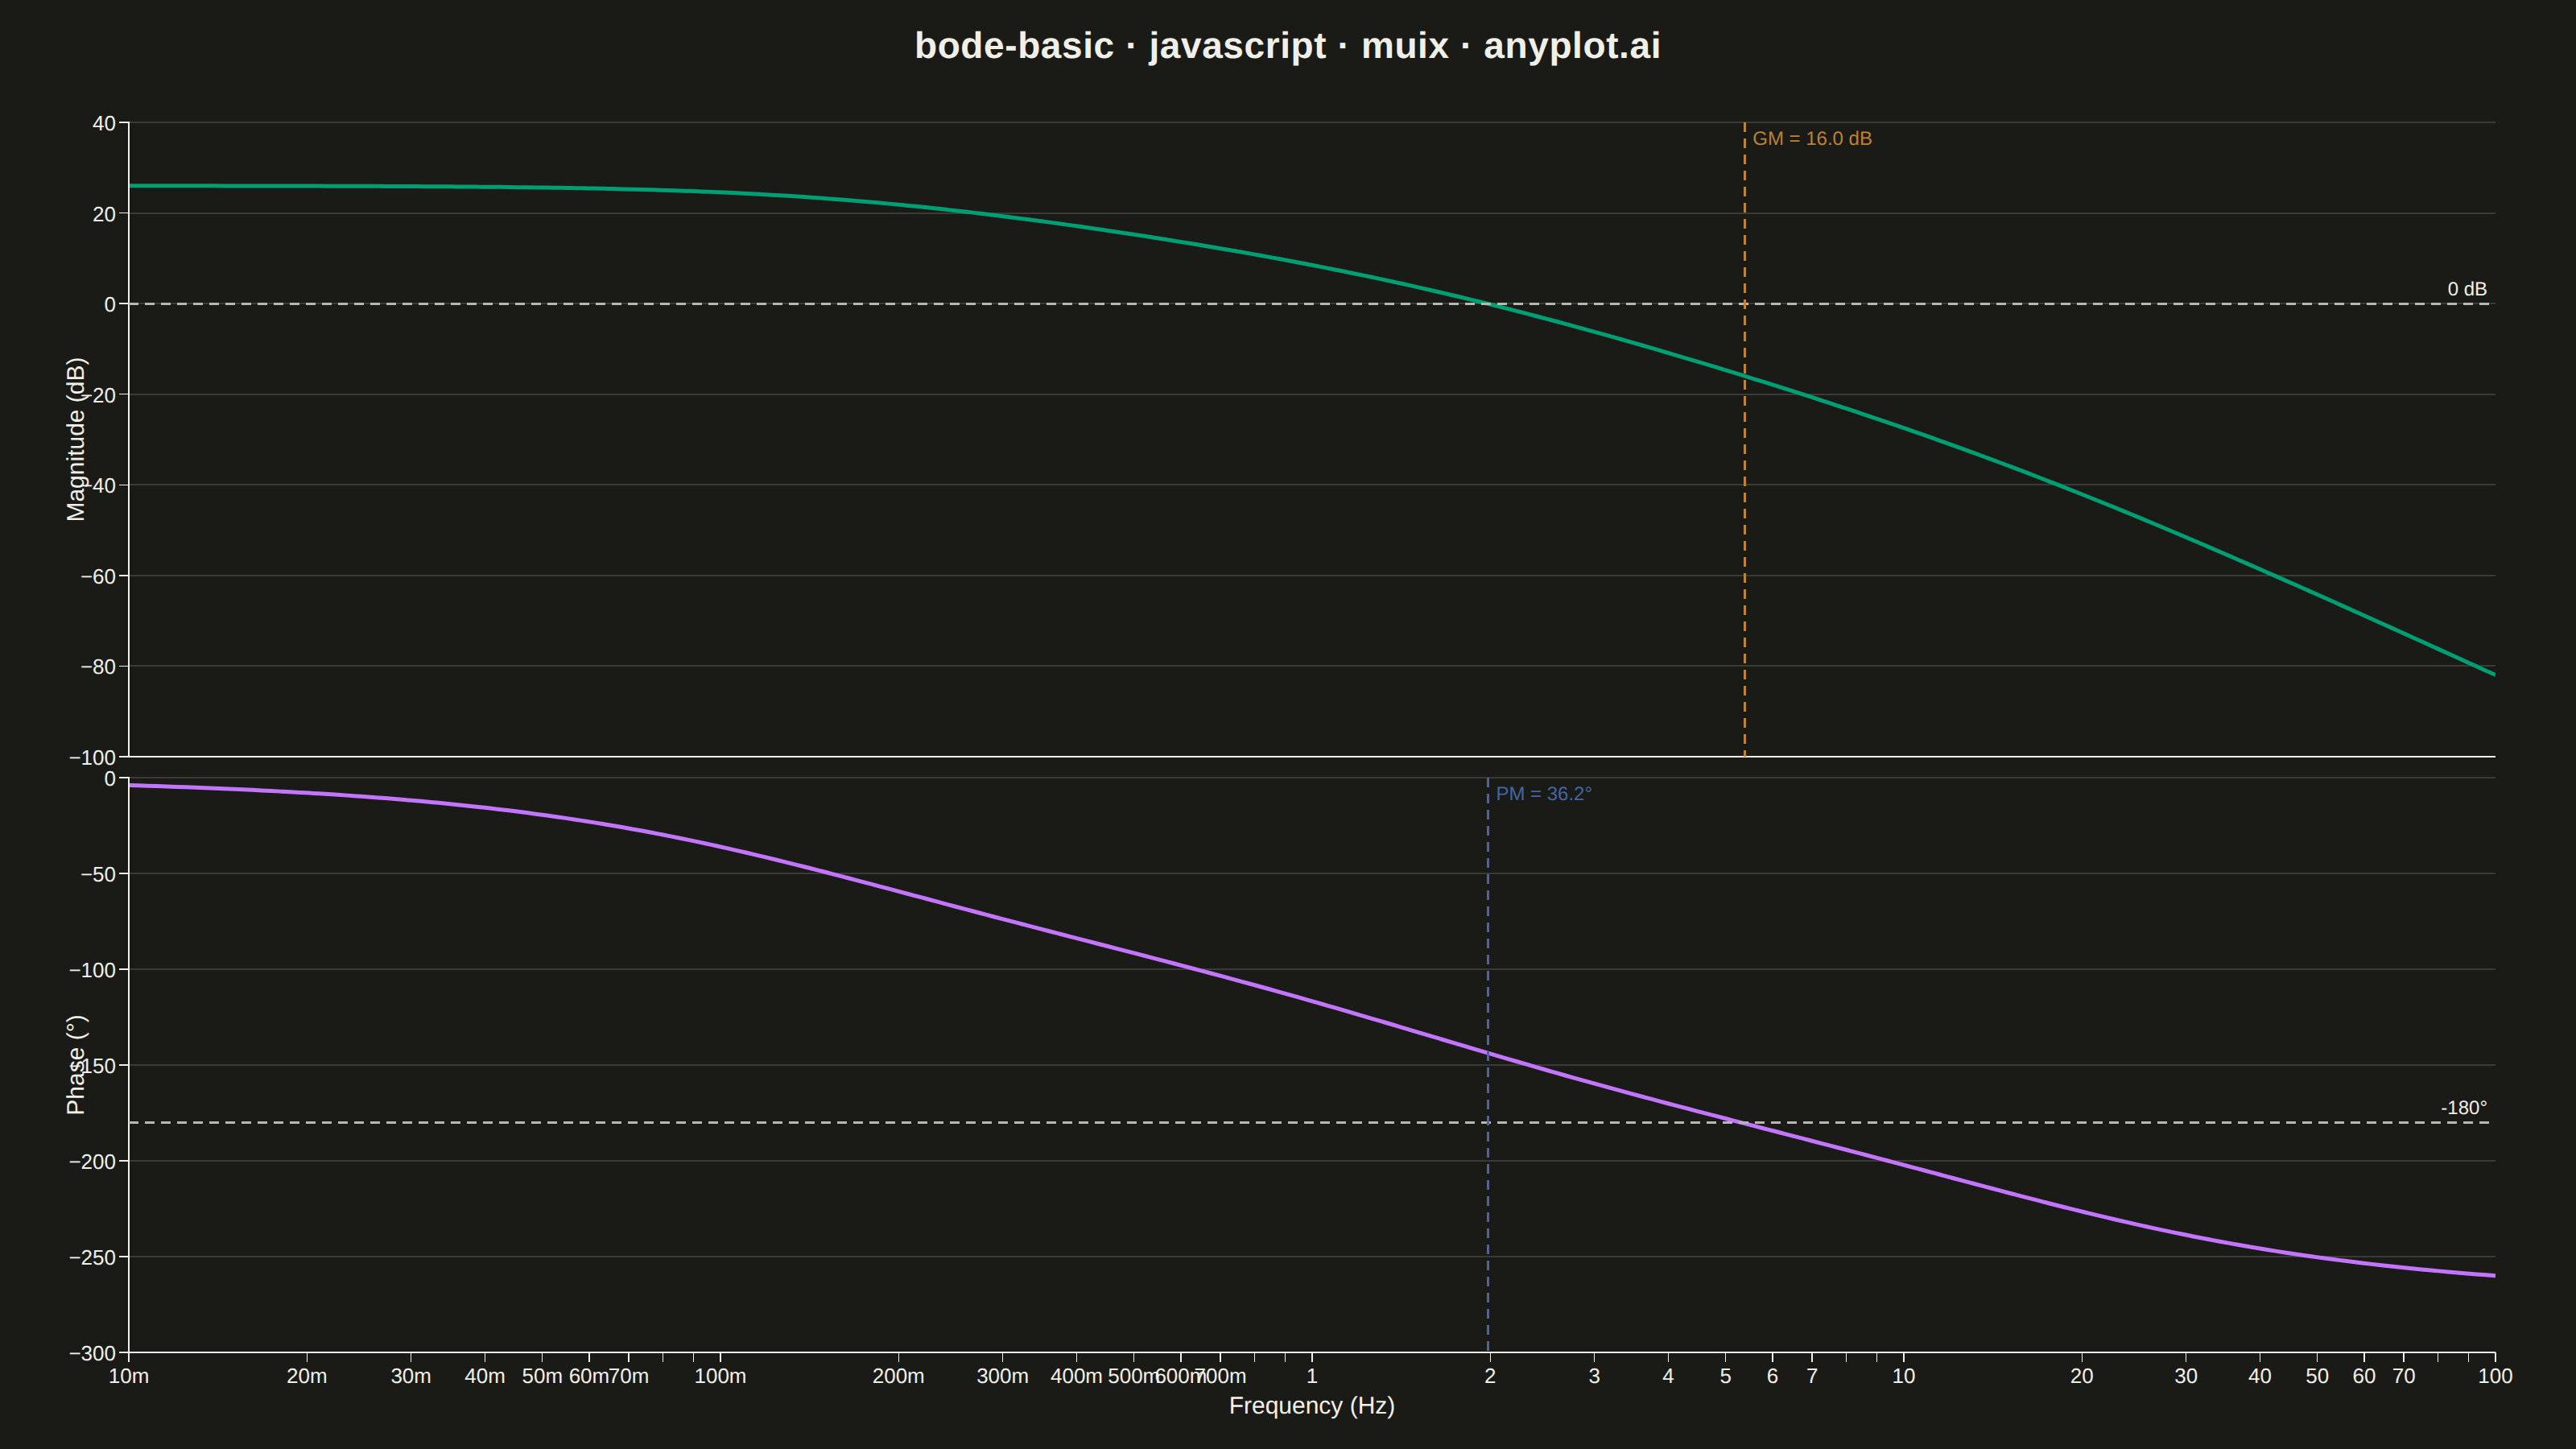
A Bode plot displays a system's frequency response as two vertically aligned panels: magnitude (in decibels) on top and phase (in degrees) on the bottom, both plotted against frequency on a shared logarithmic scale. This visualization is fundamental in control systems engineering and signal processing for analyzing how a system responds to sinusoidal inputs across a range of frequencies, revealing stability characteristics, bandwidth, and resonance behavior.
// anyplot.ai
// bode-basic: Bode Plot for Frequency Response
// Library: muix 7.29.1 | JavaScript 22.22.3
// Quality: 84/100 | Created: 2026-06-17

import { LineChart } from "@mui/x-charts/LineChart";
import { ChartsReferenceLine } from "@mui/x-charts/ChartsReferenceLine";
import Box from "@mui/material/Box";
import Typography from "@mui/material/Typography";

const t = window.ANYPLOT_TOKENS;

// Refined chart appearance: subtle axis lines, grid at 0.15 opacity, thicker data lines
const chartSx = {
  "& .MuiChartsAxis-line": { stroke: t.inkSoft, strokeWidth: 0.7 },
  "& .MuiChartsAxis-tick": { stroke: t.inkSoft, strokeWidth: 0.7 },
  "& .MuiChartsGrid-root line": { stroke: t.grid },
  "& .MuiLineElement-root": { strokeWidth: 2.5 },
};

// --- Data: G(s) = 20 / ((s/1+1)(s/10+1)(s/100+1)) — 3-pole open-loop TF ---
// Pole frequencies: ω₁=1, ω₂=10, ω₃=100 rad/s  (0.16 Hz, 1.59 Hz, 15.9 Hz)
const K = 20;
const w1 = 1;
const w2 = 10;
const w3 = 100;
const N = 250;

const freqs: number[] = [];
const mags: number[] = [];
const phases: number[] = [];

for (let i = 0; i < N; i++) {
  const f = Math.pow(10, -2 + (i / (N - 1)) * 4); // 0.01 to 100 Hz
  const omega = 2 * Math.PI * f;
  const gain =
    K /
    Math.sqrt(
      (1 + (omega / w1) ** 2) *
        (1 + (omega / w2) ** 2) *
        (1 + (omega / w3) ** 2)
    );
  freqs.push(f);
  mags.push(20 * Math.log10(gain));
  phases.push(
    -(
      Math.atan(omega / w1) +
      Math.atan(omega / w2) +
      Math.atan(omega / w3)
    ) *
      (180 / Math.PI)
  );
}

// Gain crossover: magnitude crosses 0 dB going downward
let gcFreq = freqs[0];
let phaseAtGC = phases[0];
for (let i = 1; i < N; i++) {
  if (mags[i - 1] > 0 && mags[i] <= 0) {
    gcFreq = freqs[i];
    phaseAtGC = phases[i];
    break;
  }
}
const phaseMargin = phaseAtGC + 180;

// Phase crossover: phase crosses -180° going downward
let pcFreq = freqs[N - 1];
let magAtPC = mags[N - 1];
let hasCrossover = false;
for (let i = 1; i < N; i++) {
  if (phases[i - 1] > -180 && phases[i] <= -180) {
    pcFreq = freqs[i];
    magAtPC = mags[i];
    hasCrossover = true;
    break;
  }
}
const gainMargin = hasCrossover ? -magAtPC : null;

// --- Chart component --------------------------------------------------------
export default function Chart() {
  const { width, height } = window.ANYPLOT_SIZE;
  const titleH = 56;
  const panelH = Math.floor((height - titleH) / 2);

  return (
    <Box
      sx={{
        width,
        height,
        bgcolor: t.pageBg,
        display: "flex",
        flexDirection: "column",
      }}
    >
      <Box
        sx={{
          height: titleH,
          display: "flex",
          alignItems: "center",
          justifyContent: "center",
        }}
      >
        <Typography sx={{ fontSize: 23, fontWeight: 600, letterSpacing: 0.3, color: t.ink }}>
          bode-basic · javascript · muix · anyplot.ai
        </Typography>
      </Box>

      {/* Magnitude panel */}
      <LineChart
        width={width}
        height={panelH}
        colors={[t.palette[0]]}
        skipAnimation
        xAxis={[
          {
            data: freqs,
            scaleType: "log",
            tickSize: 0,
            tickLabelStyle: { display: "none" },
          },
        ]}
        yAxis={[
          {
            label: "Magnitude (dB)",
            labelStyle: { fontSize: 15 },
            tickLabelStyle: { fontSize: 13 },
          },
        ]}
        series={[{ data: mags, showMark: false, label: "Magnitude" }]}
        slotProps={{ legend: { hidden: true } }}
        grid={{ horizontal: true, vertical: false }}
        margin={{ left: 80, right: 50, top: 20, bottom: 8 }}
        sx={chartSx}
      >
        <ChartsReferenceLine
          y={0}
          lineStyle={{
            stroke: t.inkSoft,
            strokeDasharray: "6 4",
            strokeWidth: 1.5,
          }}
          label="0 dB"
          labelStyle={{ fontSize: 12 }}
          labelAlign="end"
        />
        {hasCrossover && (
          <ChartsReferenceLine
            x={pcFreq}
            lineStyle={{
              stroke: t.palette[3],
              strokeDasharray: "6 4",
              strokeWidth: 1.5,
            }}
            label={`GM = ${gainMargin!.toFixed(1)} dB`}
            labelStyle={{ fontSize: 12, fill: t.palette[3] }}
            labelAlign="start"
          />
        )}
      </LineChart>

      {/* Phase panel */}
      <LineChart
        width={width}
        height={panelH}
        colors={[t.palette[1]]}
        skipAnimation
        xAxis={[
          {
            data: freqs,
            scaleType: "log",
            label: "Frequency (Hz)",
            labelStyle: { fontSize: 15 },
            tickLabelStyle: { fontSize: 13 },
          },
        ]}
        yAxis={[
          {
            label: "Phase (°)",
            labelStyle: { fontSize: 15 },
            tickLabelStyle: { fontSize: 13 },
          },
        ]}
        series={[{ data: phases, showMark: false, label: "Phase" }]}
        slotProps={{ legend: { hidden: true } }}
        grid={{ horizontal: true, vertical: false }}
        margin={{ left: 80, right: 50, top: 5, bottom: 60 }}
        sx={chartSx}
      >
        <ChartsReferenceLine
          y={-180}
          lineStyle={{
            stroke: t.inkSoft,
            strokeDasharray: "6 4",
            strokeWidth: 1.5,
          }}
          label="-180°"
          labelStyle={{ fontSize: 12 }}
          labelAlign="end"
        />
        <ChartsReferenceLine
          x={gcFreq}
          lineStyle={{
            stroke: t.palette[2],
            strokeDasharray: "6 4",
            strokeWidth: 1.5,
          }}
          label={`PM = ${phaseMargin.toFixed(1)}°`}
          labelStyle={{ fontSize: 12, fill: t.palette[2] }}
          labelAlign="start"
        />
      </LineChart>
    </Box>
  );
}
Runnable source as JSON, for any HTTP client: https://api.anyplot.ai/specs/bode-basic/muix/code. Any spec id and library id listed in llms-full.txt fit the same URL shape; every URL below is complete and callable.
{
  "spec_id": "bode-basic",
  "language": "javascript",
  "library": "muix",
  "page": "https://anyplot.ai/bode-basic/javascript/muix",
  "hub": "https://anyplot.ai/bode-basic",
  "code_json": "https://api.anyplot.ai/specs/bode-basic/muix/code",
  "spec_json": "https://api.anyplot.ai/specs/bode-basic",
  "render_light_png": "https://storage.googleapis.com/anyplot-images/plots/bode-basic/javascript/muix/plot-light.png",
  "render_dark_png": "https://storage.googleapis.com/anyplot-images/plots/bode-basic/javascript/muix/plot-dark.png",
  "interactive_light_html": "https://storage.googleapis.com/anyplot-images/plots/bode-basic/javascript/muix/plot-light.html",
  "interactive_dark_html": "https://storage.googleapis.com/anyplot-images/plots/bode-basic/javascript/muix/plot-dark.html",
  "quality_score": 84.0,
  "license": "MIT",
  "guide": "https://anyplot.ai/llms.txt"
}
Part of Bode Plot for Frequency Response on anyplot.ai.