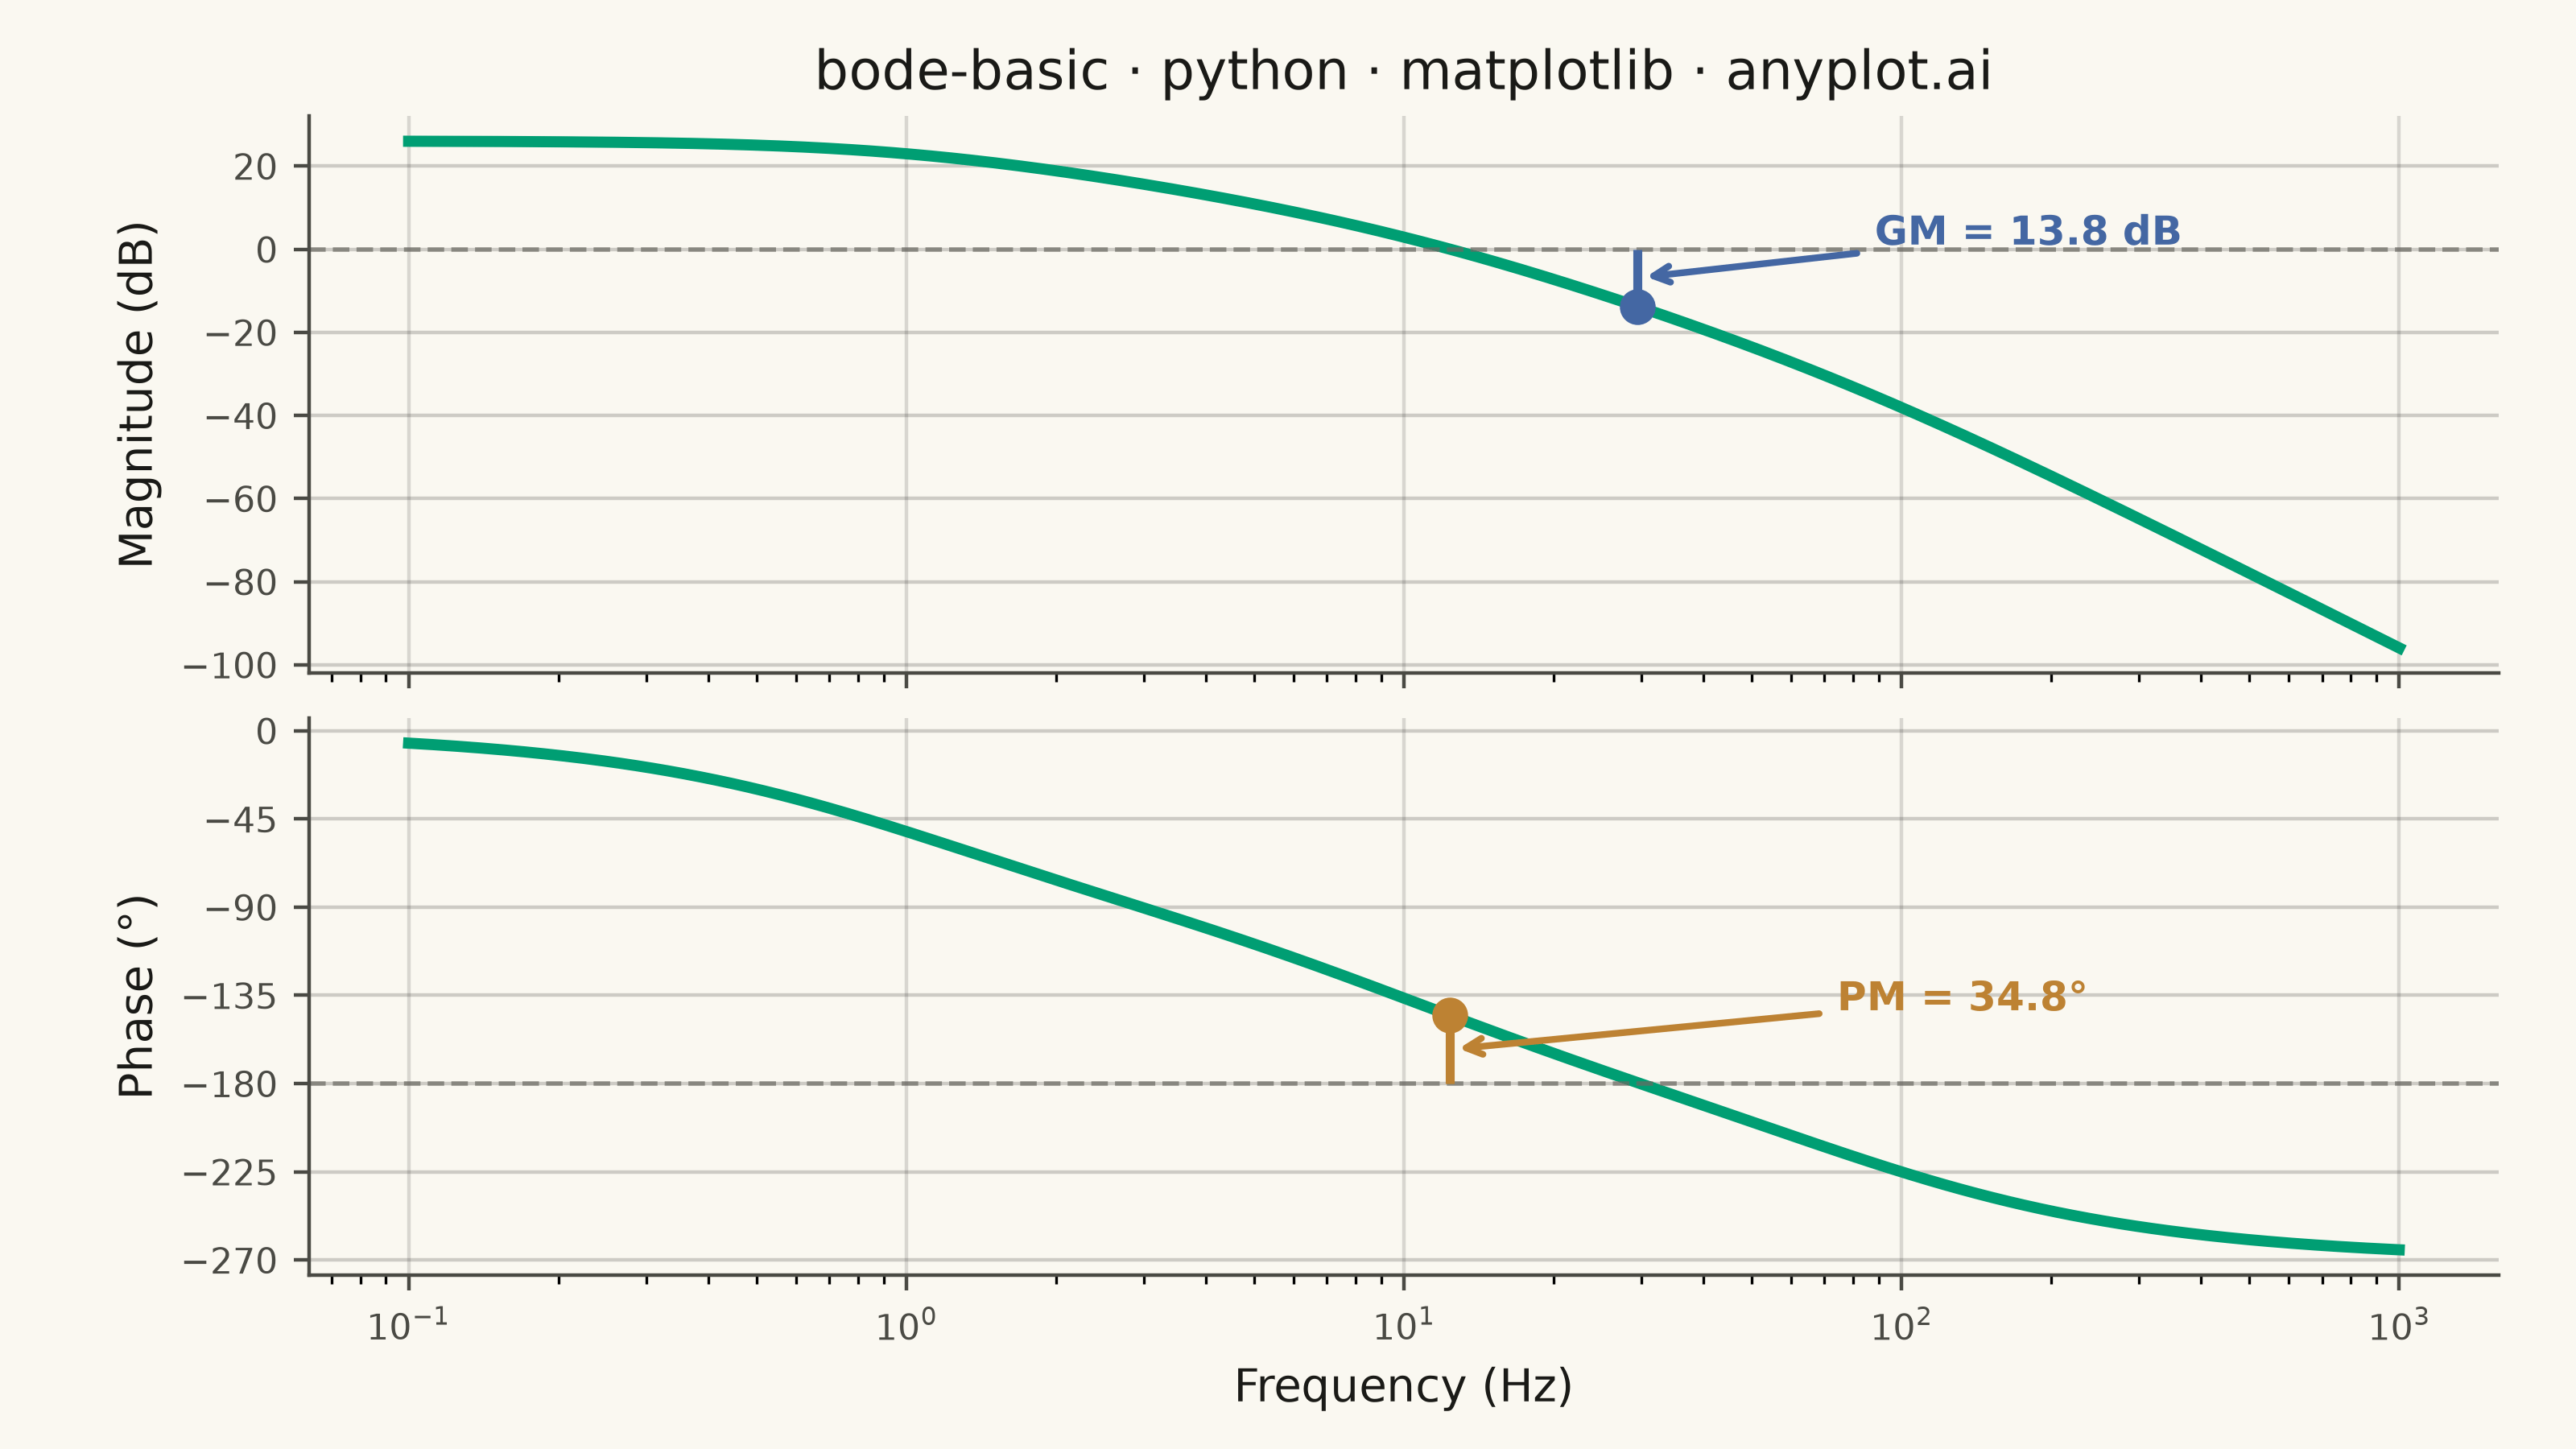
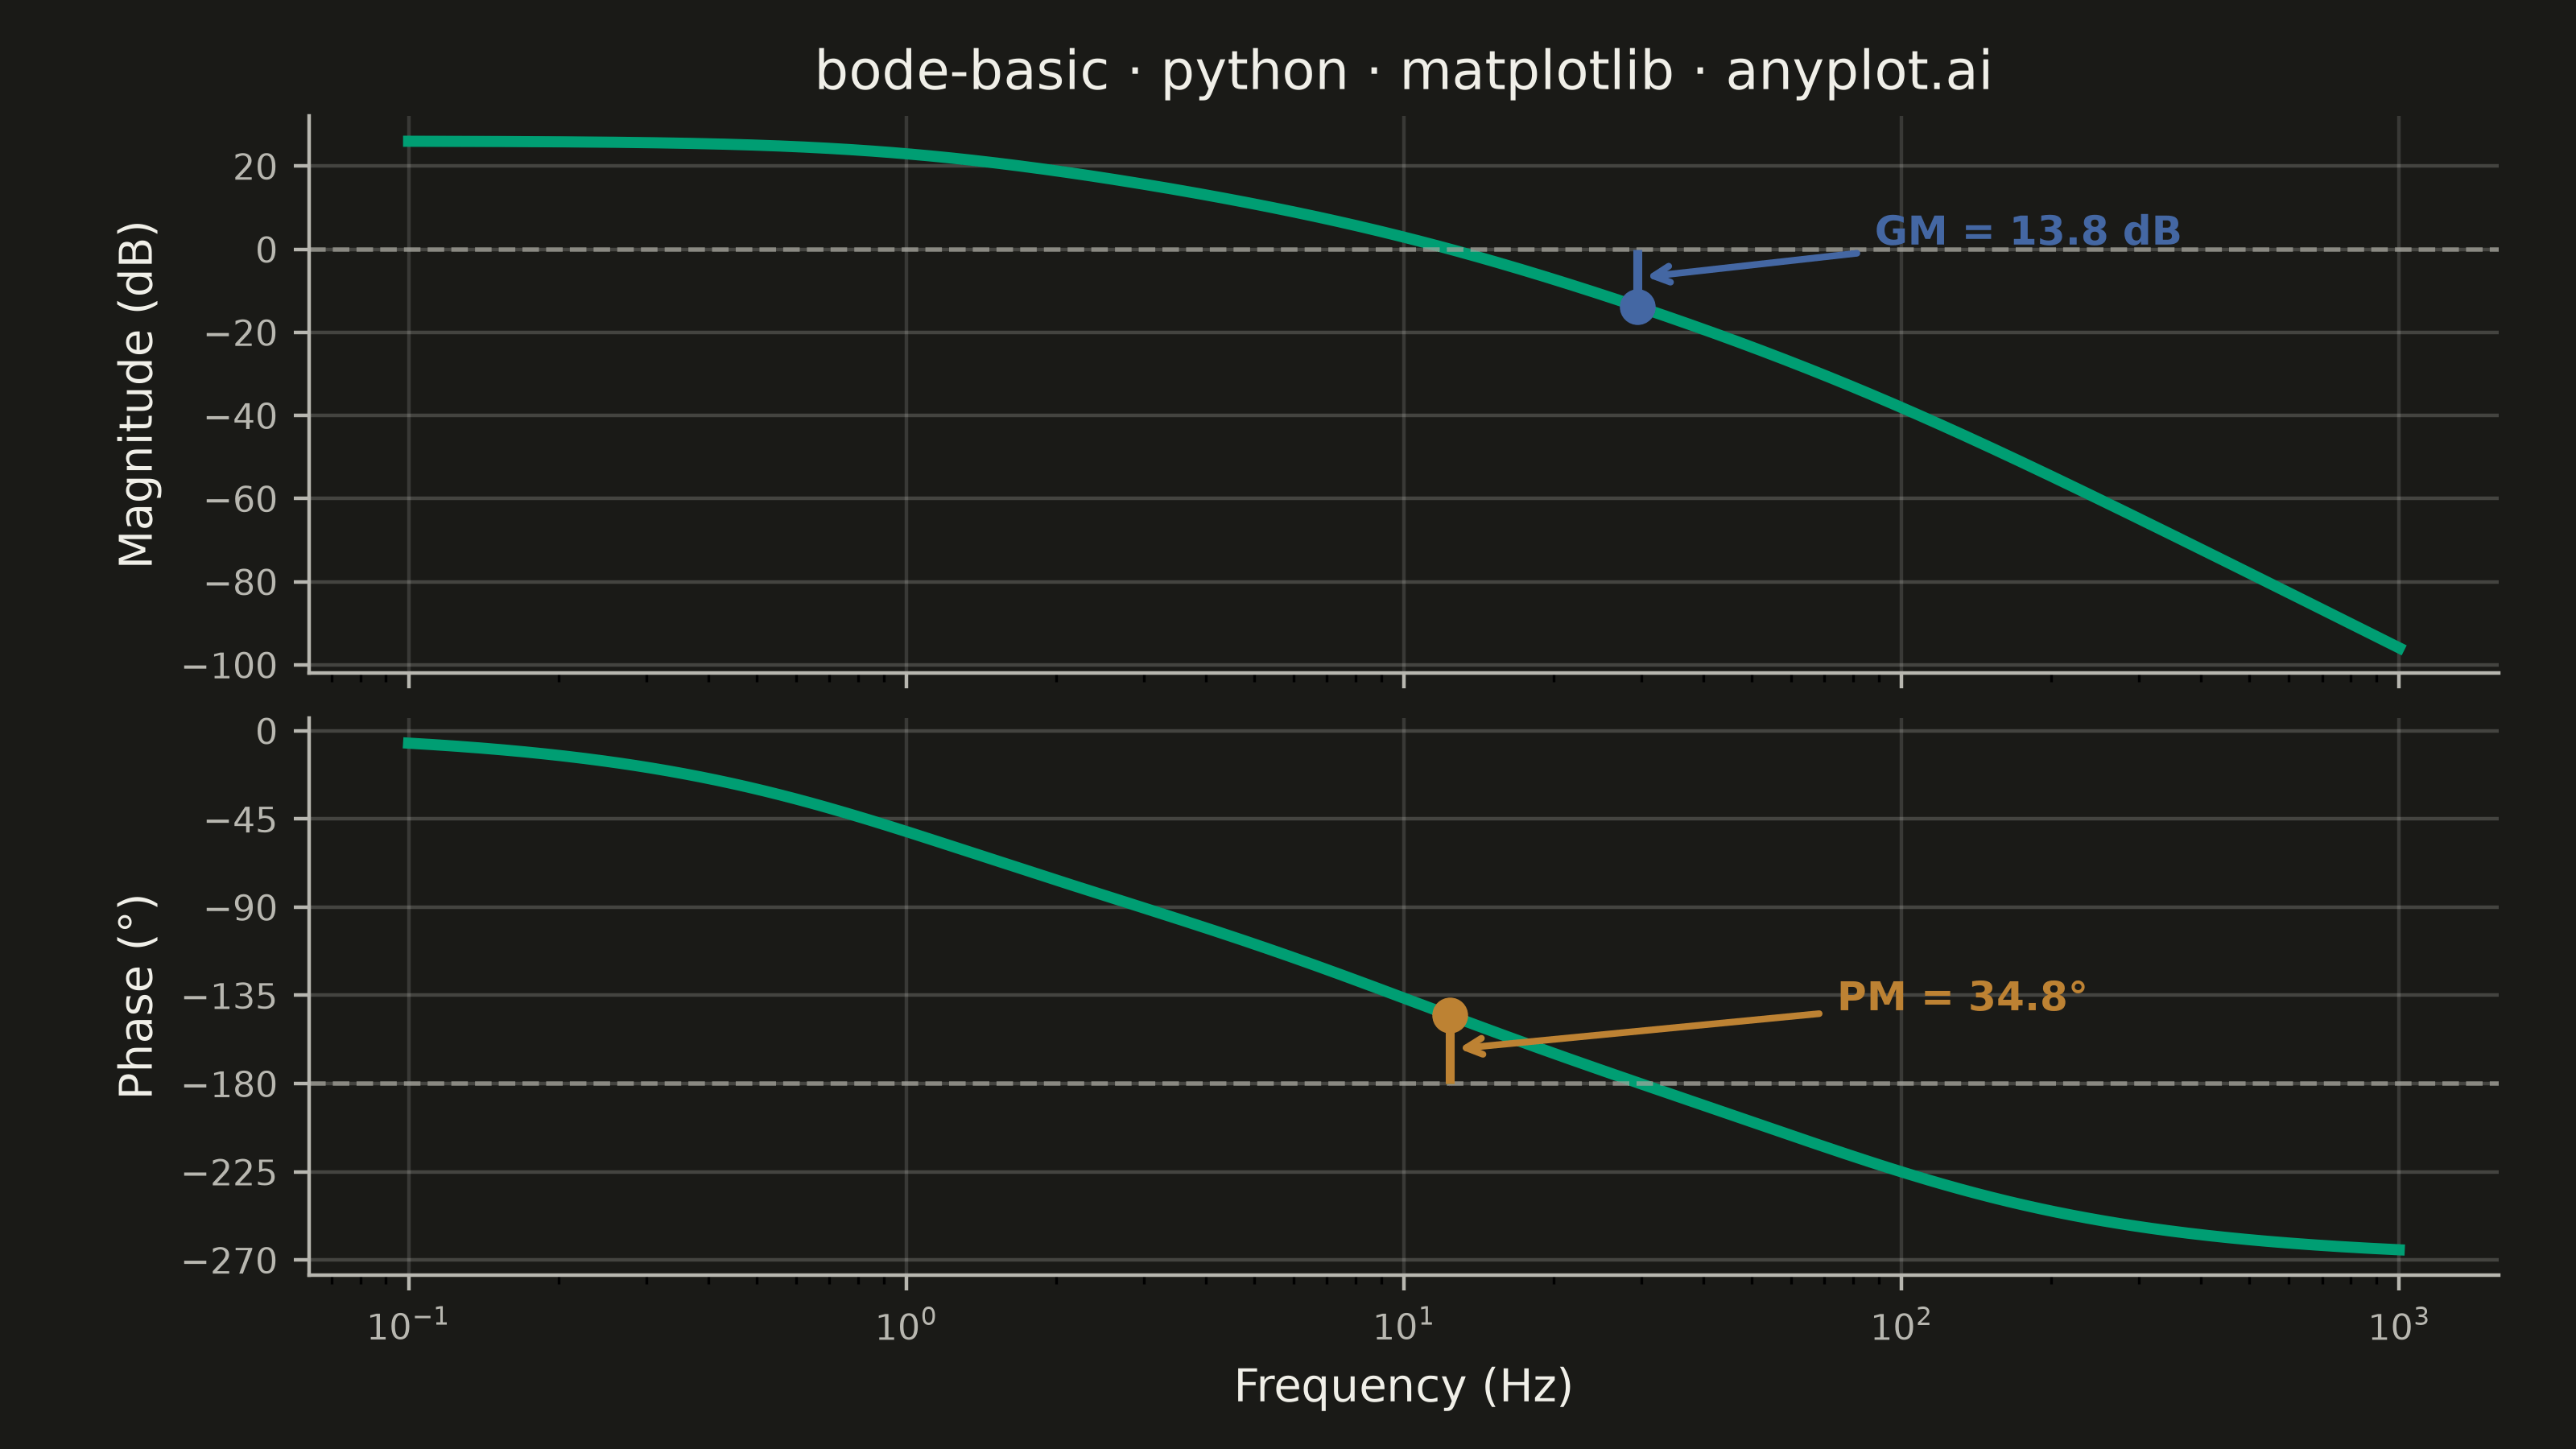
A Bode plot displays a system's frequency response as two vertically aligned panels: magnitude (in decibels) on top and phase (in degrees) on the bottom, both plotted against frequency on a shared logarithmic scale. This visualization is fundamental in control systems engineering and signal processing for analyzing how a system responds to sinusoidal inputs across a range of frequencies, revealing stability characteristics, bandwidth, and resonance behavior.
""" anyplot.ai
bode-basic: Bode Plot for Frequency Response
Library: matplotlib 3.11.0 | Python 3.13.14
Quality: 92/100 | Updated: 2026-06-17
"""

import os

import matplotlib.pyplot as plt
import numpy as np


# Theme tokens
THEME = os.getenv("ANYPLOT_THEME", "light")
PAGE_BG = "#FAF8F1" if THEME == "light" else "#1A1A17"
ELEVATED_BG = "#FFFDF6" if THEME == "light" else "#242420"
INK = "#1A1A17" if THEME == "light" else "#F0EFE8"
INK_SOFT = "#4A4A44" if THEME == "light" else "#B8B7B0"
INK_MUTED = "#6B6A63" if THEME == "light" else "#A8A79F"

# Imprint palette — 8 hues, hybrid-v3 sort
IMPRINT_PALETTE = ["#009E73", "#C475FD", "#4467A3", "#BD8233", "#AE3030", "#2ABCCD", "#954477", "#99B314"]
BRAND = IMPRINT_PALETTE[0]  # main frequency response line — brand green
COLOR_GM = IMPRINT_PALETTE[2]  # gain margin annotation — blue
COLOR_PM = IMPRINT_PALETTE[3]  # phase margin annotation — ochre

# Data — third-order open-loop transfer function:
# H(s) = K / ((s/w1 + 1)(s/w2 + 1)(s/w3 + 1))
# Three poles at 1, 10, and 80 Hz with gain K=20
K = 20
poles_hz = np.array([1.0, 10.0, 80.0])
poles_rad = 2 * np.pi * poles_hz

frequency_hz = np.logspace(-1, 3, 500)
omega = 2 * np.pi * frequency_hz
jw = 1j * omega

H = K / np.prod([(jw / p + 1) for p in poles_rad], axis=0)
magnitude_db = 20 * np.log10(np.abs(H))
phase_deg = np.degrees(np.unwrap(np.angle(H)))

# Gain crossover (0 dB crossing)
sign_changes_mag = np.diff(np.sign(magnitude_db))
gain_crossover_idx = np.where(sign_changes_mag != 0)[0]
if len(gain_crossover_idx) > 0:
    gc_idx = gain_crossover_idx[0]
    gain_crossover_freq = frequency_hz[gc_idx]
    phase_at_gc = phase_deg[gc_idx]
    phase_margin = 180 + phase_at_gc
else:
    gain_crossover_freq = None

# Phase crossover (-180 deg crossing)
sign_changes_phase = np.diff(np.sign(phase_deg + 180))
phase_crossover_idx = np.where(sign_changes_phase != 0)[0]
if len(phase_crossover_idx) > 0:
    pc_idx = phase_crossover_idx[0]
    phase_crossover_freq = frequency_hz[pc_idx]
    gain_at_pc = magnitude_db[pc_idx]
    gain_margin = -gain_at_pc
else:
    phase_crossover_freq = None

# Plot
title = "bode-basic · python · matplotlib · anyplot.ai"
title_n = len(title)
title_fontsize = max(8, round(12 * 67 / title_n)) if title_n > 67 else 12

fig, (ax_mag, ax_phase) = plt.subplots(
    2,
    1,
    figsize=(8, 4.5),
    dpi=400,
    sharex=True,
    facecolor=PAGE_BG,
    gridspec_kw={"height_ratios": [1, 1], "hspace": 0.08},
)
ax_mag.set_facecolor(PAGE_BG)
ax_phase.set_facecolor(PAGE_BG)

# Magnitude plot
ax_mag.semilogx(frequency_hz, magnitude_db, color=BRAND, linewidth=2.5)
ax_mag.axhline(y=0, color=INK_MUTED, linewidth=1, linestyle="--", alpha=0.7)

if phase_crossover_freq is not None:
    ax_mag.vlines(phase_crossover_freq, gain_at_pc, 0, colors=COLOR_GM, linewidth=2)
    ax_mag.plot(phase_crossover_freq, gain_at_pc, "o", color=COLOR_GM, markersize=7, zorder=5)
    ax_mag.annotate(
        f"GM = {gain_margin:.1f} dB",
        xy=(phase_crossover_freq, (gain_at_pc + 0) / 2),
        xytext=(phase_crossover_freq * 3, (gain_at_pc + 0) / 2 + 8),
        fontsize=9,
        color=COLOR_GM,
        fontweight="bold",
        arrowprops={"arrowstyle": "->", "color": COLOR_GM, "lw": 1.5},
    )

# Phase plot
ax_phase.semilogx(frequency_hz, phase_deg, color=BRAND, linewidth=2.5)
ax_phase.axhline(y=-180, color=INK_MUTED, linewidth=1, linestyle="--", alpha=0.7)

if gain_crossover_freq is not None:
    ax_phase.vlines(gain_crossover_freq, -180, phase_at_gc, colors=COLOR_PM, linewidth=2)
    ax_phase.plot(gain_crossover_freq, phase_at_gc, "o", color=COLOR_PM, markersize=7, zorder=5)
    ax_phase.annotate(
        f"PM = {phase_margin:.1f}°",
        xy=(gain_crossover_freq, (-180 + phase_at_gc) / 2),
        xytext=(gain_crossover_freq * 6, (-180 + phase_at_gc) / 2 + 20),
        fontsize=9,
        color=COLOR_PM,
        fontweight="bold",
        arrowprops={"arrowstyle": "->", "color": COLOR_PM, "lw": 1.5},
    )

# Style — magnitude panel
ax_mag.set_ylabel("Magnitude (dB)", fontsize=10, color=INK)
ax_mag.set_title(title, fontsize=title_fontsize, fontweight="medium", color=INK)
ax_mag.tick_params(axis="both", labelsize=8, colors=INK_SOFT, labelcolor=INK_SOFT)
ax_mag.spines["top"].set_visible(False)
ax_mag.spines["right"].set_visible(False)
for s in ("left", "bottom"):
    ax_mag.spines[s].set_color(INK_SOFT)
ax_mag.yaxis.grid(True, alpha=0.2, linewidth=0.8, color=INK)
ax_mag.xaxis.grid(True, alpha=0.15, linewidth=0.8, color=INK)

# Style — phase panel
ax_phase.set_xlabel("Frequency (Hz)", fontsize=10, color=INK)
ax_phase.set_ylabel("Phase (°)", fontsize=10, color=INK)
ax_phase.tick_params(axis="both", labelsize=8, colors=INK_SOFT, labelcolor=INK_SOFT)
ax_phase.spines["top"].set_visible(False)
ax_phase.spines["right"].set_visible(False)
for s in ("left", "bottom"):
    ax_phase.spines[s].set_color(INK_SOFT)
ax_phase.yaxis.grid(True, alpha=0.2, linewidth=0.8, color=INK)
ax_phase.xaxis.grid(True, alpha=0.15, linewidth=0.8, color=INK)
ax_phase.set_yticks([0, -45, -90, -135, -180, -225, -270])

# Save
fig.subplots_adjust(left=0.12, right=0.97, top=0.92, bottom=0.12)
plt.savefig(f"plot-{THEME}.png", dpi=400, facecolor=PAGE_BG)
Runnable source as JSON, for any HTTP client: https://api.anyplot.ai/specs/bode-basic/matplotlib/code. Any spec id and library id listed in llms-full.txt fit the same URL shape; every URL below is complete and callable.
{
  "spec_id": "bode-basic",
  "language": "python",
  "library": "matplotlib",
  "page": "https://anyplot.ai/bode-basic/python/matplotlib",
  "hub": "https://anyplot.ai/bode-basic",
  "code_json": "https://api.anyplot.ai/specs/bode-basic/matplotlib/code",
  "spec_json": "https://api.anyplot.ai/specs/bode-basic",
  "render_light_png": "https://storage.googleapis.com/anyplot-images/plots/bode-basic/python/matplotlib/plot-light.png",
  "render_dark_png": "https://storage.googleapis.com/anyplot-images/plots/bode-basic/python/matplotlib/plot-dark.png",
  "quality_score": 92.0,
  "license": "MIT",
  "guide": "https://anyplot.ai/llms.txt"
}
Part of Bode Plot for Frequency Response on anyplot.ai.