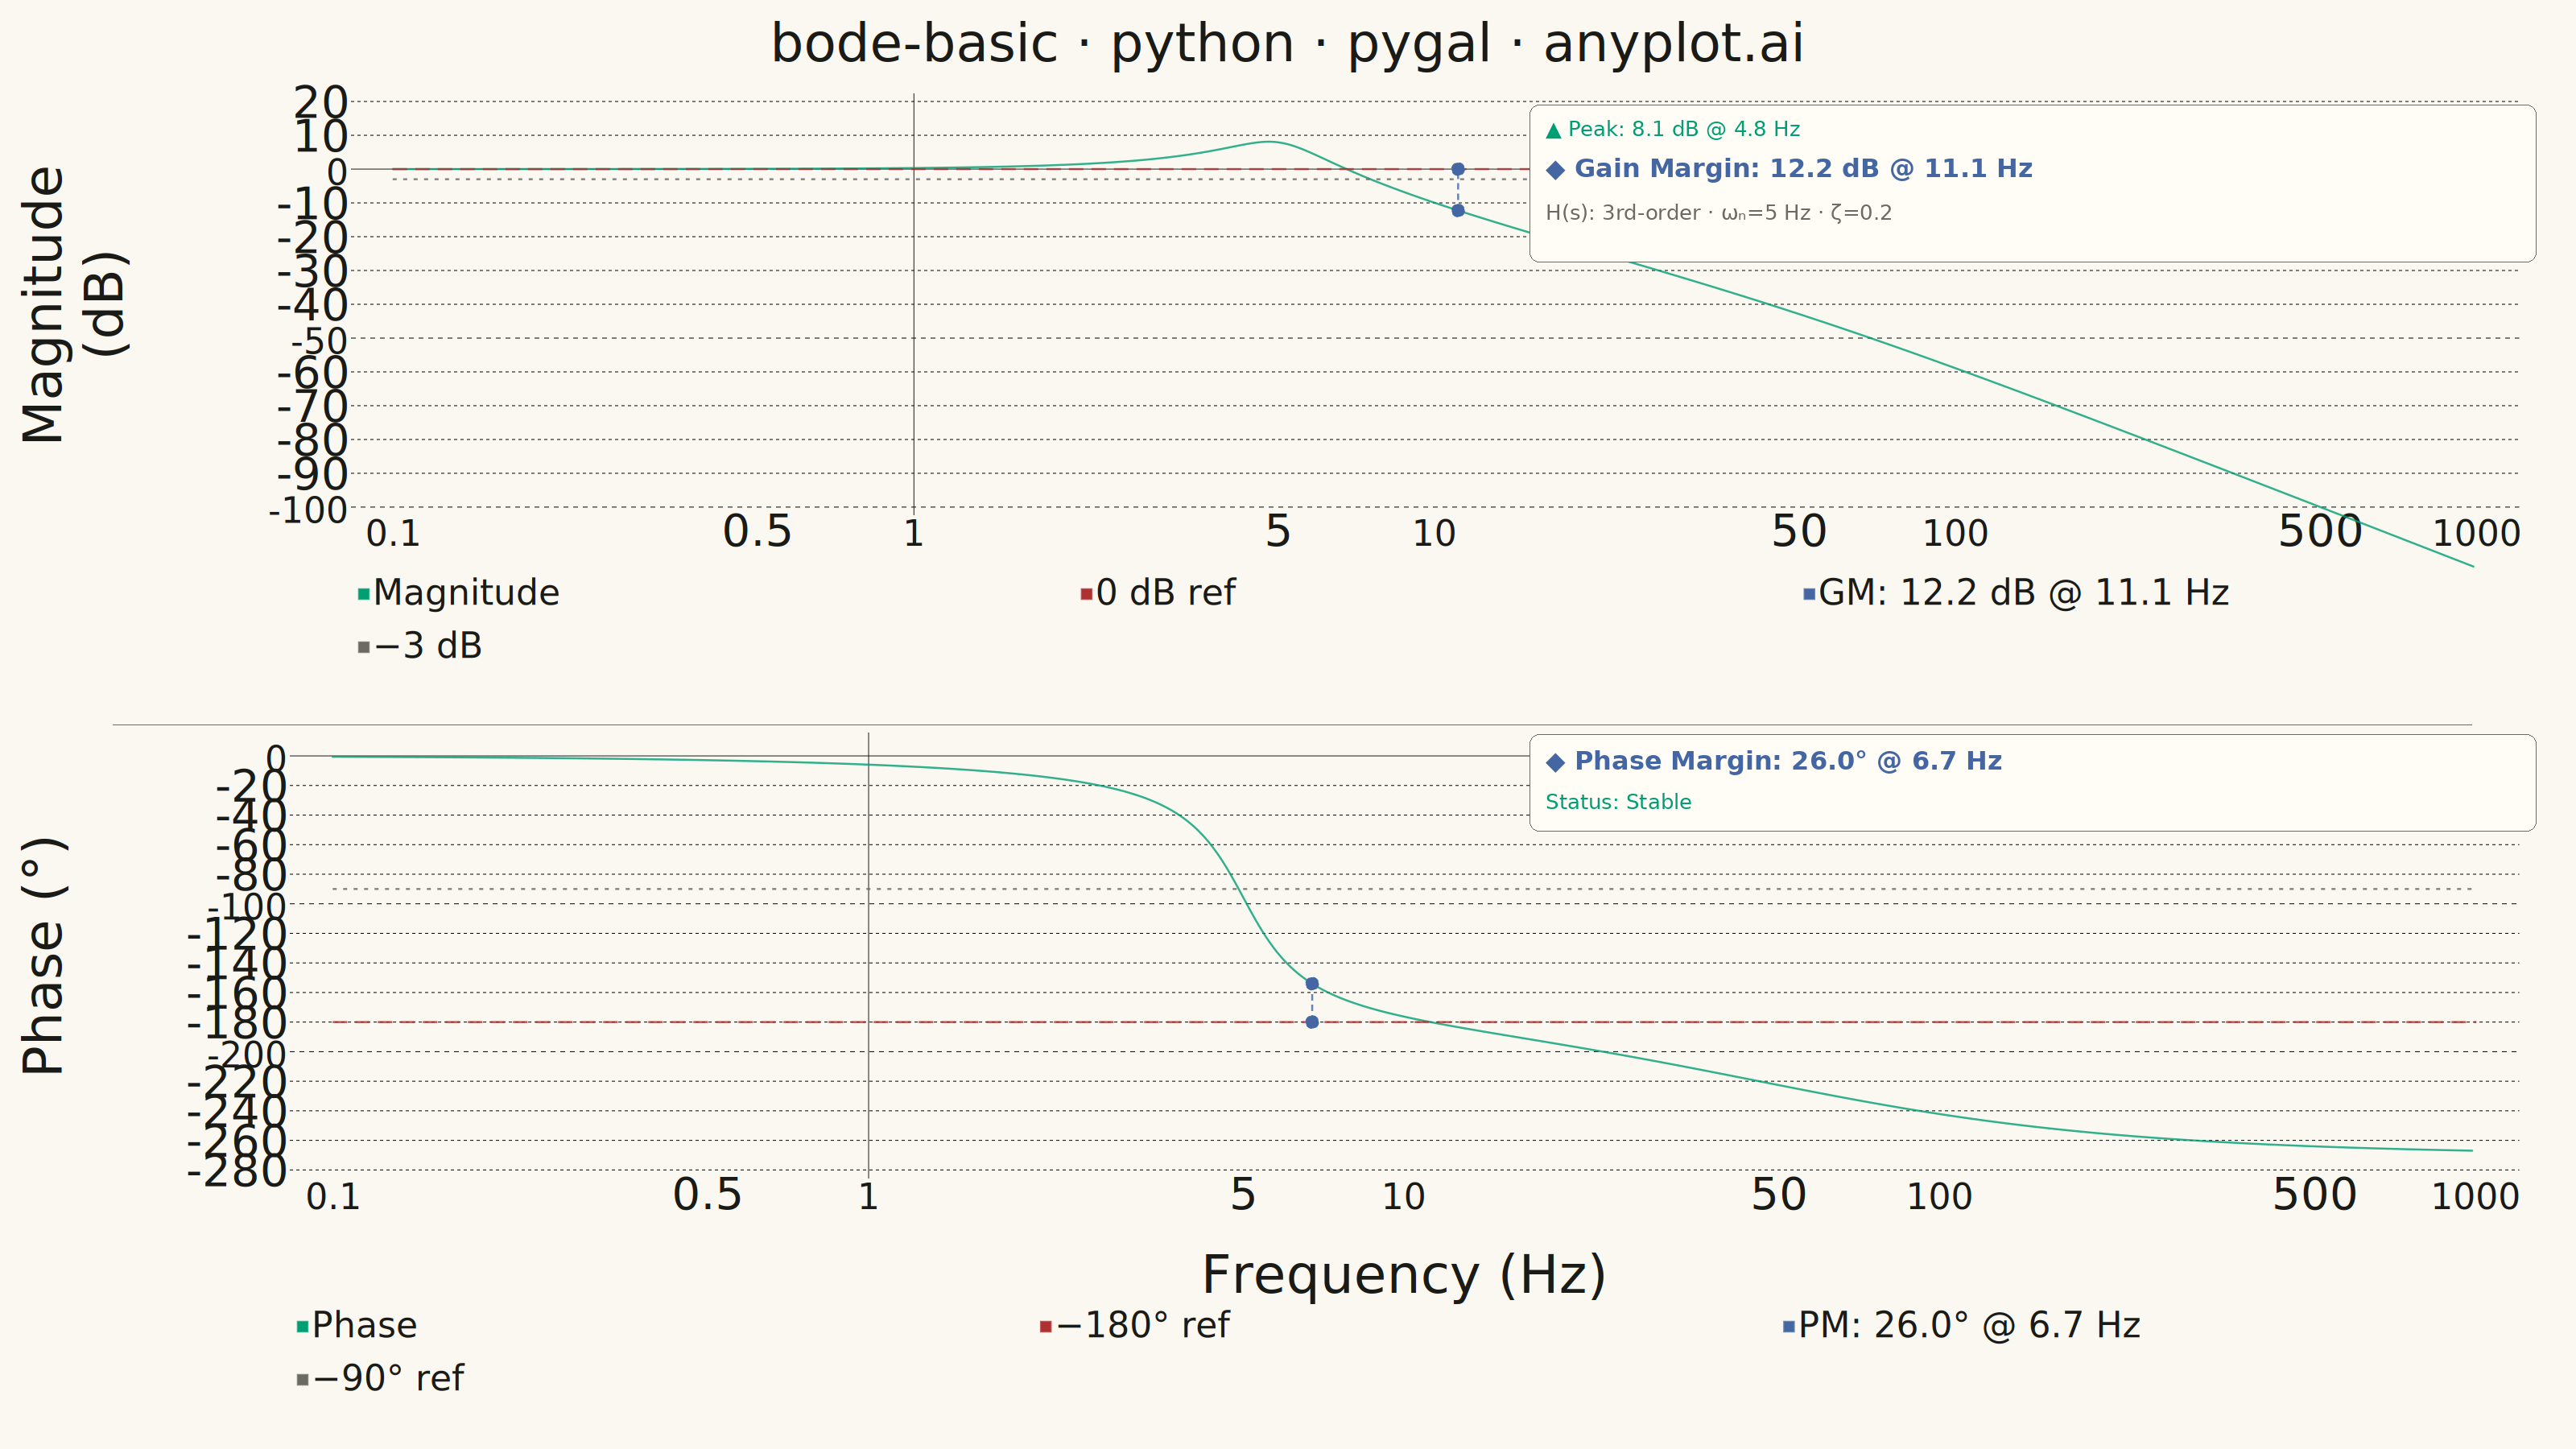
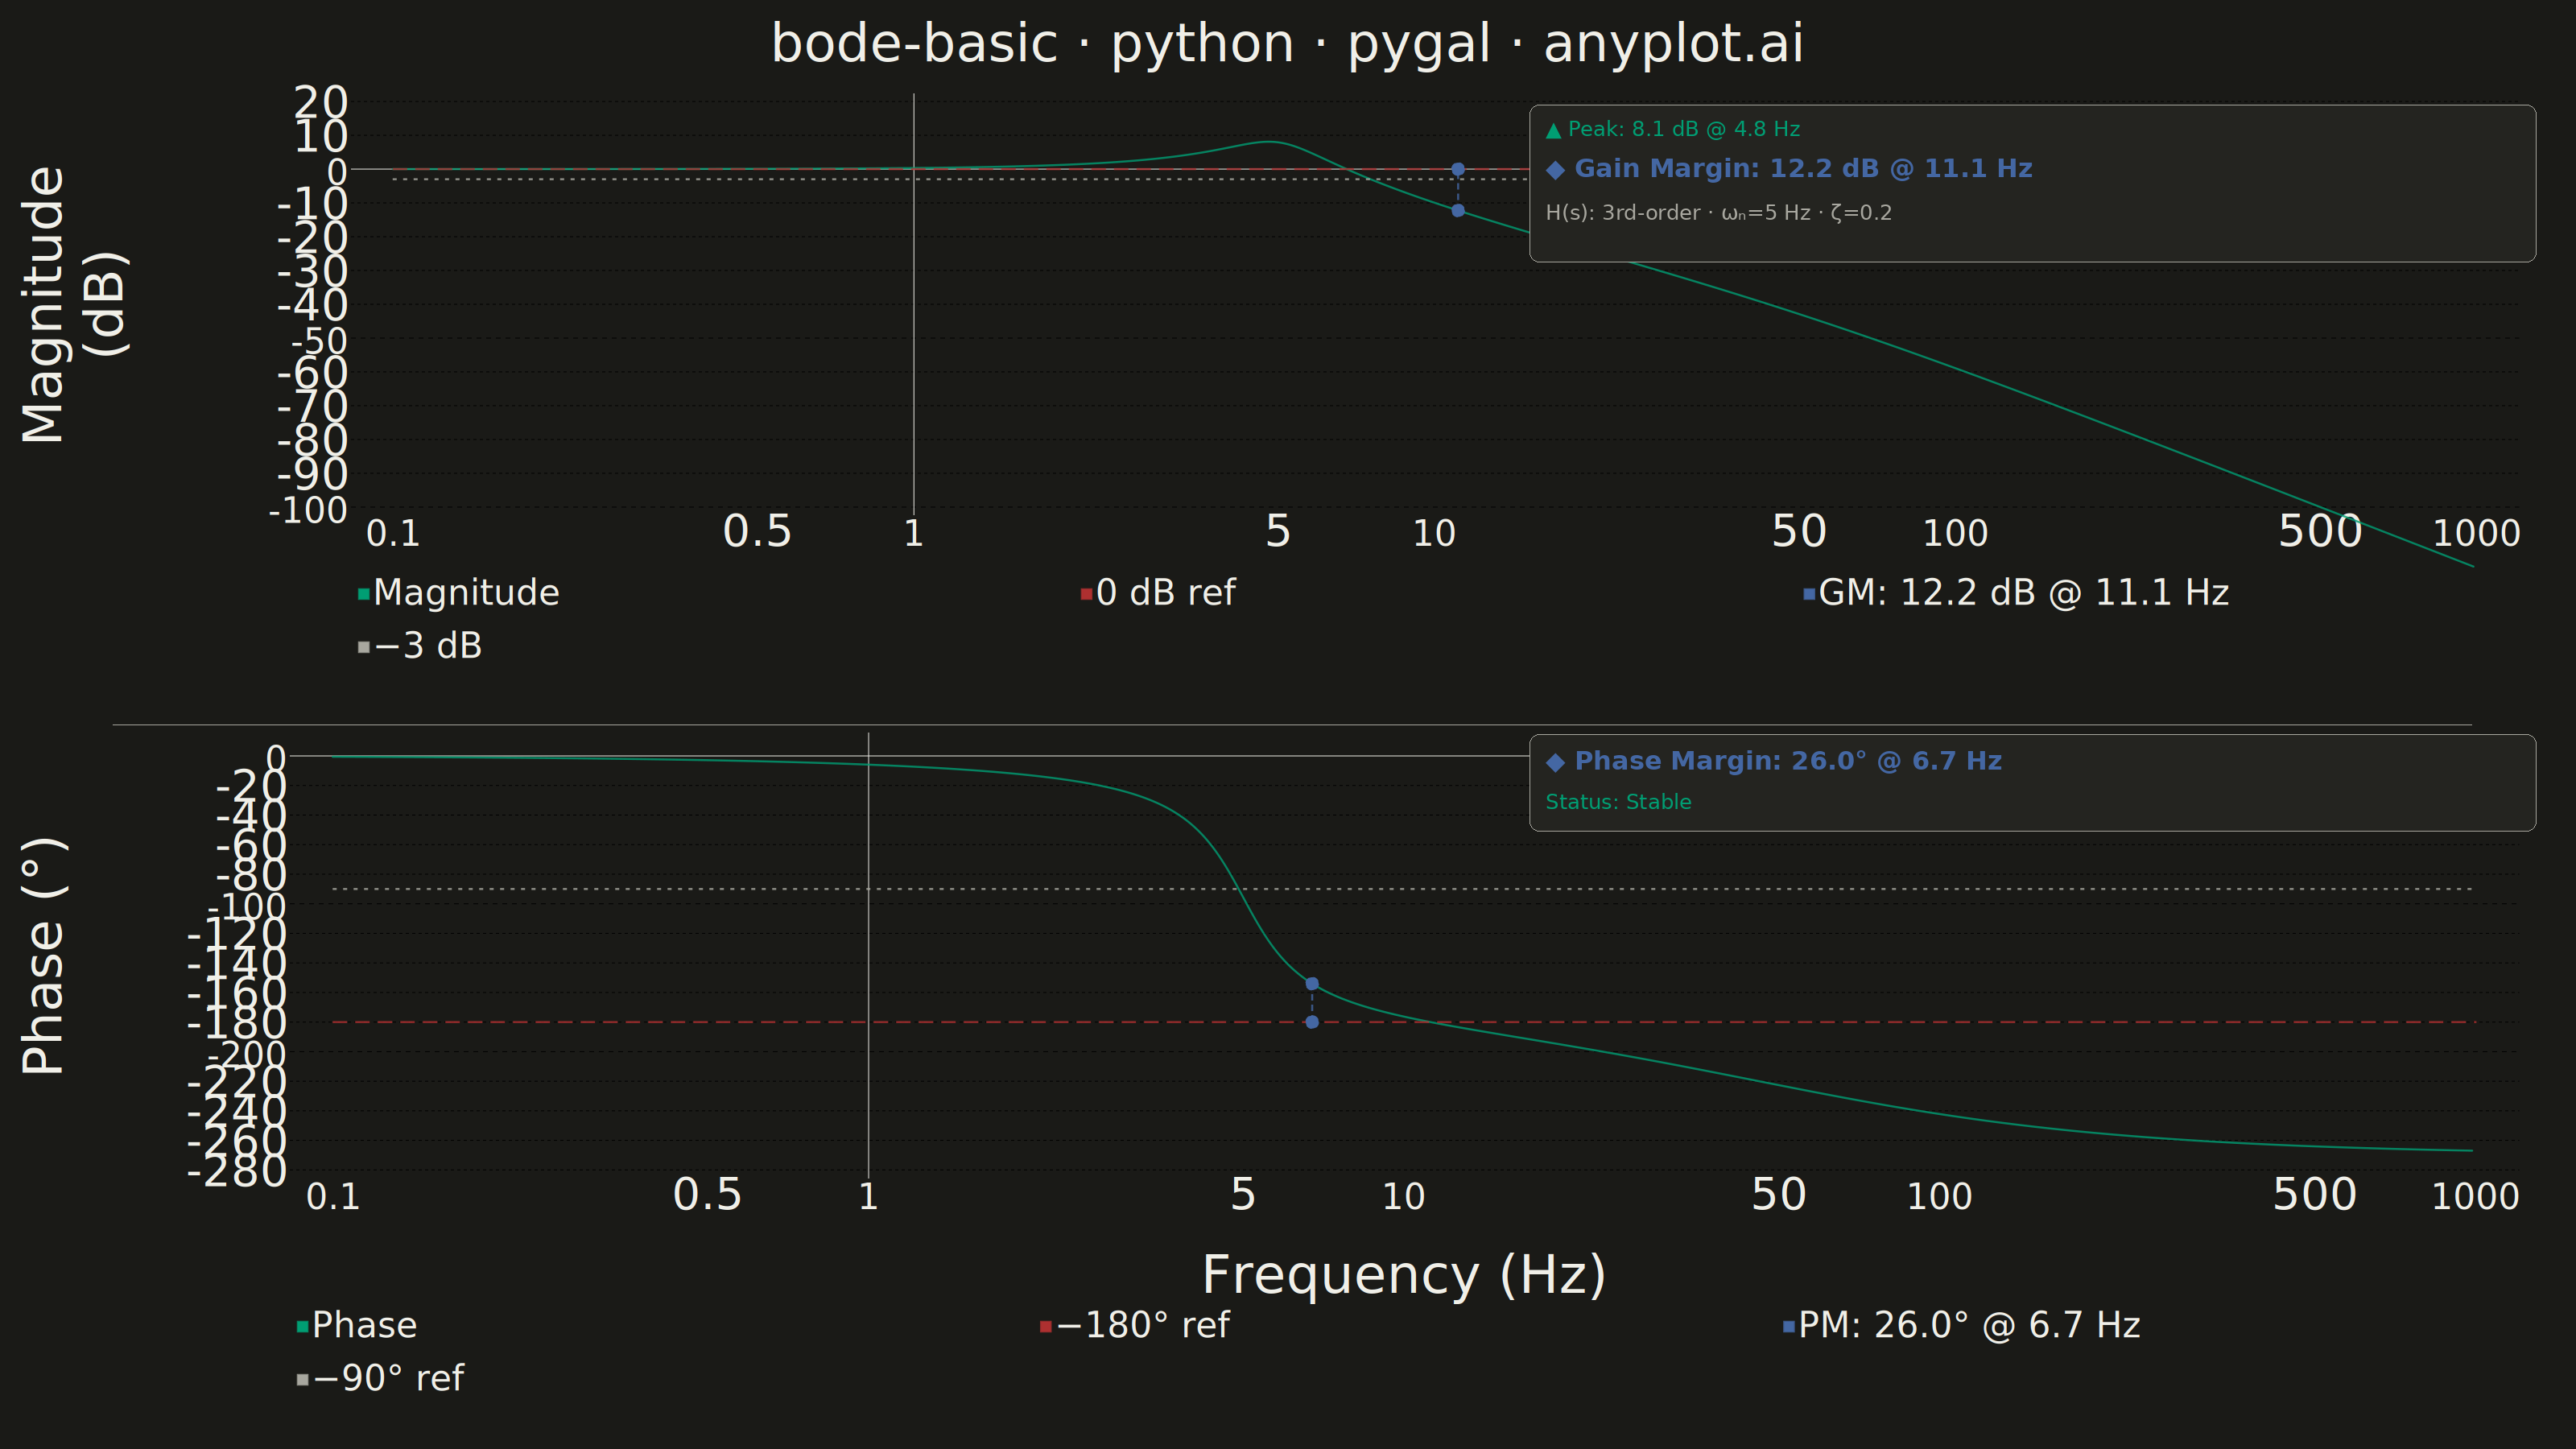
A Bode plot displays a system's frequency response as two vertically aligned panels: magnitude (in decibels) on top and phase (in degrees) on the bottom, both plotted against frequency on a shared logarithmic scale. This visualization is fundamental in control systems engineering and signal processing for analyzing how a system responds to sinusoidal inputs across a range of frequencies, revealing stability characteristics, bandwidth, and resonance behavior.
""" anyplot.ai
bode-basic: Bode Plot for Frequency Response
Library: pygal 3.1.0 | Python 3.13.14
Quality: 88/100 | Updated: 2026-06-17
"""

import io
import os

import cairosvg
import numpy as np
import pygal
from PIL import Image, ImageDraw, ImageFont
from pygal.style import Style


# Theme tokens — Imprint palette (theme-independent) + adaptive chrome
THEME = os.getenv("ANYPLOT_THEME", "light")
PAGE_BG = "#FAF8F1" if THEME == "light" else "#1A1A17"
ELEVATED_BG = "#FFFDF6" if THEME == "light" else "#242420"
INK = "#1A1A17" if THEME == "light" else "#F0EFE8"
INK_SOFT = "#4A4A44" if THEME == "light" else "#B8B7B0"
INK_MUTED = "#6B6A63" if THEME == "light" else "#A8A79F"

BRAND = "#009E73"  # Imprint position 1 — ALWAYS first series
IMPRINT_RED = "#AE3030"  # Imprint position 5 — stability-critical thresholds
IMPRINT_BLUE = "#4467A3"  # Imprint position 3 — margin indicators

# Data — Third-order system: G(s) = K·ωn² / ((s+p)·(s²+2ζωn·s+ωn²))
# Natural frequency 5 Hz, damping 0.2 (clear resonance), extra pole at 50 Hz
frequency_hz = np.logspace(-1, 3, 500)
omega = 2 * np.pi * frequency_hz
wn = 2 * np.pi * 5.0
zeta = 0.2
p = 2 * np.pi * 50.0
s = 1j * omega
G = (wn**2 * p) / ((s + p) * (s**2 + 2 * zeta * wn * s + wn**2))

magnitude_db = 20 * np.log10(np.abs(G))
phase_deg = np.degrees(np.unwrap(np.angle(G)))
log_freq = np.log10(frequency_hz)

# Gain crossover: where magnitude crosses 0 dB (after resonance peak)
peak_idx = np.argmax(magnitude_db)
peak_db = magnitude_db[peak_idx]
peak_freq = frequency_hz[peak_idx]
zero_crossings = np.where(np.diff(np.sign(magnitude_db[peak_idx:])))[0]
if len(zero_crossings) > 0:
    gc_idx = peak_idx + zero_crossings[0]
    gc_freq = frequency_hz[gc_idx]
    gc_phase = phase_deg[gc_idx]
    phase_margin = 180 + gc_phase
else:
    gc_freq = None
    phase_margin = None

# Phase crossover: where phase crosses −180°
pc_indices = np.where(np.diff(np.sign(phase_deg + 180)))[0]
gain_margin = -magnitude_db[pc_indices[0]] if len(pc_indices) > 0 else None
pc_freq = frequency_hz[pc_indices[0]] if len(pc_indices) > 0 else None

# X-axis tick positions — major decades + minor half-decades
x_ticks_major = [0.1, 1, 10, 100, 1000]
x_ticks_minor = [0.5, 5, 50, 500]
x_tick_major_log = [np.log10(v) for v in x_ticks_major]
x_tick_all_log = sorted([np.log10(v) for v in x_ticks_major + x_ticks_minor])

# Subsample for performance
step = 2
mag_pts = [(float(log_freq[i]), float(magnitude_db[i])) for i in range(0, len(log_freq), step)]
phase_pts = [(float(log_freq[i]), float(phase_deg[i])) for i in range(0, len(log_freq), step)]

x_lo, x_hi = float(log_freq[0]), float(log_freq[-1])
ref_0db = [(x_lo, 0.0), (x_hi, 0.0)]
ref_neg180 = [(x_lo, -180.0), (x_hi, -180.0)]

# Margin visual lines — vertical segments between signal and reference
phase_margin_line = None
if gc_freq is not None and phase_margin is not None:
    gc_log = np.log10(gc_freq)
    phase_margin_line = [(float(gc_log), float(gc_phase)), (float(gc_log), -180.0)]

gain_margin_line = None
if pc_freq is not None and gain_margin is not None:
    pc_log = np.log10(pc_freq)
    pc_mag = magnitude_db[pc_indices[0]]
    gain_margin_line = [(float(pc_log), float(pc_mag)), (float(pc_log), 0.0)]

# Shared pygal style — Imprint palette + canonical sizing for 3200×1800 canvas
_style = Style(
    background=PAGE_BG,
    plot_background=PAGE_BG,
    foreground=INK,
    foreground_strong=INK,
    foreground_subtle=INK_MUTED,
    colors=(BRAND, IMPRINT_RED, IMPRINT_BLUE, INK_MUTED),
    title_font_size=66,
    label_font_size=56,
    major_label_font_size=44,
    legend_font_size=44,
    value_font_size=36,
    stroke_width=2.5,
    font_family="'Helvetica Neue', 'Helvetica', 'Arial', sans-serif",
    title_font_family="'Helvetica Neue', 'Helvetica', 'Arial', sans-serif",
    label_font_family="'Helvetica Neue', 'Helvetica', 'Arial', sans-serif",
    value_font_family="'Helvetica Neue', 'Helvetica', 'Arial', sans-serif",
    legend_font_family="'Helvetica Neue', 'Helvetica', 'Arial', sans-serif",
    opacity=1.0,
    opacity_hover=0.85,
    transition="200ms ease-in",
)

# Magnitude chart — top panel (3200×900)
mag_chart = pygal.XY(
    width=3200,
    height=900,
    style=_style,
    show_legend=True,
    legend_at_bottom=True,
    legend_at_bottom_columns=3,
    show_y_guides=True,
    show_x_guides=False,
    margin=20,
    margin_left=140,
    margin_right=70,
    margin_bottom=140,
    margin_top=40,
    dots_size=0,
    stroke=True,
    truncate_label=-1,
    print_values=False,
    x_value_formatter=lambda x: f"{10**x:.4g}",
    tooltip_fancy_mode=True,
    tooltip_border_radius=8,
    title="bode-basic · python · pygal · anyplot.ai",
    x_title="",
    y_title="Magnitude (dB)",
    range=(-100.0, 20.0),
    interpolate="cubic",
    show_minor_x_labels=True,
)
mag_chart.x_labels = x_tick_all_log
mag_chart.x_labels_major = x_tick_major_log
mag_chart.add(
    "Magnitude",
    mag_pts,
    show_dots=False,
    formatter=lambda x, y: f"{10**x:.2g} Hz → {y:.1f} dB",
    stroke_style={"width": 5, "linecap": "round", "linejoin": "round"},
)
mag_chart.add("0 dB ref", ref_0db, show_dots=False, stroke_style={"width": 2.5, "dasharray": "18,10"})
if gain_margin_line:
    mag_chart.add(
        f"GM: {gain_margin:.1f} dB @ {pc_freq:.1f} Hz",
        gain_margin_line,
        show_dots=True,
        dots_size=8,
        stroke_style={"width": 3, "dasharray": "8,5"},
    )
# −3 dB reference — slightly more visible than previous (width 2 vs 1.5)
bw_3db = [(x_lo, -3.0), (x_hi, -3.0)]
mag_chart.add("−3 dB", bw_3db, show_dots=False, stroke_style={"width": 2, "dasharray": "5,8"})

# Phase chart — bottom panel (3200×900)
phase_chart = pygal.XY(
    width=3200,
    height=900,
    style=_style,
    show_legend=True,
    legend_at_bottom=True,
    legend_at_bottom_columns=3,
    show_y_guides=True,
    show_x_guides=False,
    margin=20,
    margin_left=140,
    margin_right=70,
    margin_bottom=140,
    margin_top=10,
    dots_size=0,
    stroke=True,
    truncate_label=-1,
    print_values=False,
    x_value_formatter=lambda x: f"{10**x:.4g}",
    tooltip_fancy_mode=True,
    tooltip_border_radius=8,
    title="",
    x_title="Frequency (Hz)",
    y_title="Phase (°)",
    range=(-280.0, 10.0),
    interpolate="cubic",
    show_minor_x_labels=True,
)
phase_chart.x_labels = x_tick_all_log
phase_chart.x_labels_major = x_tick_major_log
phase_chart.add(
    "Phase",
    phase_pts,
    show_dots=False,
    formatter=lambda x, y: f"{10**x:.2g} Hz → {y:.1f}°",
    stroke_style={"width": 5, "linecap": "round", "linejoin": "round"},
)
phase_chart.add("−180° ref", ref_neg180, show_dots=False, stroke_style={"width": 2.5, "dasharray": "18,10"})
if phase_margin_line:
    phase_chart.add(
        f"PM: {phase_margin:.1f}° @ {gc_freq:.1f} Hz",
        phase_margin_line,
        show_dots=True,
        dots_size=8,
        stroke_style={"width": 3, "dasharray": "8,5"},
    )
ref_neg90 = [(x_lo, -90.0), (x_hi, -90.0)]
phase_chart.add("−90° ref", ref_neg90, show_dots=False, stroke_style={"width": 2, "dasharray": "5,8"})

# Render each panel to PNG via cairosvg — each panel 3200×900
mag_png = cairosvg.svg2png(bytestring=mag_chart.render(), output_width=3200, output_height=900)
phase_png = cairosvg.svg2png(bytestring=phase_chart.render(), output_width=3200, output_height=900)

# Compose 3200×1800 dual-panel image (landscape canonical canvas)
mag_img = Image.open(io.BytesIO(mag_png))
phase_img = Image.open(io.BytesIO(phase_png))
combined = Image.new("RGB", (3200, 1800), PAGE_BG)
combined.paste(mag_img, (0, 0))
combined.paste(phase_img, (0, 900))

# Refined panel divider
draw = ImageDraw.Draw(combined)
draw.line([(140, 900), (3070, 900)], fill=INK_MUTED, width=1)

# Annotation fonts
try:
    font_bold = ImageFont.truetype("/usr/share/fonts/truetype/dejavu/DejaVuSans-Bold.ttf", 32)
    font_reg = ImageFont.truetype("/usr/share/fonts/truetype/dejavu/DejaVuSans.ttf", 26)
except OSError:
    font_bold = ImageFont.load_default()
    font_reg = font_bold

# Magnitude annotation panel — upper right of top panel, below title area
ann_x, ann_y = 1900, 130
ann_w, ann_h = 1250, 195
draw.rounded_rectangle(
    [(ann_x, ann_y), (ann_x + ann_w, ann_y + ann_h)], radius=12, fill=ELEVATED_BG, outline=INK_MUTED, width=1
)
draw.text((ann_x + 20, ann_y + 14), f"▲ Peak: {peak_db:.1f} dB @ {peak_freq:.1f} Hz", fill=BRAND, font=font_reg)
if gain_margin is not None and pc_freq is not None:
    draw.text(
        (ann_x + 20, ann_y + 60),
        f"◆ Gain Margin: {gain_margin:.1f} dB @ {pc_freq:.1f} Hz",
        fill=IMPRINT_BLUE,
        font=font_bold,
    )
else:
    draw.text((ann_x + 20, ann_y + 60), "◆ Gain Margin: ∞", fill=IMPRINT_BLUE, font=font_bold)
draw.text((ann_x + 20, ann_y + 118), "H(s): 3rd-order · ωₙ=5 Hz · ζ=0.2", fill=INK_MUTED, font=font_reg)

# Phase annotation panel — upper right of bottom panel
ann2_x, ann2_y = 1900, 912
ann2_w, ann2_h = 1250, 120
draw.rounded_rectangle(
    [(ann2_x, ann2_y), (ann2_x + ann2_w, ann2_y + ann2_h)], radius=12, fill=ELEVATED_BG, outline=INK_MUTED, width=1
)
if phase_margin is not None and gc_freq is not None:
    draw.text(
        (ann2_x + 20, ann2_y + 14),
        f"◆ Phase Margin: {phase_margin:.1f}° @ {gc_freq:.1f} Hz",
        fill=IMPRINT_BLUE,
        font=font_bold,
    )
    stability = "Stable" if phase_margin > 0 else "Unstable"
    stability_color = BRAND if phase_margin > 0 else IMPRINT_RED
    draw.text((ann2_x + 20, ann2_y + 68), f"Status: {stability}", fill=stability_color, font=font_reg)

combined.save(f"plot-{THEME}.png", dpi=(300, 300))

# HTML export — pygal native SVG interactivity with tooltips
mag_svg = mag_chart.render(is_unicode=True).replace('<?xml version="1.0" encoding="utf-8"?>', "")
phase_svg = phase_chart.render(is_unicode=True).replace('<?xml version="1.0" encoding="utf-8"?>', "")

html_content = (
    "<!DOCTYPE html>\n<html>\n<head>\n"
    "    <title>bode-basic · python · pygal · anyplot.ai</title>\n"
    "    <style>\n"
    f"        body {{ font-family: 'Helvetica Neue', sans-serif; background: {PAGE_BG};"
    " margin: 0; padding: 40px 20px; }\n"
    "        .container { max-width: 1200px; margin: 0 auto; }\n"
    "        .chart { width: 100%; margin: 8px 0; }\n"
    f"        .divider {{ border: none; border-top: 1px solid {INK_MUTED}; margin: 0; }}\n"
    "        .info { text-align: center; font-size: 13px; margin-top: 10px; "
    f"color: {INK_MUTED}; }}\n"
    "    </style>\n</head>\n<body>\n"
    "    <div class='container'>\n"
    f"        <div class='chart'>{mag_svg}</div>\n"
    "        <hr class='divider'/>\n"
    f"        <div class='chart'>{phase_svg}</div>\n"
    "        <p class='info'>Hover over data points for frequency/value details</p>\n"
    "    </div>\n</body>\n</html>"
)

with open(f"plot-{THEME}.html", "w") as f:
    f.write(html_content)
Runnable source as JSON, for any HTTP client: https://api.anyplot.ai/specs/bode-basic/pygal/code. Any spec id and library id listed in llms-full.txt fit the same URL shape; every URL below is complete and callable.
{
  "spec_id": "bode-basic",
  "language": "python",
  "library": "pygal",
  "page": "https://anyplot.ai/bode-basic/python/pygal",
  "hub": "https://anyplot.ai/bode-basic",
  "code_json": "https://api.anyplot.ai/specs/bode-basic/pygal/code",
  "spec_json": "https://api.anyplot.ai/specs/bode-basic",
  "render_light_png": "https://storage.googleapis.com/anyplot-images/plots/bode-basic/python/pygal/plot-light.png",
  "render_dark_png": "https://storage.googleapis.com/anyplot-images/plots/bode-basic/python/pygal/plot-dark.png",
  "interactive_light_html": "https://storage.googleapis.com/anyplot-images/plots/bode-basic/python/pygal/plot-light.html",
  "interactive_dark_html": "https://storage.googleapis.com/anyplot-images/plots/bode-basic/python/pygal/plot-dark.html",
  "quality_score": 88.0,
  "license": "MIT",
  "guide": "https://anyplot.ai/llms.txt"
}
Part of Bode Plot for Frequency Response on anyplot.ai.