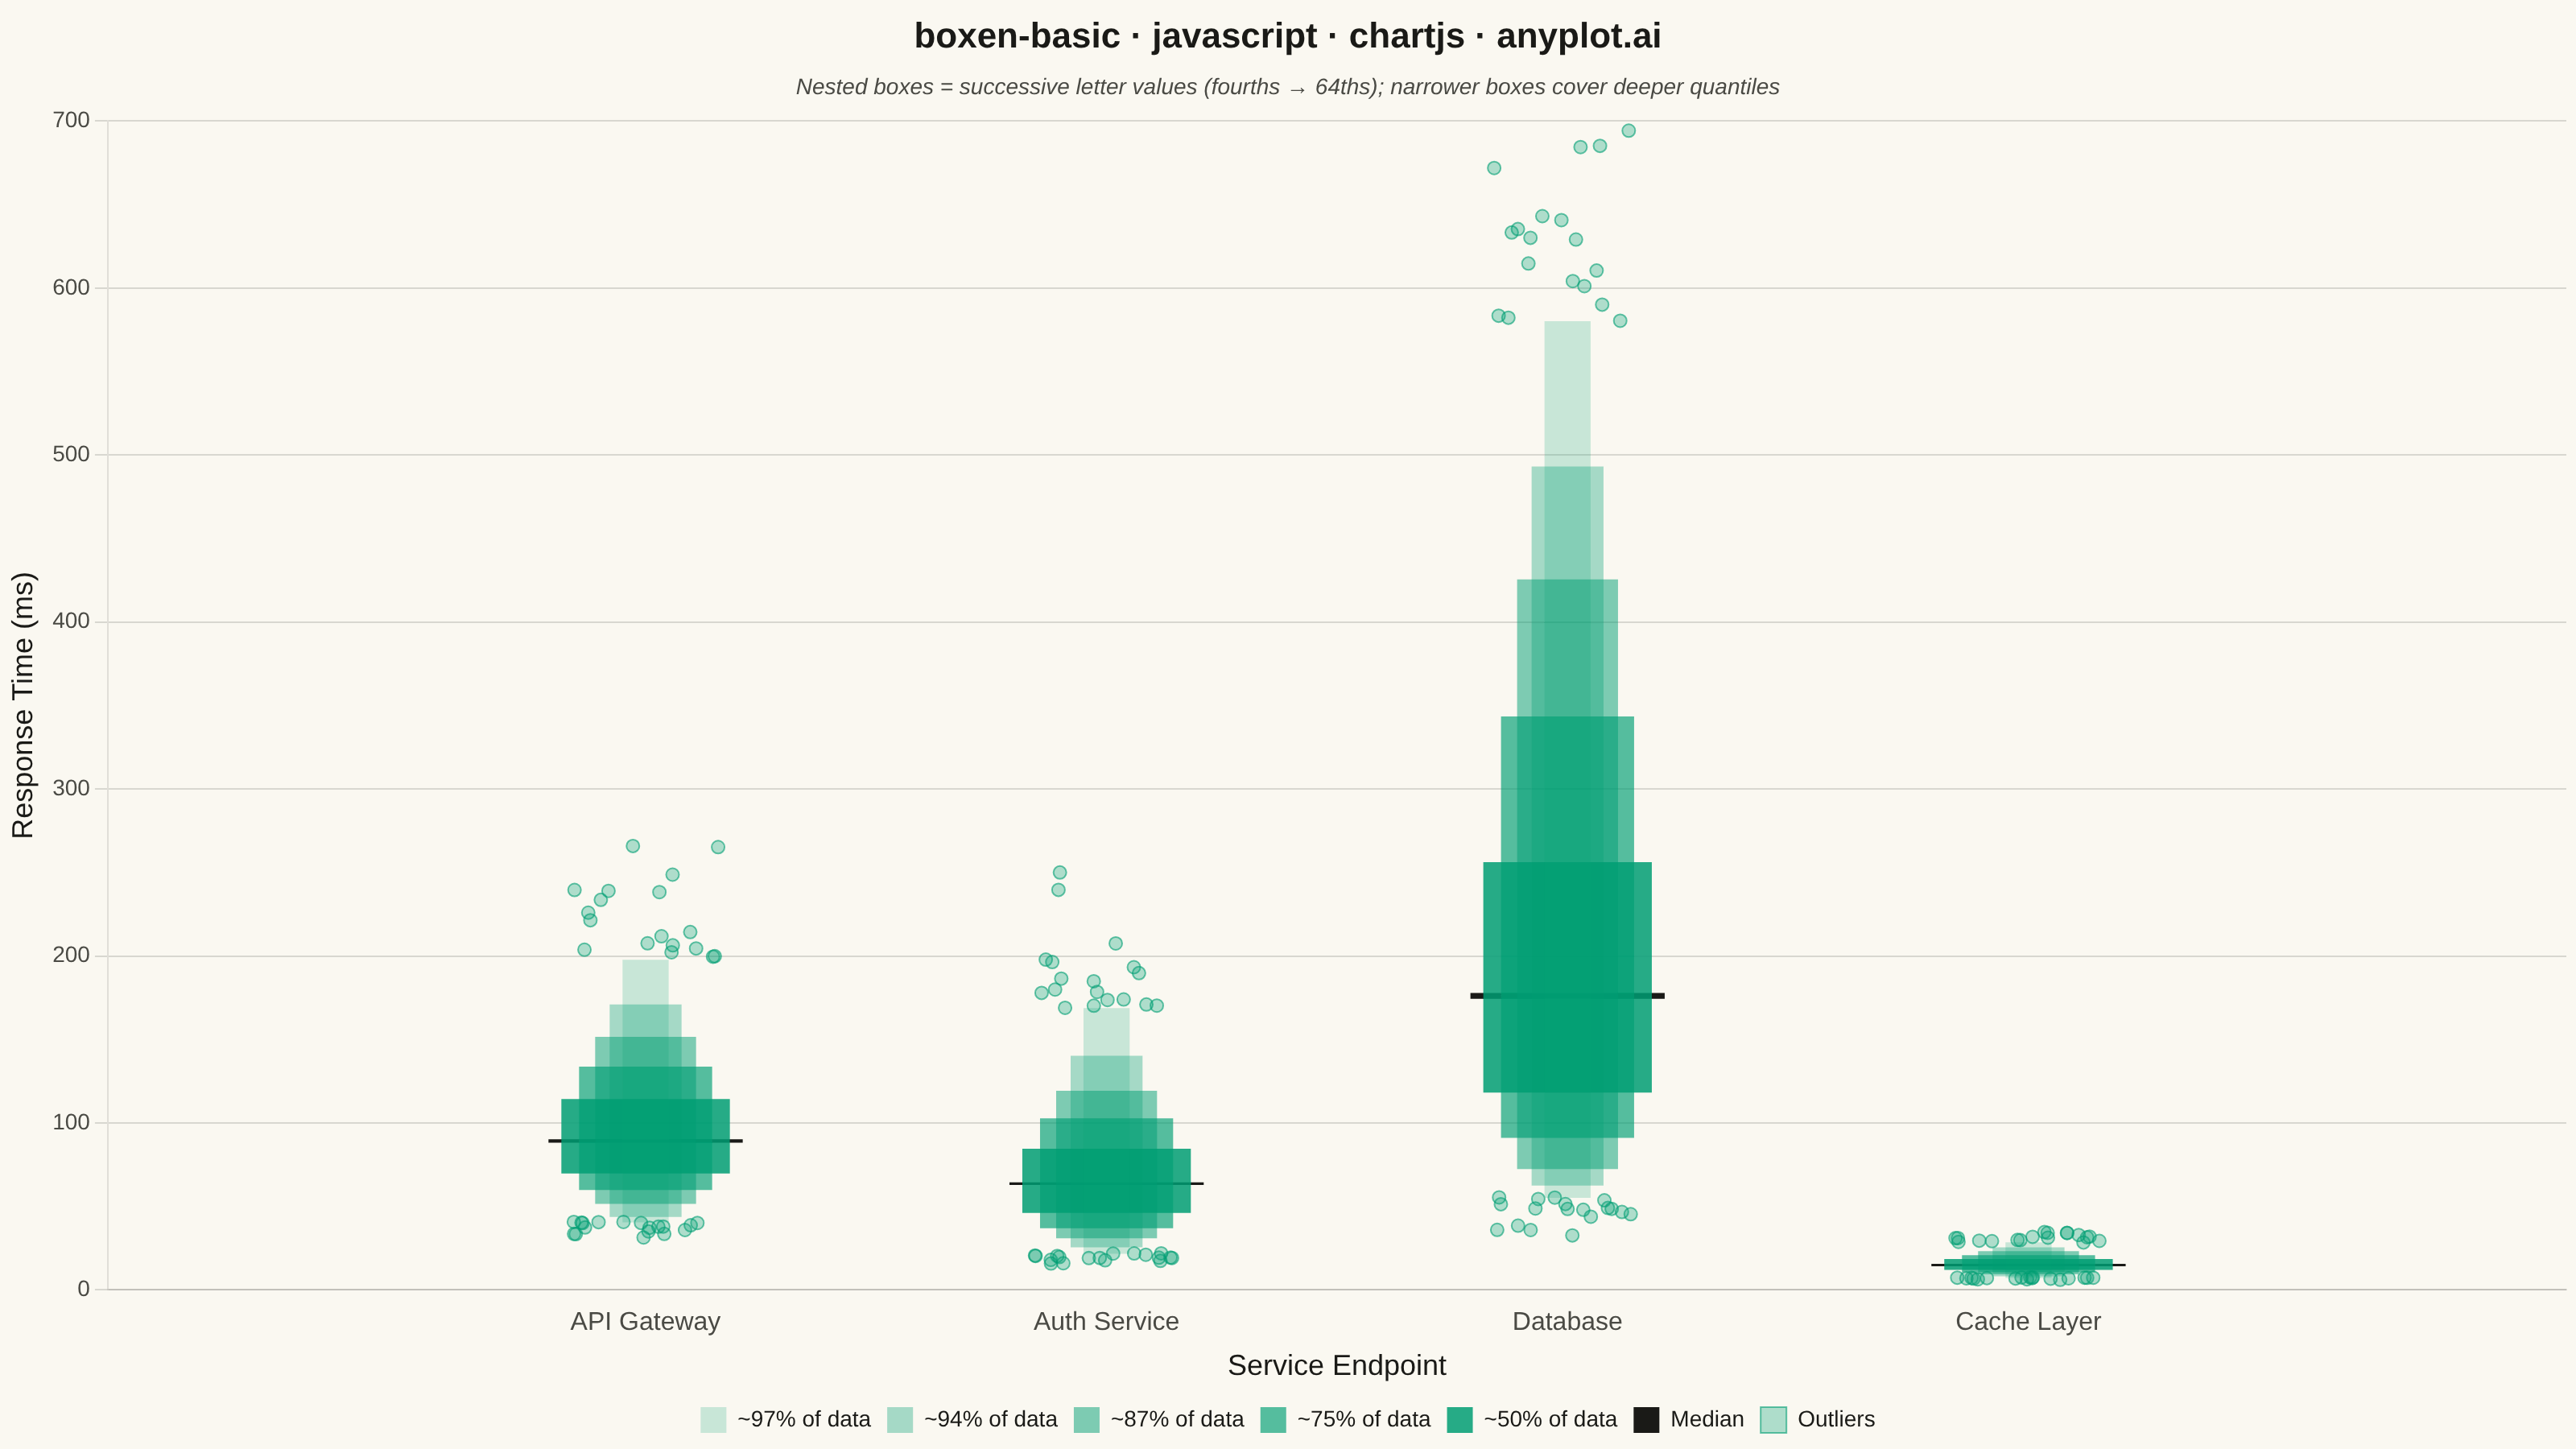
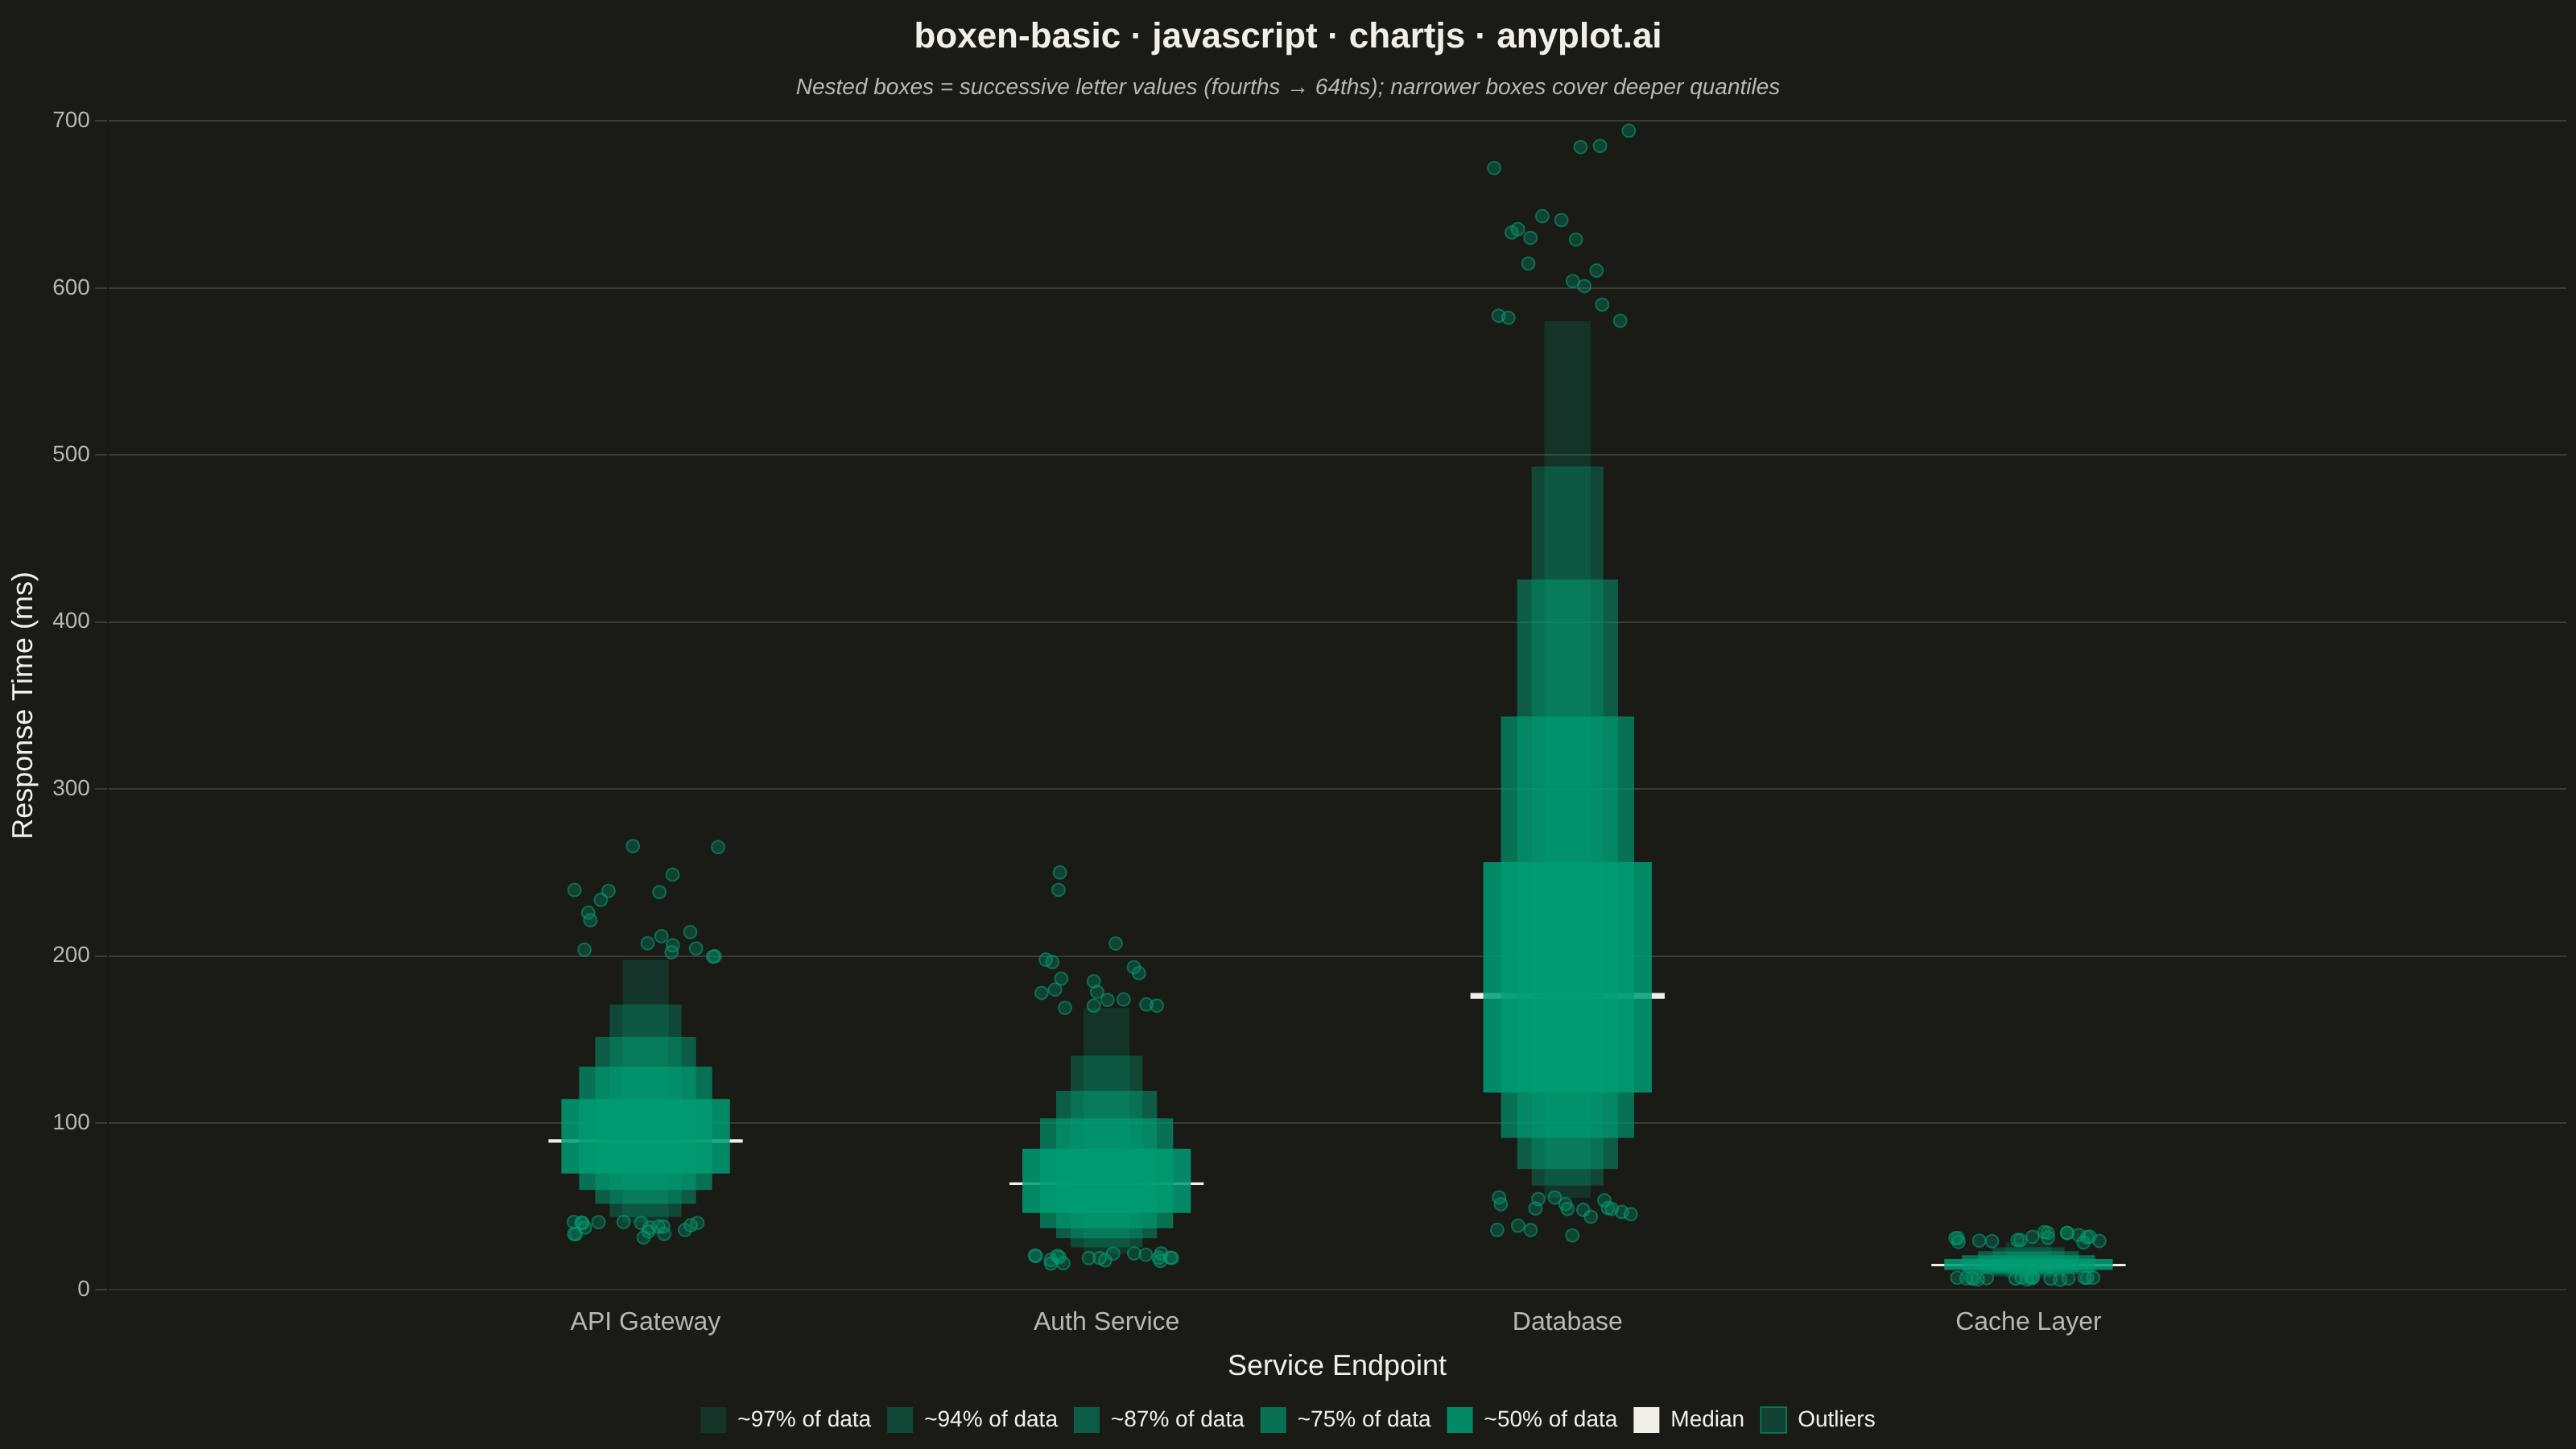
The same plot in 14 other libraries — JavaScript: D3.js, Apache ECharts, Highcharts, MUI X Charts; Python: Altair, Bokeh, lets-plot, Matplotlib, Plotly, plotnine, Pygal, Seaborn; R: ggplot2; Julia: Makie.jl. Compare all 15 side by side: Basic Boxen Plot (Letter-Value Plot) in Python, R, Julia and JavaScript.
A boxen plot (also known as letter-value plot) extends the traditional box plot to show more quantile information, making it ideal for large datasets with 1000+ observations. Instead of just displaying the median and quartiles, it shows additional "letter values" (eighths, sixteenths, etc.) as nested boxes, revealing the full shape of the distribution including tail behavior. This makes outlier detection more meaningful and distribution comparison more detailed.
// anyplot.ai
// boxen-basic: Basic Boxen Plot (Letter-Value Plot)
// Library: chartjs 4.4.7 | JavaScript 22.23.2
// Quality: 90/100 | Created: 2026-09-01

const t = window.ANYPLOT_TOKENS;

// --- Deterministic PRNG (LCG) + Box-Muller normal sampler -------------------
function makeLcg(seed) {
  let state = seed >>> 0;
  return function next() {
    state = (Math.imul(1664525, state) + 1013904223) >>> 0;
    return state / 4294967296;
  };
}

function randNormal(rng) {
  const u1 = Math.max(rng(), 1e-9);
  const u2 = rng();
  return Math.sqrt(-2 * Math.log(u1)) * Math.cos(2 * Math.PI * u2);
}

function hexToRgba(hex, alpha) {
  const r = parseInt(hex.slice(1, 3), 16);
  const g = parseInt(hex.slice(3, 5), 16);
  const b = parseInt(hex.slice(5, 7), 16);
  return `rgba(${r}, ${g}, ${b}, ${alpha})`;
}

// --- Letter values (Tukey depths): nested boxes narrower than the previous
// one at each recursion, from the fourths (innermost) outward -------------
function letterValues(sorted, numLevels) {
  const n = sorted.length;
  const boxes = [];
  let depth = (n + 1) / 2; // median depth
  for (let level = 0; level < numLevels; level++) {
    depth = (Math.floor(depth) + 1) / 2;
    const loIdx = Math.max(0, Math.floor(depth) - 1);
    const hiIdx = Math.min(n - 1, n - Math.floor(depth));
    const coverage = Math.round((1 - (2 * depth) / (n + 1)) * 100);
    boxes.push({ lo: sorted[loIdx], hi: sorted[hiIdx], coverage });
  }
  return boxes;
}

function median(sorted) {
  const n = sorted.length;
  return n % 2 === 1 ? sorted[(n - 1) / 2] : (sorted[n / 2 - 1] + sorted[n / 2]) / 2;
}

// --- Data: response-time distributions (ms) across 4 backend services,
// each 1200 requests — large enough that a boxen plot's extra letter
// values (beyond a standard box plot) reveal real tail behavior ----------
const services = [
  { name: "API Gateway", meanLog: Math.log(90), sigmaLog: 0.35, seed: 11 },
  { name: "Auth Service", meanLog: Math.log(60), sigmaLog: 0.45, seed: 23 },
  { name: "Database", meanLog: Math.log(180), sigmaLog: 0.55, seed: 37 },
  { name: "Cache Layer", meanLog: Math.log(15), sigmaLog: 0.3, seed: 53 },
];

const SAMPLE_SIZE = 1200;
const NUM_LEVELS = 5; // fourths, eighths, sixteenths, 32nds, 64ths

const perService = services.map((svc, i) => {
  const rng = makeLcg(svc.seed);
  const values = Array.from(
    { length: SAMPLE_SIZE },
    () => Math.exp(svc.meanLog + svc.sigmaLog * randNormal(rng)),
  );
  values.sort((a, b) => a - b);

  const boxes = letterValues(values, NUM_LEVELS);
  const outermost = boxes[NUM_LEVELS - 1];
  const jitterRng = makeLcg(svc.seed * 997);
  const outliers = values
    .filter((v) => v < outermost.lo || v > outermost.hi)
    .map((v) => ({ x: i + 1 + (jitterRng() - 0.5) * 0.32, y: v }));

  return { name: svc.name, catX: i + 1, boxes, median: median(values), outliers };
});

// --- Mount -------------------------------------------------------------------
const canvas = document.createElement("canvas");
document.getElementById("container").appendChild(canvas);

// --- Datasets: outermost (widest range, thinnest bar) drawn first, each
// narrower level drawn on top, ending with the median line and outliers ---
const brand = t.palette[0];
const thickness = [104, 82, 62, 44, 28]; // level 0 (fourths) -> level 4 (64ths)
const alpha = [0.85, 0.66, 0.5, 0.34, 0.2];

const boxDatasets = [];
for (let level = NUM_LEVELS - 1; level >= 0; level--) {
  boxDatasets.push({
    type: "bar",
    label: `~${perService[0].boxes[level].coverage}% of data`,
    data: perService.map((svc) => ({ x: svc.catX, y: [svc.boxes[level].lo, svc.boxes[level].hi] })),
    backgroundColor: hexToRgba(brand, alpha[level]),
    borderWidth: 0,
    barThickness: thickness[level],
    grouped: false,
  });
}

const medianDataset = {
  type: "bar",
  label: "Median",
  data: perService.map((svc) => {
    const eps = Math.max(0.4, svc.median * 0.008);
    return { x: svc.catX, y: [svc.median - eps, svc.median + eps] };
  }),
  backgroundColor: t.ink,
  borderWidth: 0,
  barThickness: thickness[0] + 16,
  grouped: false,
};

const outlierDataset = {
  type: "scatter",
  label: "Outliers",
  data: perService.flatMap((svc) => svc.outliers),
  backgroundColor: hexToRgba(brand, 0.3),
  borderColor: hexToRgba(brand, 0.6),
  borderWidth: 1,
  pointRadius: 4,
  pointHoverRadius: 5,
  showLine: false,
};

// --- Chart -------------------------------------------------------------------
new Chart(canvas, {
  type: "bar",
  data: { datasets: [...boxDatasets, medianDataset, outlierDataset] },
  options: {
    responsive: true,
    maintainAspectRatio: false,
    animation: false,
    plugins: {
      title: {
        display: true,
        text: "boxen-basic · javascript · chartjs · anyplot.ai",
        color: t.ink,
        font: { size: 22 },
      },
      subtitle: {
        display: true,
        text: "Nested boxes = successive letter values (fourths → 64ths); narrower boxes cover deeper quantiles",
        color: t.inkSoft,
        font: { size: 14, style: "italic" },
        padding: { bottom: 12 },
      },
      legend: {
        position: "bottom",
        labels: { color: t.ink, font: { size: 14 }, boxWidth: 16, boxHeight: 16 },
      },
    },
    scales: {
      x: {
        type: "linear",
        min: 0.5,
        max: services.length + 0.5,
        afterBuildTicks: (axis) => {
          axis.ticks = services.map((_, i) => ({ value: i + 1 }));
        },
        ticks: {
          color: t.inkSoft,
          font: { size: 16 },
          callback: (value) => services[Math.round(value) - 1]?.name ?? "",
        },
        grid: { display: false },
        title: { display: true, text: "Service Endpoint", color: t.ink, font: { size: 18 } },
      },
      y: {
        ticks: { color: t.inkSoft, font: { size: 14 } },
        grid: { color: t.grid },
        title: { display: true, text: "Response Time (ms)", color: t.ink, font: { size: 18 } },
      },
    },
  },
});
Runnable source as JSON, for any HTTP client: https://api.anyplot.ai/specs/boxen-basic/chartjs/code. Any spec id and library id listed in llms-full.txt fit the same URL shape; every URL below is complete and callable.
{
  "spec_id": "boxen-basic",
  "language": "javascript",
  "library": "chartjs",
  "page": "https://anyplot.ai/boxen-basic/javascript/chartjs",
  "hub": "https://anyplot.ai/boxen-basic",
  "code_json": "https://api.anyplot.ai/specs/boxen-basic/chartjs/code",
  "spec_json": "https://api.anyplot.ai/specs/boxen-basic",
  "render_light_png": "https://storage.googleapis.com/anyplot-images/plots/boxen-basic/javascript/chartjs/plot-light.png",
  "render_dark_png": "https://storage.googleapis.com/anyplot-images/plots/boxen-basic/javascript/chartjs/plot-dark.png",
  "interactive_light_html": "https://storage.googleapis.com/anyplot-images/plots/boxen-basic/javascript/chartjs/plot-light.html",
  "interactive_dark_html": "https://storage.googleapis.com/anyplot-images/plots/boxen-basic/javascript/chartjs/plot-dark.html",
  "quality_score": 90.0,
  "license": "MIT",
  "guide": "https://anyplot.ai/llms.txt"
}
Part of Basic Boxen Plot (Letter-Value Plot) on anyplot.ai.