The same plot in 14 other libraries — Python: Altair, Bokeh, lets-plot, Matplotlib, Plotly, plotnine, Pygal, Seaborn; R: ggplot2; JavaScript: Chart.js, D3.js, Apache ECharts, Highcharts, MUI X Charts. Compare all 15 side by side: Basic Boxen Plot (Letter-Value Plot) in Python, R, Julia and JavaScript.
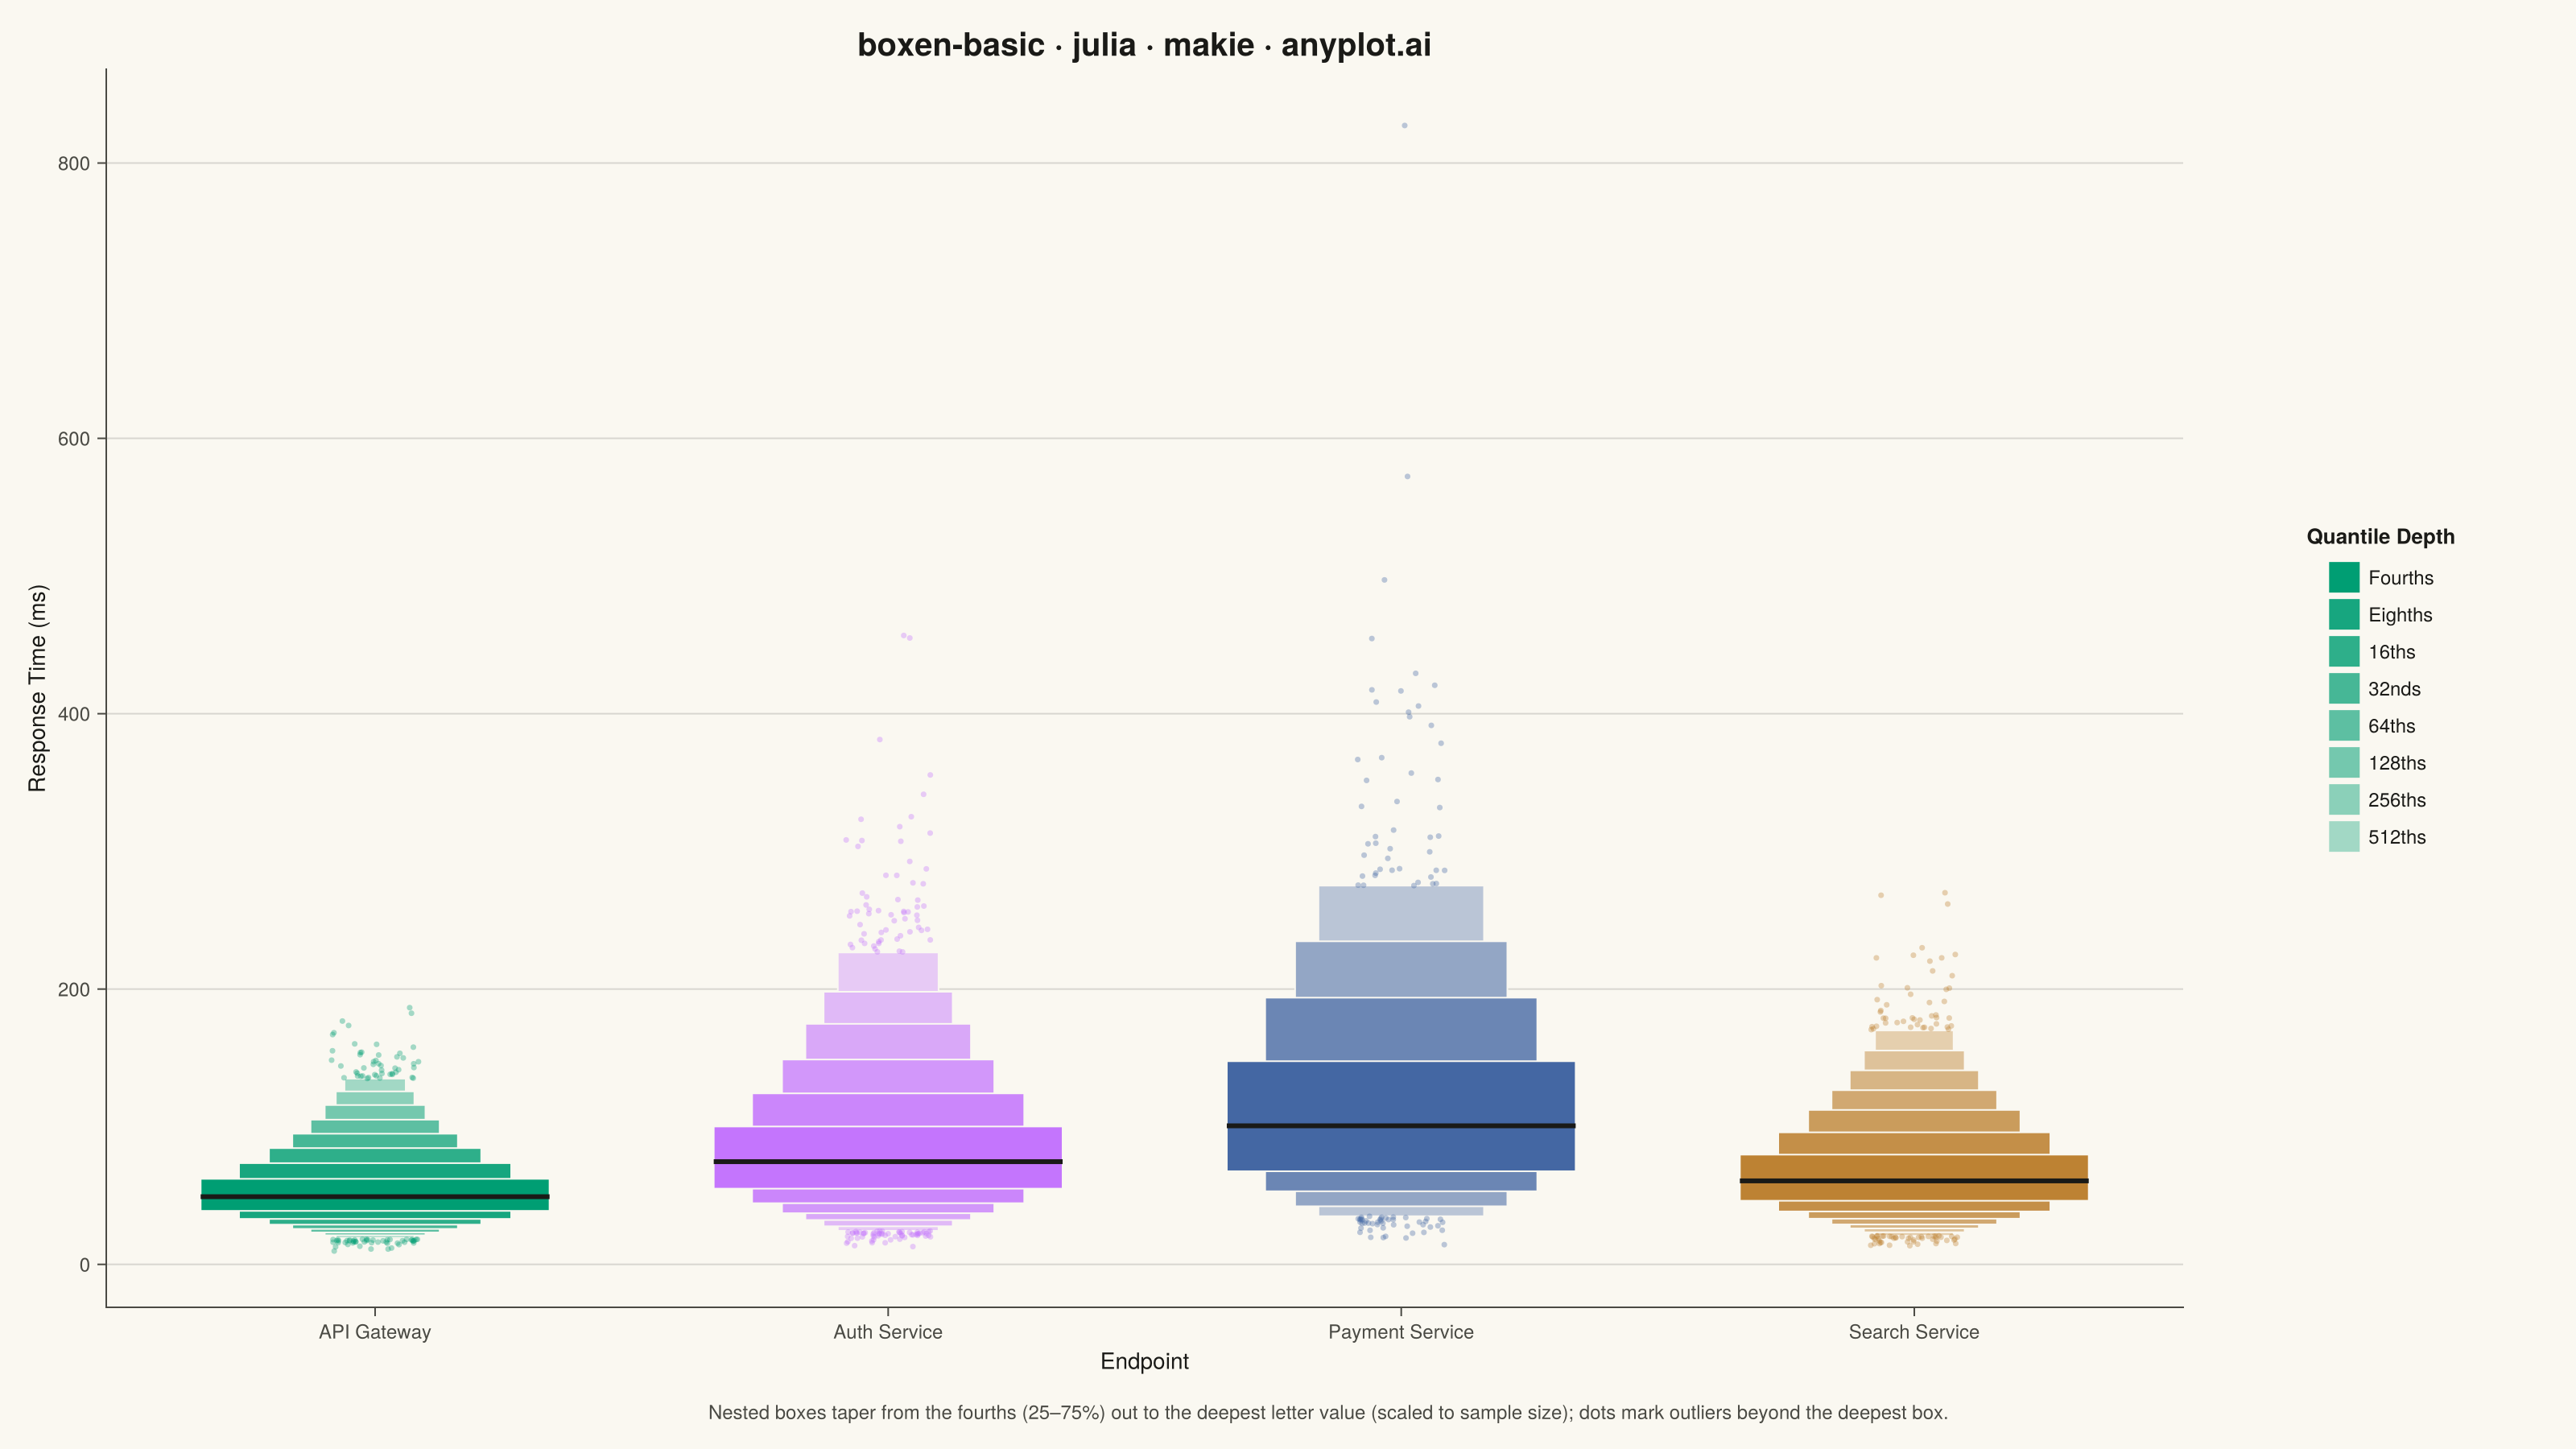
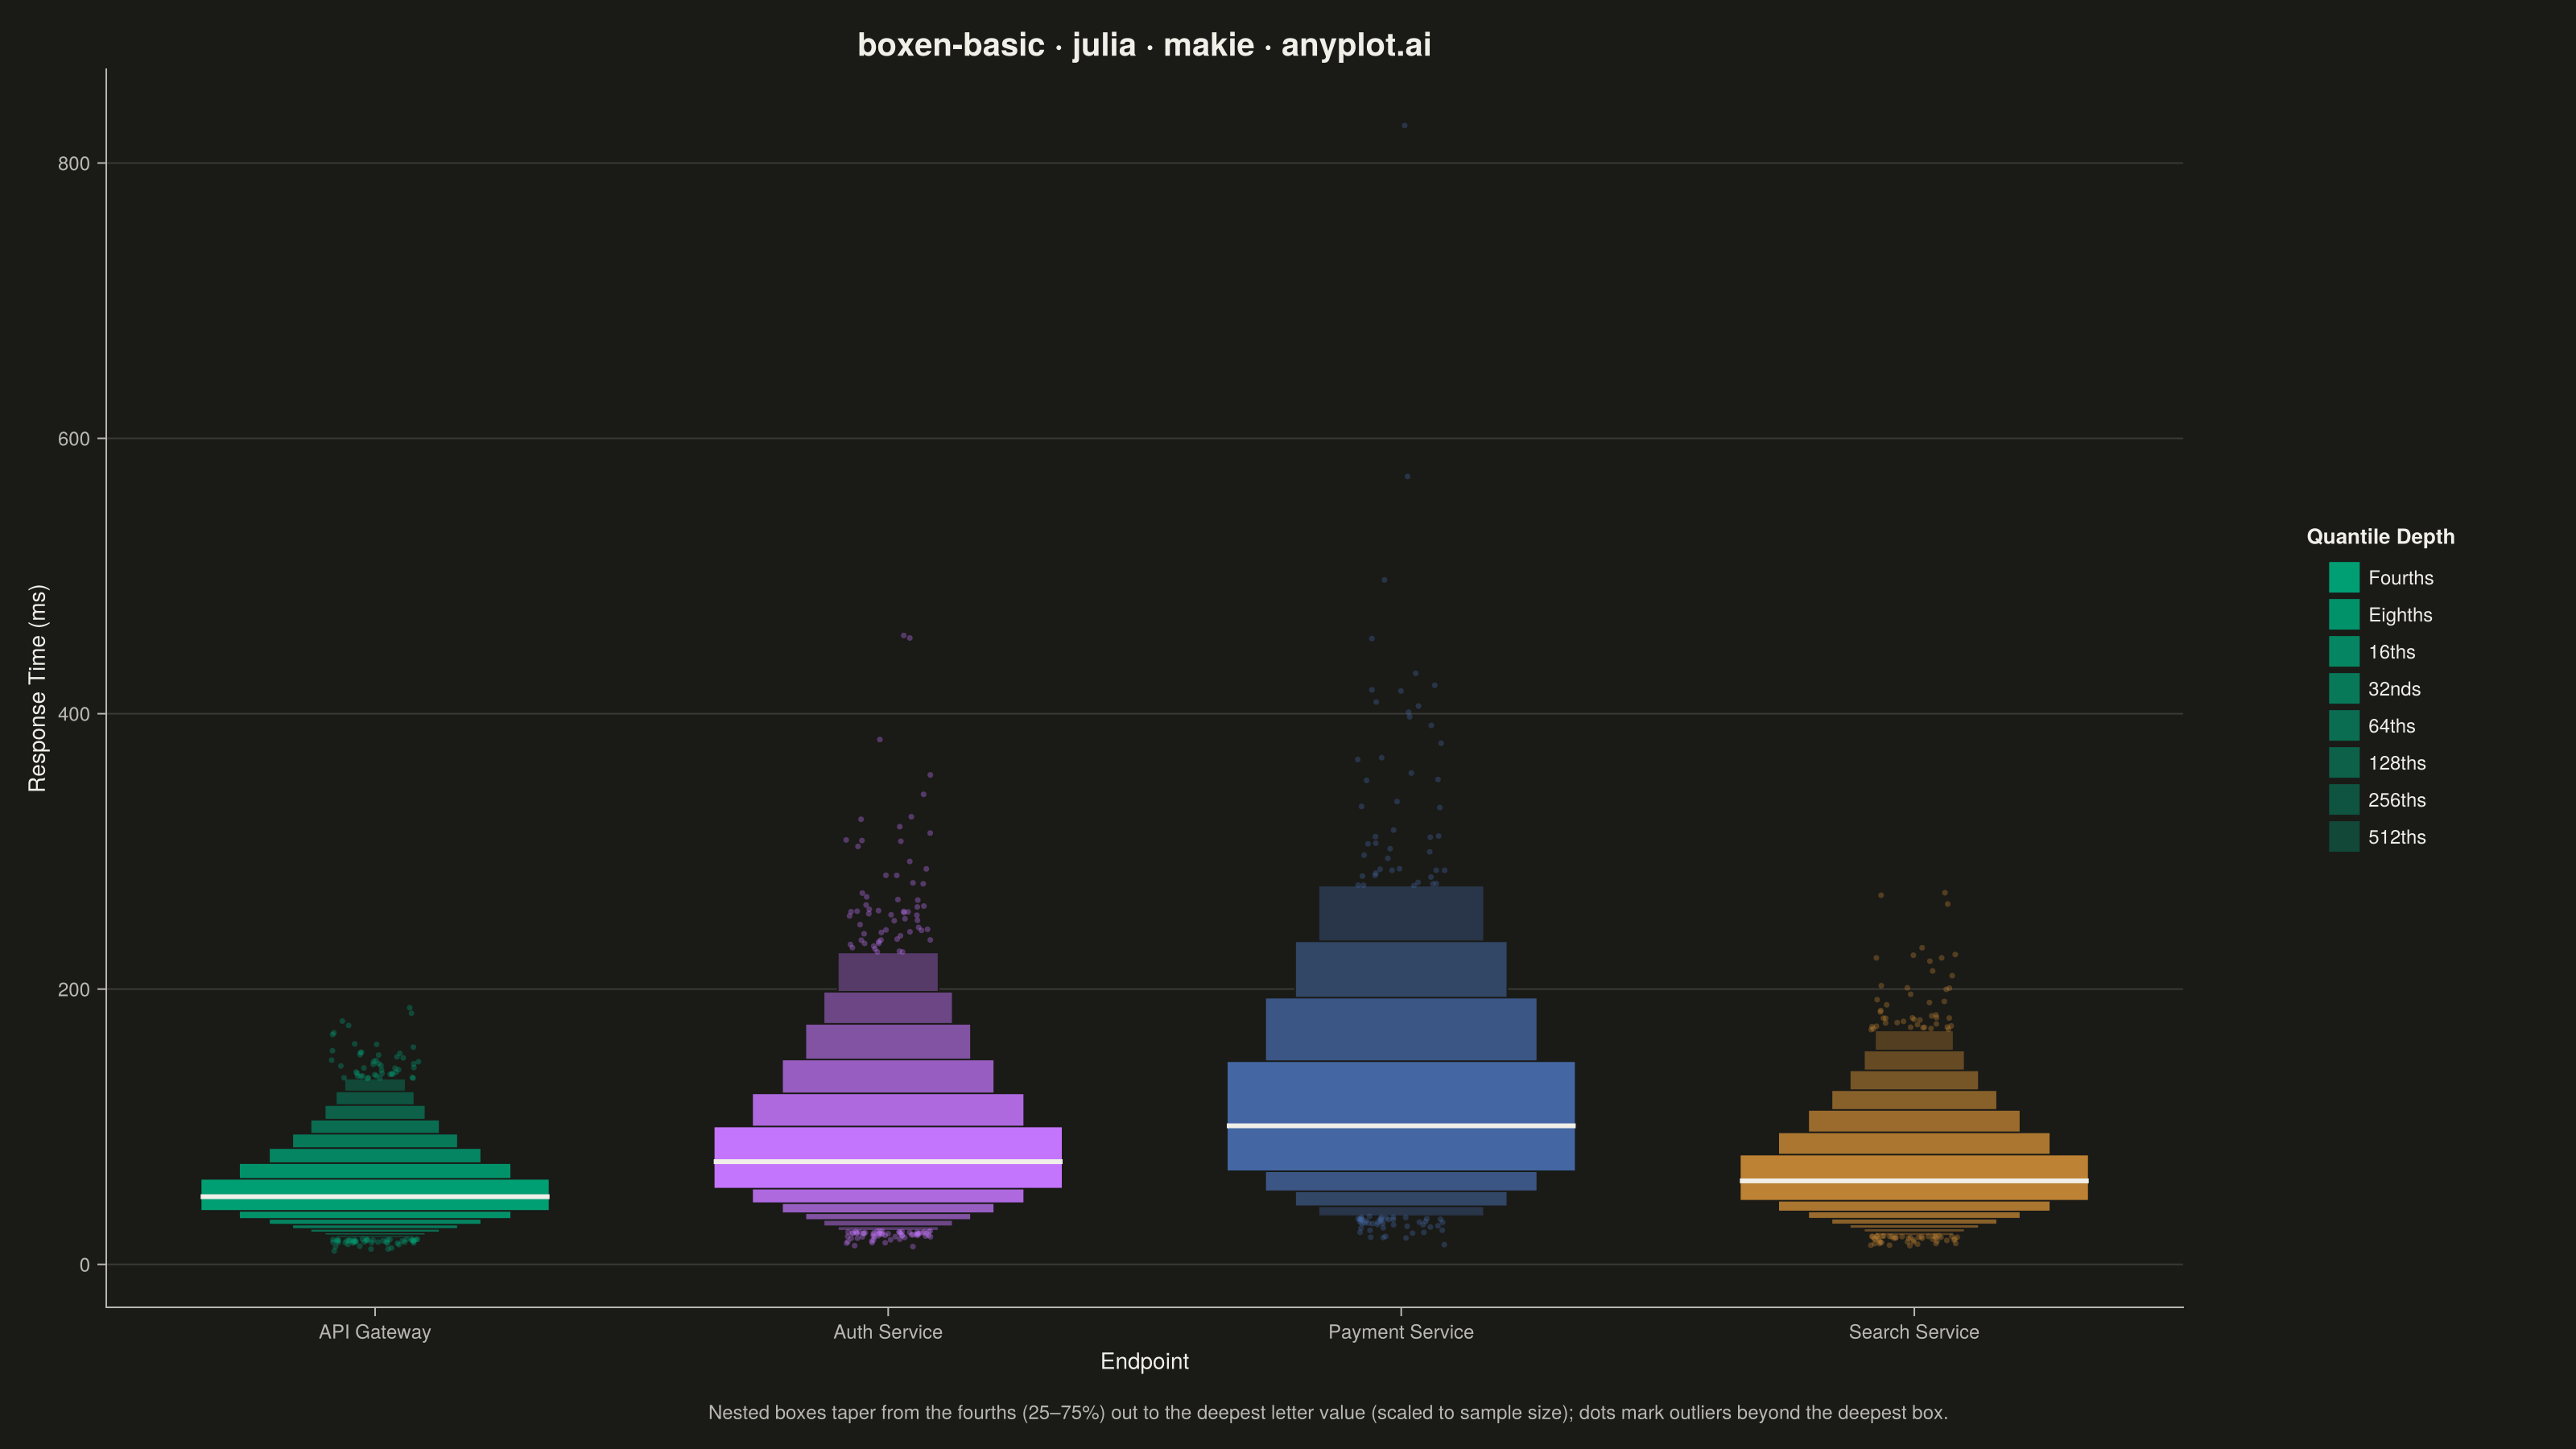
A boxen plot (also known as letter-value plot) extends the traditional box plot to show more quantile information, making it ideal for large datasets with 1000+ observations. Instead of just displaying the median and quartiles, it shows additional "letter values" (eighths, sixteenths, etc.) as nested boxes, revealing the full shape of the distribution including tail behavior. This makes outlier detection more meaningful and distribution comparison more detailed.
# anyplot.ai
# boxen-basic: Basic Boxen Plot (Letter-Value Plot)
# Library: makie 0.21.9 | Julia 1.11.9
# Quality: 89/100 | Created: 2026-09-01

using CairoMakie
using Colors
using Random
using Statistics

Random.seed!(42)

# --- Theme tokens -----------------------------------------------------------
const THEME    = get(ENV, "ANYPLOT_THEME", "light")
const PAGE_BG  = THEME == "light" ? colorant"#FAF8F1" : colorant"#1A1A17"
const INK      = THEME == "light" ? colorant"#1A1A17" : colorant"#F0EFE8"
const INK_SOFT = THEME == "light" ? colorant"#4A4A44" : colorant"#B8B7B0"
const IMPRINT_PALETTE = [
    colorant"#009E73", colorant"#C475FD", colorant"#4467A3", colorant"#BD8233",
]

# --- Data --------------------------------------------------------------------
# Response-time distributions (ms) across server endpoints, right-skewed
# (log-normal) as is typical for latency data at high request volumes.
# Traffic volume varies sharply by endpoint (25k req for the public gateway
# down to 1.5k for the low-traffic payment path) so letter-value depth below
# actually spans its full range instead of clamping at the ceiling.
endpoints = ["API Gateway", "Auth Service", "Payment Service", "Search Service"]
n_points  = [25000, 8000, 1500, 12000]
mu        = [3.9, 4.3, 4.6, 4.1]
sigma     = [0.35, 0.45, 0.55, 0.40]
response_times = [exp.(randn(n_points[j]) .* sigma[j] .+ mu[j]) for j in eachindex(endpoints)]

# --- Letter values (Tukey) ---------------------------------------------------
# Level i covers the central probability mass [2^-(i+1), 1 - 2^-(i+1)]:
# i=1 -> fourths (quartiles), i=2 -> eighths, i=3 -> sixteenths, and so on.
# Depth scales with sample size: Payment Service's ~1.5k points stop at 4
# levels while API Gateway's 25k points reach the 8-level ceiling.
letter_value_depth(n) = clamp(floor(Int, log2(n)) - 6, 3, 8)
LEVEL_NAMES = ["Fourths", "Eighths", "16ths", "32nds", "64ths", "128ths", "256ths", "512ths"]

function letter_values(values, k)
    lo = Vector{Float64}(undef, k)
    hi = Vector{Float64}(undef, k)
    for i in 1:k
        p = 2.0^(-(i + 1))
        lo[i] = quantile(values, p)
        hi[i] = quantile(values, 1 - p)
    end
    lo, hi
end

# --- Plot ---------------------------------------------------------------------
fig = Figure(
    size            = (1600, 900),
    fontsize        = 14,
    backgroundcolor = PAGE_BG,
)

ax = Axis(
    fig[1, 1];
    title              = "boxen-basic · julia · makie · anyplot.ai",
    titlesize          = 20,
    titlecolor         = INK,
    xlabel             = "Endpoint",
    ylabel             = "Response Time (ms)",
    xlabelsize         = 14,
    ylabelsize         = 14,
    xlabelcolor        = INK,
    ylabelcolor        = INK,
    xticklabelsize     = 12,
    yticklabelsize     = 12,
    xticklabelcolor    = INK_SOFT,
    yticklabelcolor    = INK_SOFT,
    xtickcolor         = INK_SOFT,
    ytickcolor         = INK_SOFT,
    backgroundcolor    = PAGE_BG,
    topspinevisible    = false,
    rightspinevisible  = false,
    leftspinecolor     = INK_SOFT,
    bottomspinecolor   = INK_SOFT,
    xgridvisible       = false,
    ygridcolor         = RGBAf(INK.r, INK.g, INK.b, 0.15),
    xticks             = (1:length(endpoints), endpoints),
)

base_half_width = 0.34
shrink          = 0.78
outlier_alpha   = 0.35

for (j, name) in enumerate(endpoints)
    values = response_times[j]
    color  = IMPRINT_PALETTE[j]
    k      = letter_value_depth(length(values))
    lo, hi = letter_values(values, k)

    # Nested boxes, widest (i=1, fourths) drawn last so it sits on top of the
    # taller-but-narrower outer boxes — the classic tapering boxen silhouette.
    for i in k:-1:1
        half_width = base_half_width * shrink^(i - 1)
        shade_t    = (i - 1) / max(k - 1, 1) * 0.65
        fill_color = weighted_color_mean(1 - shade_t, color, PAGE_BG)
        poly!(
            ax,
            Rect2f(j - half_width, lo[i], 2 * half_width, hi[i] - lo[i]);
            color       = fill_color,
            strokewidth = 1,
            strokecolor = PAGE_BG,
        )
    end

    # Median line across the widest (fourths) box
    median_val = median(values)
    lines!(
        ax,
        [j - base_half_width, j + base_half_width], [median_val, median_val];
        color     = INK,
        linewidth = 3.0,
    )

    # Outliers beyond the deepest letter value
    lo_deep, hi_deep = lo[k], hi[k]
    outliers = filter(v -> v < lo_deep || v > hi_deep, values)
    if !isempty(outliers)
        jitter = (rand(length(outliers)) .- 0.5) .* (base_half_width * 0.5)
        scatter!(
            ax, fill(j, length(outliers)) .+ jitter, outliers;
            color       = RGBAf(color.r, color.g, color.b, outlier_alpha),
            markersize  = 5,
            strokewidth = 0,
        )
    end
end

# Depth legend: swatch strip mapping shade darkness to letter-value level,
# built with the same weighted_color_mean ramp used for the boxes so the
# legend colors match the plot exactly. Uses the deepest category (API
# Gateway, k = max_k) as the reference hue.
max_k = maximum(letter_value_depth(n) for n in n_points)
legend_elems = [
    PolyElement(
        color       = weighted_color_mean(1 - (i - 1) / max(max_k - 1, 1) * 0.65, IMPRINT_PALETTE[1], PAGE_BG),
        strokecolor = PAGE_BG,
        strokewidth = 1,
    )
    for i in 1:max_k
]
Legend(
    fig[1, 2],
    legend_elems,
    LEVEL_NAMES[1:max_k],
    "Quantile Depth";
    labelcolor      = INK,
    titlecolor      = INK,
    labelsize       = 12,
    titlesize       = 13,
    framevisible    = false,
    backgroundcolor = PAGE_BG,
    tellheight      = false,
)

Label(
    fig[2, 1:2],
    "Nested boxes taper from the fourths (25–75%) out to the deepest letter value " *
    "(scaled to sample size); dots mark outliers beyond the deepest box.";
    fontsize = 12,
    color    = INK_SOFT,
)

colsize!(fig.layout, 2, Relative(0.14))
rowsize!(fig.layout, 2, Auto(0.08))

# --- Save ----------------------------------------------------------------------
save("plot-$(THEME).png", fig; px_per_unit = 2)
Runnable source as JSON, for any HTTP client: https://api.anyplot.ai/specs/boxen-basic/makie/code. Any spec id and library id listed in llms-full.txt fit the same URL shape; every URL below is complete and callable.
{
  "spec_id": "boxen-basic",
  "language": "julia",
  "library": "makie",
  "page": "https://anyplot.ai/boxen-basic/julia/makie",
  "hub": "https://anyplot.ai/boxen-basic",
  "code_json": "https://api.anyplot.ai/specs/boxen-basic/makie/code",
  "spec_json": "https://api.anyplot.ai/specs/boxen-basic",
  "render_light_png": "https://storage.googleapis.com/anyplot-images/plots/boxen-basic/julia/makie/plot-light.png",
  "render_dark_png": "https://storage.googleapis.com/anyplot-images/plots/boxen-basic/julia/makie/plot-dark.png",
  "quality_score": 89.0,
  "license": "MIT",
  "guide": "https://anyplot.ai/llms.txt"
}
Part of Basic Boxen Plot (Letter-Value Plot) on anyplot.ai.