The same plot in 14 other libraries — JavaScript: Chart.js, D3.js, Highcharts, MUI X Charts; Python: Altair, Bokeh, lets-plot, Matplotlib, Plotly, plotnine, Pygal, Seaborn; R: ggplot2; Julia: Makie.jl. Compare all 15 side by side: Basic Boxen Plot (Letter-Value Plot) in Python, R, Julia and JavaScript.
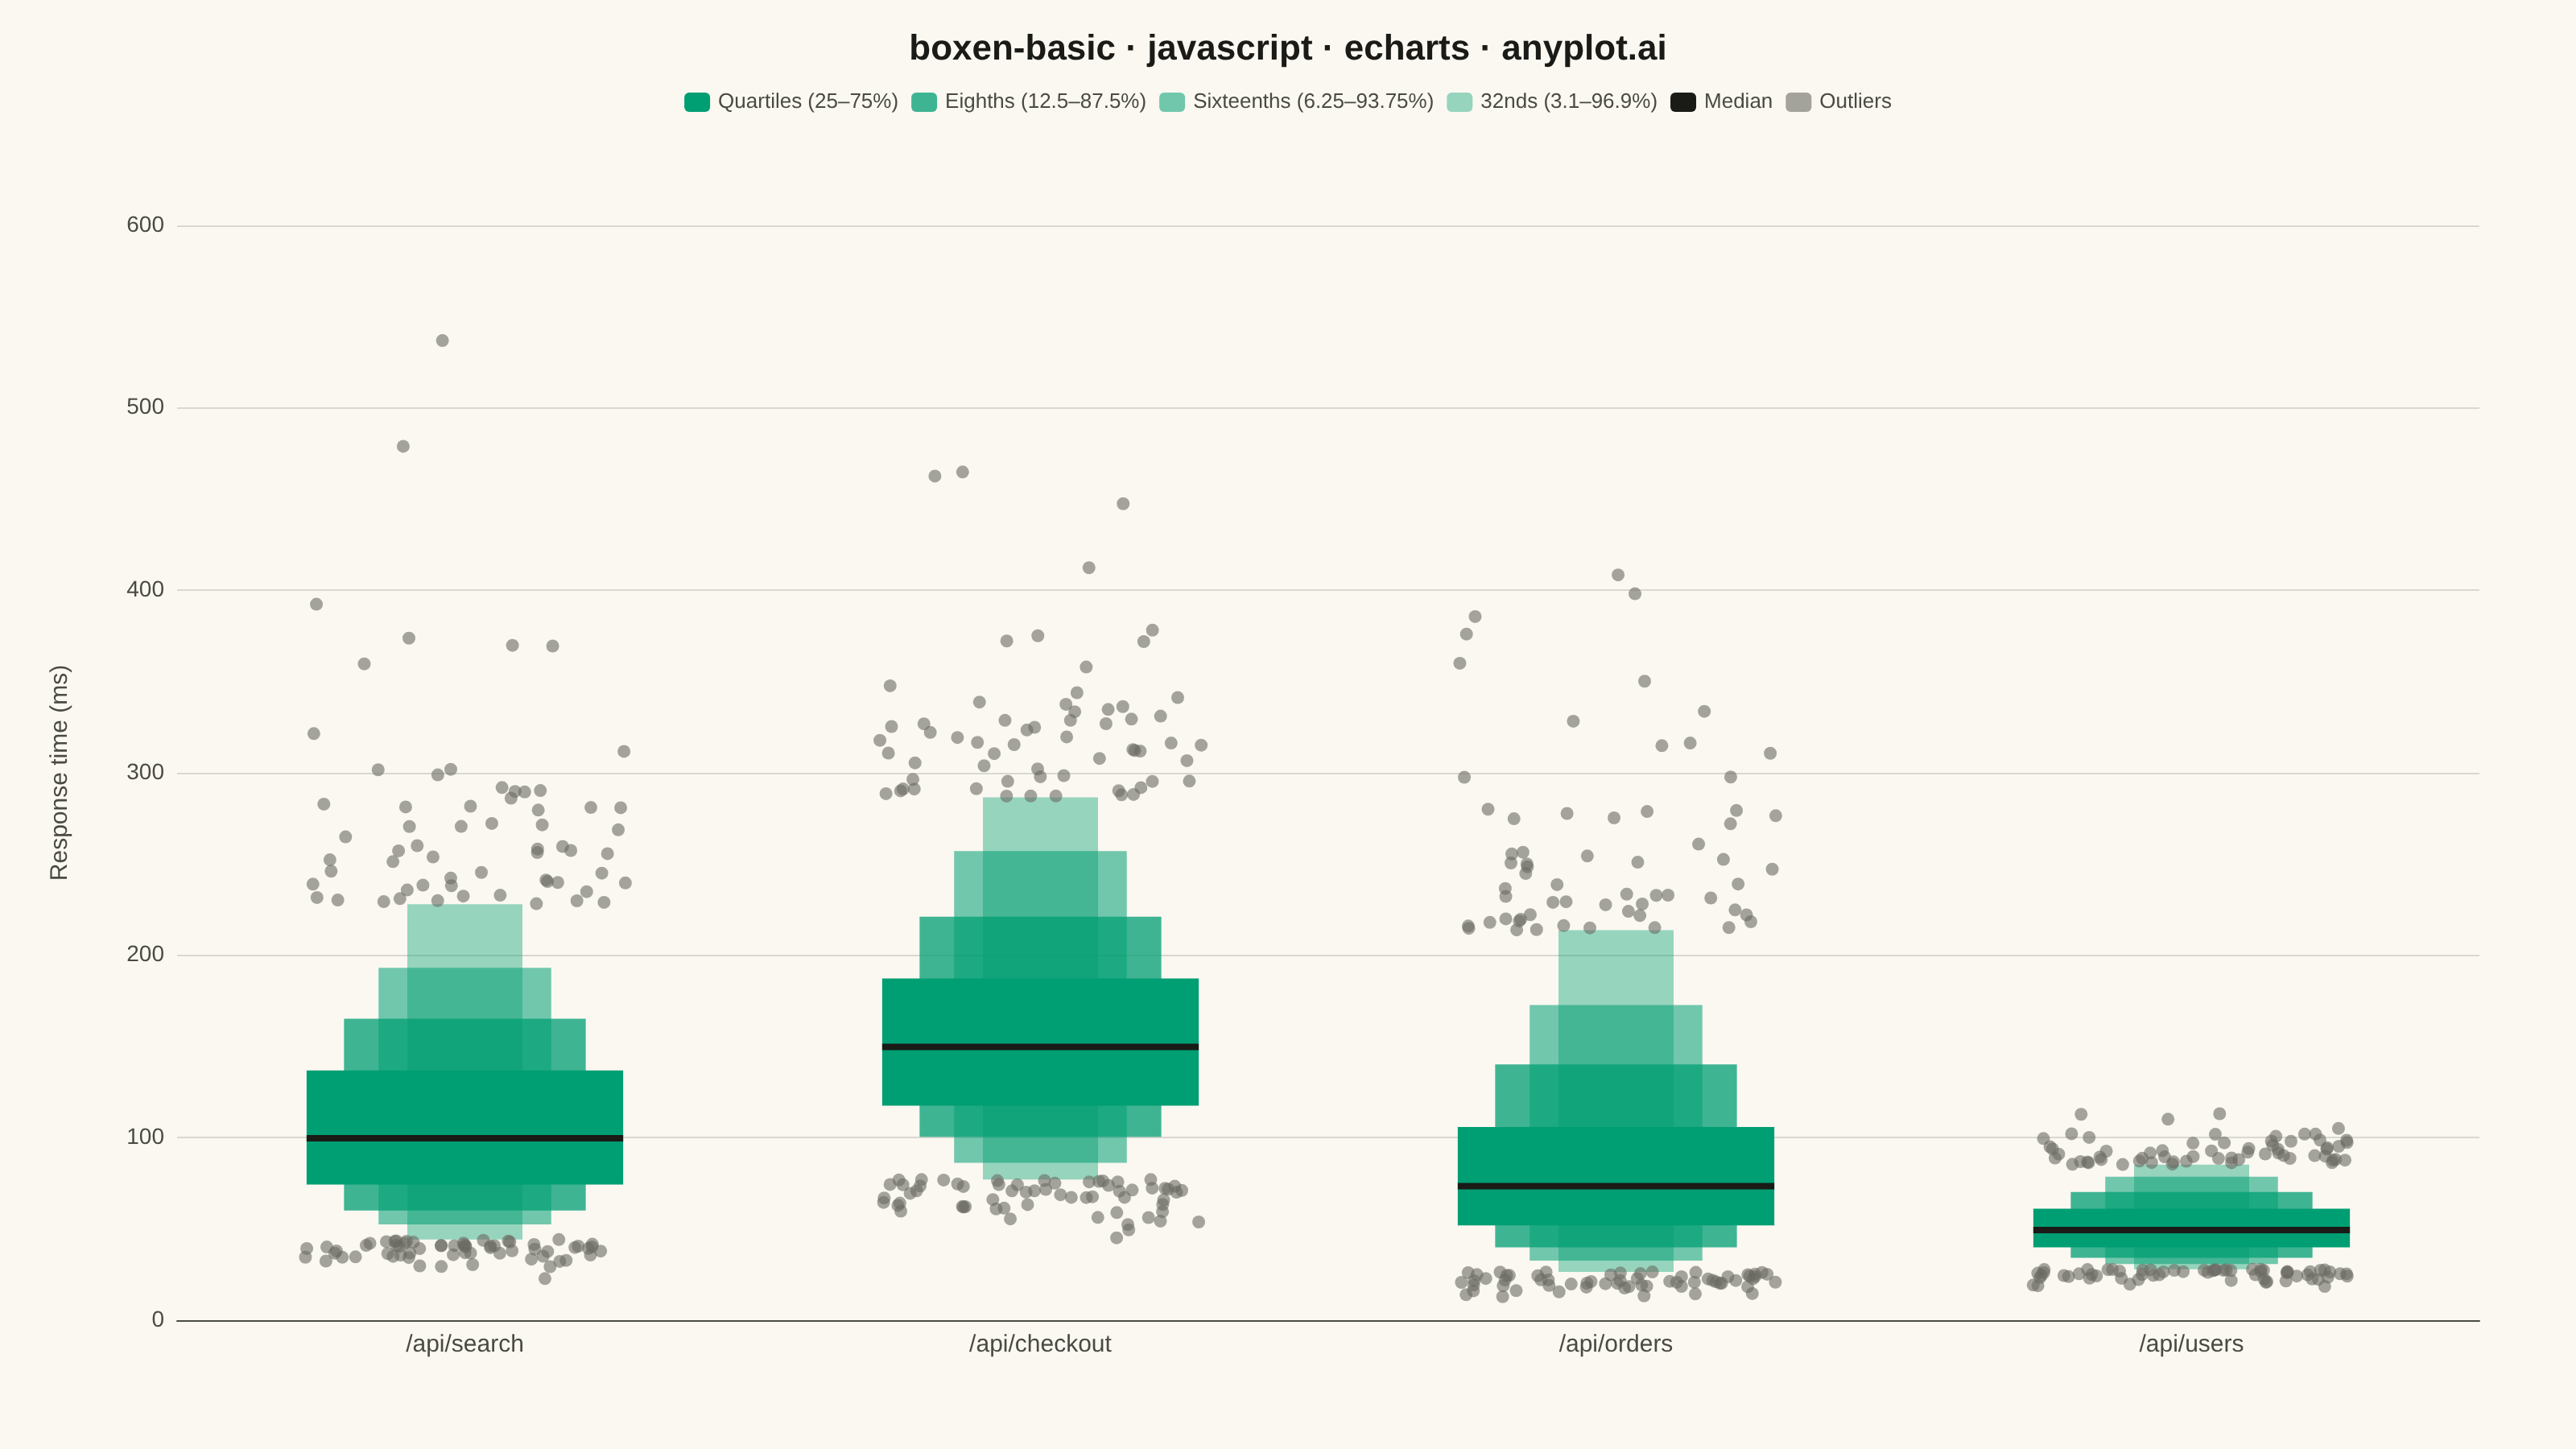
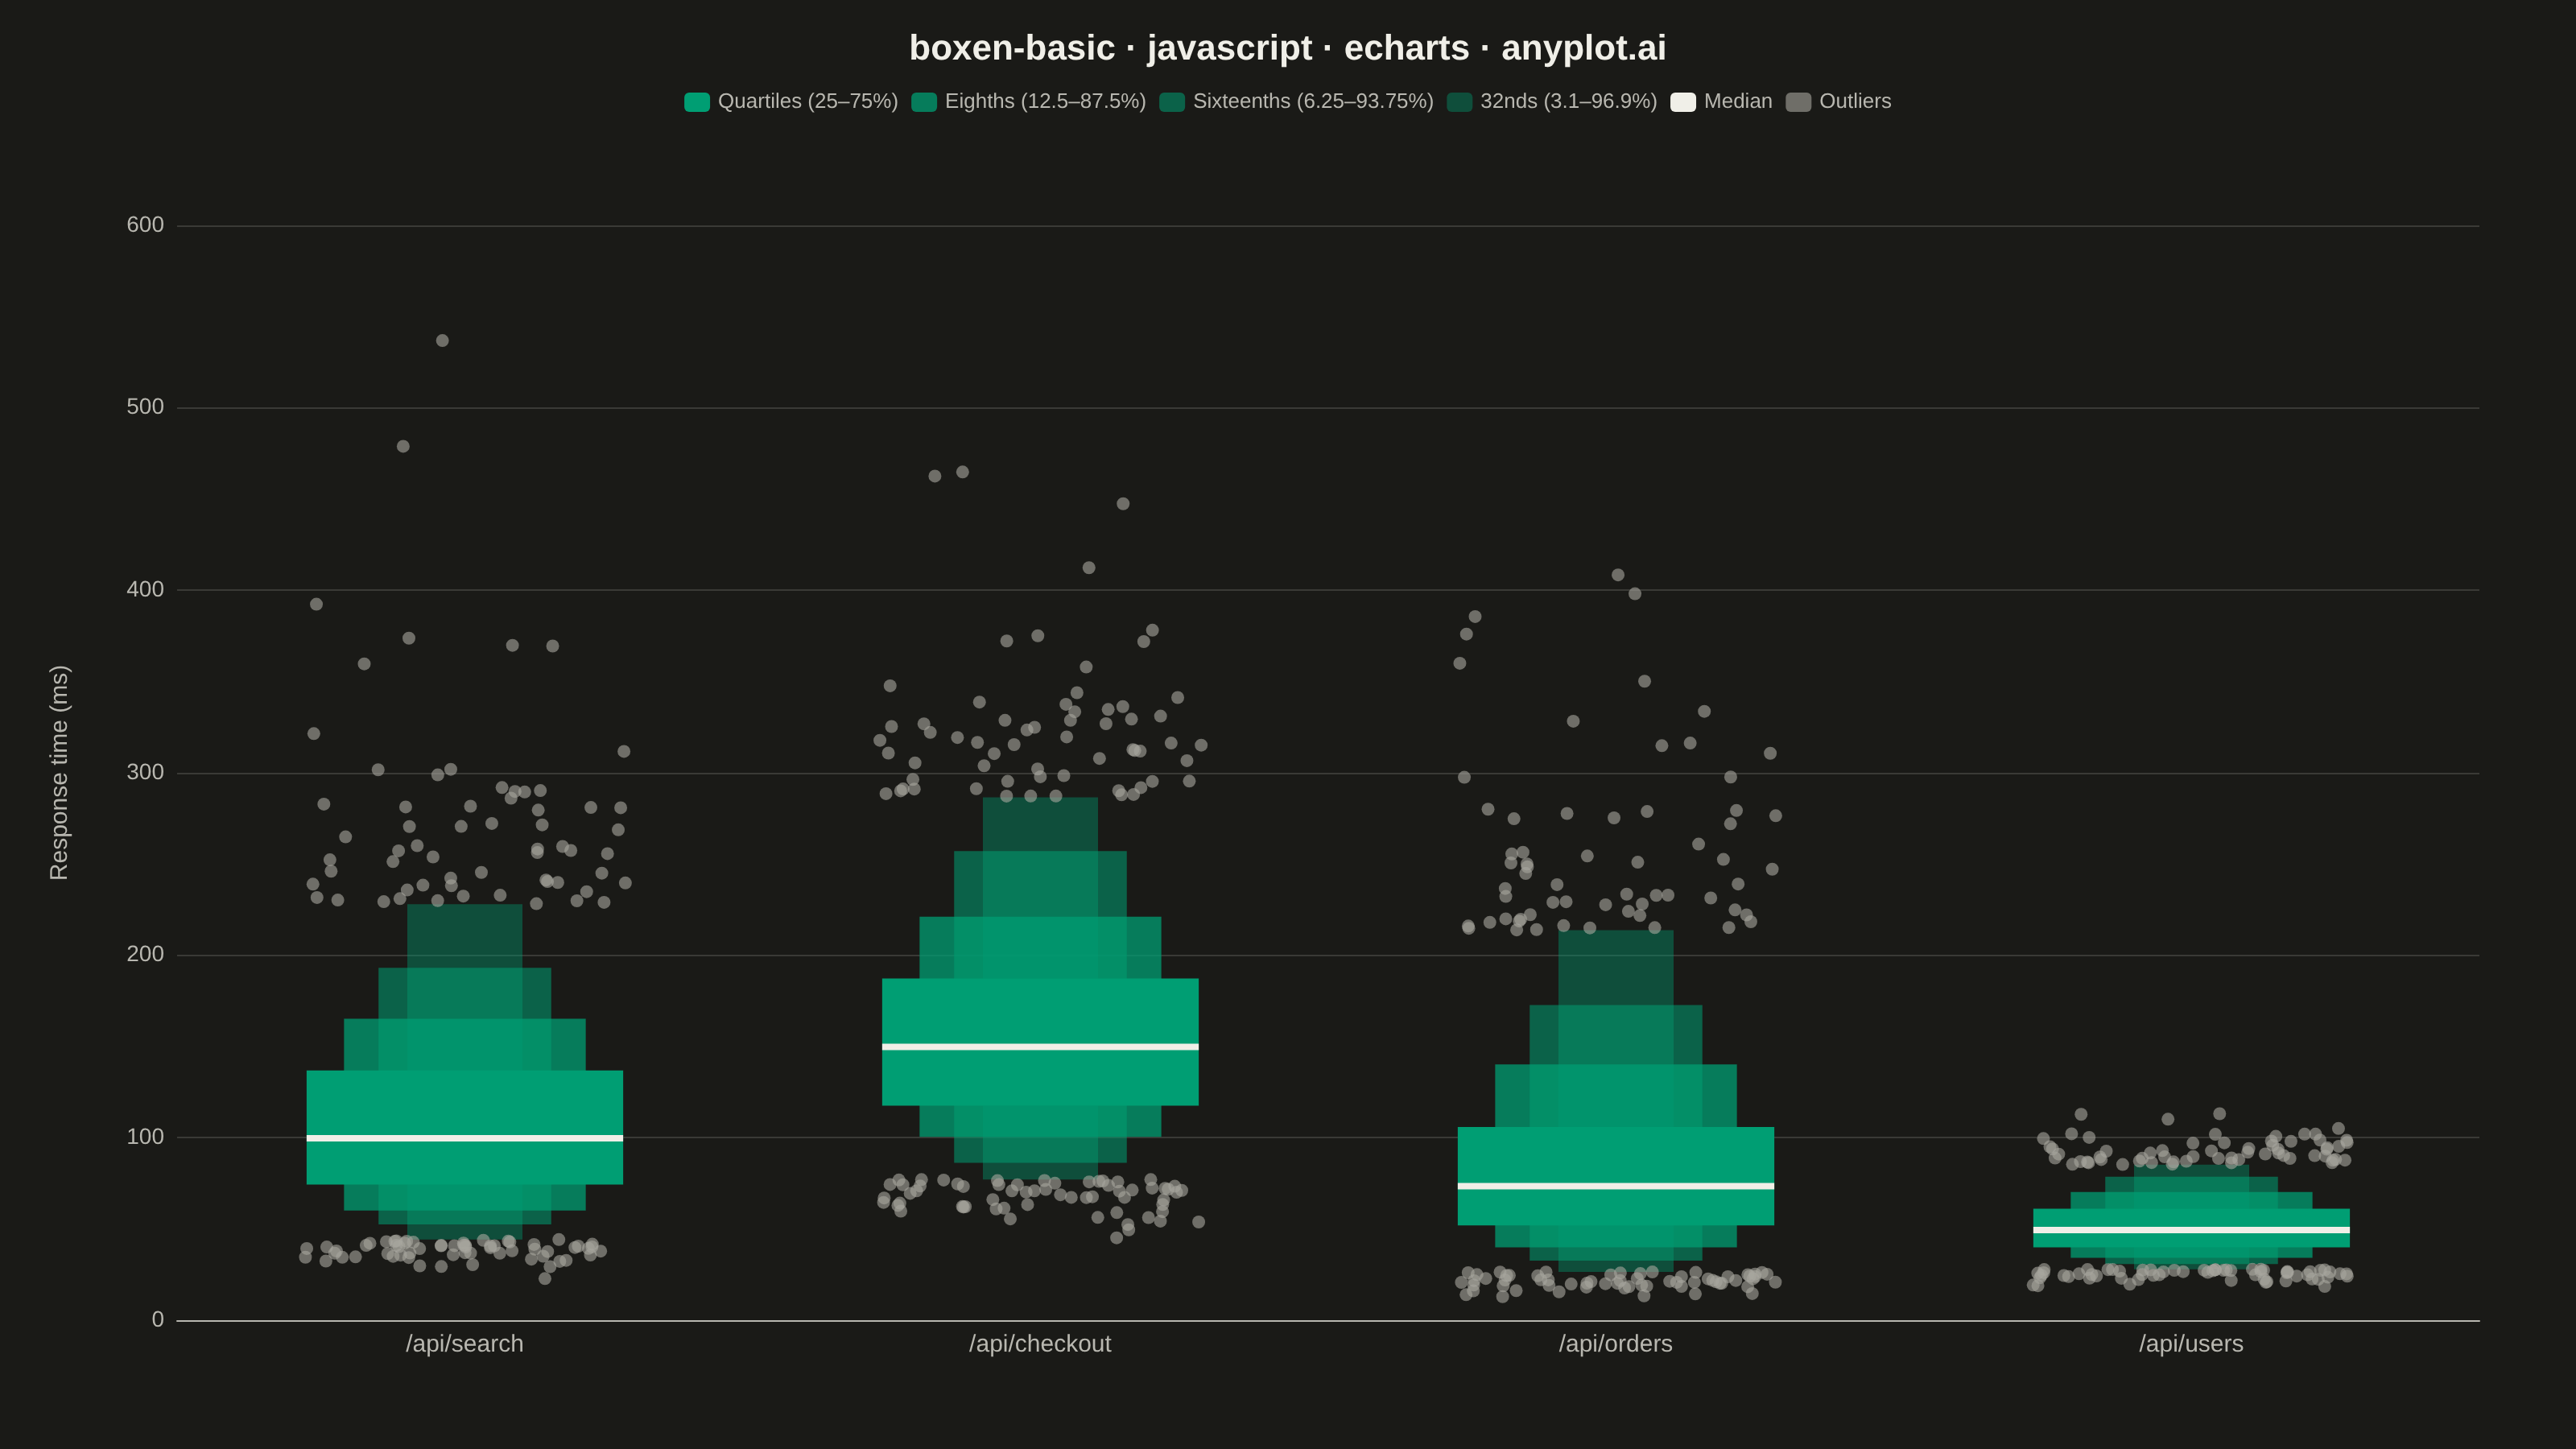
A boxen plot (also known as letter-value plot) extends the traditional box plot to show more quantile information, making it ideal for large datasets with 1000+ observations. Instead of just displaying the median and quartiles, it shows additional "letter values" (eighths, sixteenths, etc.) as nested boxes, revealing the full shape of the distribution including tail behavior. This makes outlier detection more meaningful and distribution comparison more detailed.
// anyplot.ai
// boxen-basic: Basic Boxen Plot (Letter-Value Plot)
// Library: echarts 6.1.0 | JavaScript 22.23.2
// Quality: 92/100 | Created: 2026-09-01

const t = window.ANYPLOT_TOKENS;
const THEME = window.ANYPLOT_THEME === "dark" ? "dark" : "light";
const INK_MUTED = THEME === "dark" ? "#A8A79F" : "#6B6A63"; // Imprint "muted" anchor — theme-adaptive, not in ANYPLOT_TOKENS

// --- Deterministic PRNG (LCG + Box-Muller) -----------------------------------
function makeLcg(seed) {
  let state = seed;
  return function lcg() {
    state = (state * 1664525 + 1013904223) % 4294967296;
    return state / 4294967296;
  };
}
function randNormal(rand) {
  const u1 = Math.max(rand(), 1e-9);
  const u2 = rand();
  return Math.sqrt(-2 * Math.log(u1)) * Math.cos(2 * Math.PI * u2);
}

// --- Data: response times (ms) per API endpoint, right-skewed --------------
const endpoints = [
  { name: "/api/search", mu: 4.6, sigma: 0.45 },
  { name: "/api/checkout", mu: 5.0, sigma: 0.35 },
  { name: "/api/orders", mu: 4.3, sigma: 0.55 },
  { name: "/api/users", mu: 3.9, sigma: 0.3 },
];
const N = 2000;
const rand = makeLcg(42);
const datasets = endpoints.map(({ mu, sigma }) => {
  const values = [];
  for (let i = 0; i < N; i++) {
    values.push(Math.exp(mu + sigma * randNormal(rand)));
  }
  values.sort((a, b) => a - b);
  return values;
});

// --- Letter-value statistics --------------------------------------------------
// 4 nested levels (quartiles -> 32nds) is enough to reveal tail shape without
// crowding the legend; deeper levels would add boxes too thin to read at this size.
const LEVEL_META = [
  { label: "Quartiles (25–75%)", widthFrac: 0.55, opacity: 1.0 },
  { label: "Eighths (12.5–87.5%)", widthFrac: 0.42, opacity: 0.75 },
  { label: "Sixteenths (6.25–93.75%)", widthFrac: 0.3, opacity: 0.55 },
  { label: "32nds (3.1–96.9%)", widthFrac: 0.2, opacity: 0.4 },
];
const LEVEL_COUNT = LEVEL_META.length;

function letterValues(sorted) {
  const n = sorted.length;
  const medianDepth = (n + 1) / 2;
  const median =
    n % 2 === 0
      ? (sorted[n / 2 - 1] + sorted[n / 2]) / 2
      : sorted[Math.floor(medianDepth) - 1];
  const levels = [];
  let depth = medianDepth;
  for (let k = 0; k < LEVEL_COUNT; k++) {
    depth = (Math.floor(depth) + 1) / 2;
    const lowIdx = Math.max(0, Math.floor(depth) - 1);
    const highIdx = Math.min(n - 1, n - Math.floor(depth));
    levels.push({ low: sorted[lowIdx], high: sorted[highIdx] });
  }
  return { median, levels };
}
const stats = datasets.map(letterValues);

// --- Custom-series renderItem implementations --------------------------------
function renderBox(params, api) {
  const categoryIndex = api.value(0);
  const low = api.value(1);
  const high = api.value(2);
  const widthFrac = api.value(3);
  const bandWidth = api.size([1, 0])[0];
  const boxWidth = bandWidth * widthFrac;
  const lowPoint = api.coord([categoryIndex, low]);
  const highPoint = api.coord([categoryIndex, high]);
  return {
    type: "rect",
    shape: {
      x: lowPoint[0] - boxWidth / 2,
      y: highPoint[1],
      width: boxWidth,
      height: Math.max(lowPoint[1] - highPoint[1], 1),
    },
    style: api.style(),
  };
}
function renderMedian(params, api) {
  const categoryIndex = api.value(0);
  const value = api.value(1);
  const widthFrac = api.value(2);
  const bandWidth = api.size([1, 0])[0];
  const boxWidth = bandWidth * widthFrac;
  const center = api.coord([categoryIndex, value]);
  const thickness = 4;
  return {
    type: "rect",
    shape: {
      x: center[0] - boxWidth / 2,
      y: center[1] - thickness / 2,
      width: boxWidth,
      height: thickness,
    },
    style: api.style(),
  };
}
function renderOutlier(params, api) {
  const categoryIndex = api.value(0);
  const value = api.value(1);
  const jitter = api.value(2);
  const bandWidth = api.size([1, 0])[0];
  const center = api.coord([categoryIndex, value]);
  return {
    type: "circle",
    shape: { cx: center[0] + jitter * bandWidth * 0.28, cy: center[1], r: 4 },
    style: api.style(),
  };
}

// --- Series data ---------------------------------------------------------------
// Boxes are pushed narrowest-first so the widest (quartile) box paints last and
// sits on top, producing the classic stepped/nested letter-value silhouette.
const boxSeries = [];
for (let levelIdx = LEVEL_COUNT - 1; levelIdx >= 0; levelIdx--) {
  const meta = LEVEL_META[levelIdx];
  boxSeries.push({
    name: meta.label,
    type: "custom",
    renderItem: renderBox,
    itemStyle: { color: t.palette[0], opacity: meta.opacity },
    data: stats.map((s, catIdx) => [
      catIdx,
      s.levels[levelIdx].low,
      s.levels[levelIdx].high,
      meta.widthFrac,
    ]),
    tooltip: {
      formatter: (p) =>
        `${endpoints[p.value[0]].name}<br/>${meta.label}: ${p.value[1].toFixed(0)}–${p.value[2].toFixed(0)} ms`,
    },
  });
}
const medianSeries = {
  name: "Median",
  type: "custom",
  renderItem: renderMedian,
  itemStyle: { color: t.ink },
  data: stats.map((s, catIdx) => [catIdx, s.median, LEVEL_META[0].widthFrac]),
  tooltip: {
    formatter: (p) => `${endpoints[p.value[0]].name}<br/>Median: ${p.value[1].toFixed(0)} ms`,
  },
};
const outlierPoints = [];
datasets.forEach((sorted, catIdx) => {
  const outerLevel = stats[catIdx].levels[LEVEL_COUNT - 1];
  sorted.forEach((value) => {
    if (value < outerLevel.low || value > outerLevel.high) {
      outlierPoints.push([catIdx, value, rand() * 2 - 1]);
    }
  });
});
const outlierSeries = {
  name: "Outliers",
  type: "custom",
  renderItem: renderOutlier,
  itemStyle: { color: INK_MUTED, opacity: 0.6 },
  data: outlierPoints,
  tooltip: {
    formatter: (p) => `${endpoints[p.value[0]].name}<br/>${p.value[1].toFixed(0)} ms`,
  },
};

// --- Init ------------------------------------------------------------------
const chart = echarts.init(document.getElementById("container"));

// --- Option ------------------------------------------------------------------
chart.setOption({
  animation: false,
  backgroundColor: "transparent",
  title: {
    text: "boxen-basic · javascript · echarts · anyplot.ai",
    left: "center",
    textStyle: { color: t.ink, fontSize: 22 },
  },
  legend: {
    top: 52,
    data: [...LEVEL_META.map((m) => m.label), "Median", "Outliers"],
    textStyle: { color: t.inkSoft, fontSize: 13 },
    itemWidth: 16,
    itemHeight: 12,
  },
  tooltip: { trigger: "item" },
  grid: { left: 110, right: 60, top: 140, bottom: 80 },
  xAxis: {
    type: "category",
    data: endpoints.map((e) => e.name),
    axisLabel: { color: t.inkSoft, fontSize: 15 },
    axisLine: { lineStyle: { color: t.inkSoft } },
    axisTick: { show: false },
    splitLine: { show: false },
  },
  yAxis: {
    type: "value",
    name: "Response time (ms)",
    nameLocation: "middle",
    nameGap: 65,
    nameTextStyle: { color: t.inkSoft, fontSize: 15 },
    axisLabel: { color: t.inkSoft, fontSize: 14 },
    axisLine: { show: false },
    splitLine: { lineStyle: { color: t.grid } },
  },
  series: [...boxSeries, medianSeries, outlierSeries],
});
Runnable source as JSON, for any HTTP client: https://api.anyplot.ai/specs/boxen-basic/echarts/code. Any spec id and library id listed in llms-full.txt fit the same URL shape; every URL below is complete and callable.
{
  "spec_id": "boxen-basic",
  "language": "javascript",
  "library": "echarts",
  "page": "https://anyplot.ai/boxen-basic/javascript/echarts",
  "hub": "https://anyplot.ai/boxen-basic",
  "code_json": "https://api.anyplot.ai/specs/boxen-basic/echarts/code",
  "spec_json": "https://api.anyplot.ai/specs/boxen-basic",
  "render_light_png": "https://storage.googleapis.com/anyplot-images/plots/boxen-basic/javascript/echarts/plot-light.png",
  "render_dark_png": "https://storage.googleapis.com/anyplot-images/plots/boxen-basic/javascript/echarts/plot-dark.png",
  "interactive_light_html": "https://storage.googleapis.com/anyplot-images/plots/boxen-basic/javascript/echarts/plot-light.html",
  "interactive_dark_html": "https://storage.googleapis.com/anyplot-images/plots/boxen-basic/javascript/echarts/plot-dark.html",
  "quality_score": 92.0,
  "license": "MIT",
  "guide": "https://anyplot.ai/llms.txt"
}
Part of Basic Boxen Plot (Letter-Value Plot) on anyplot.ai.