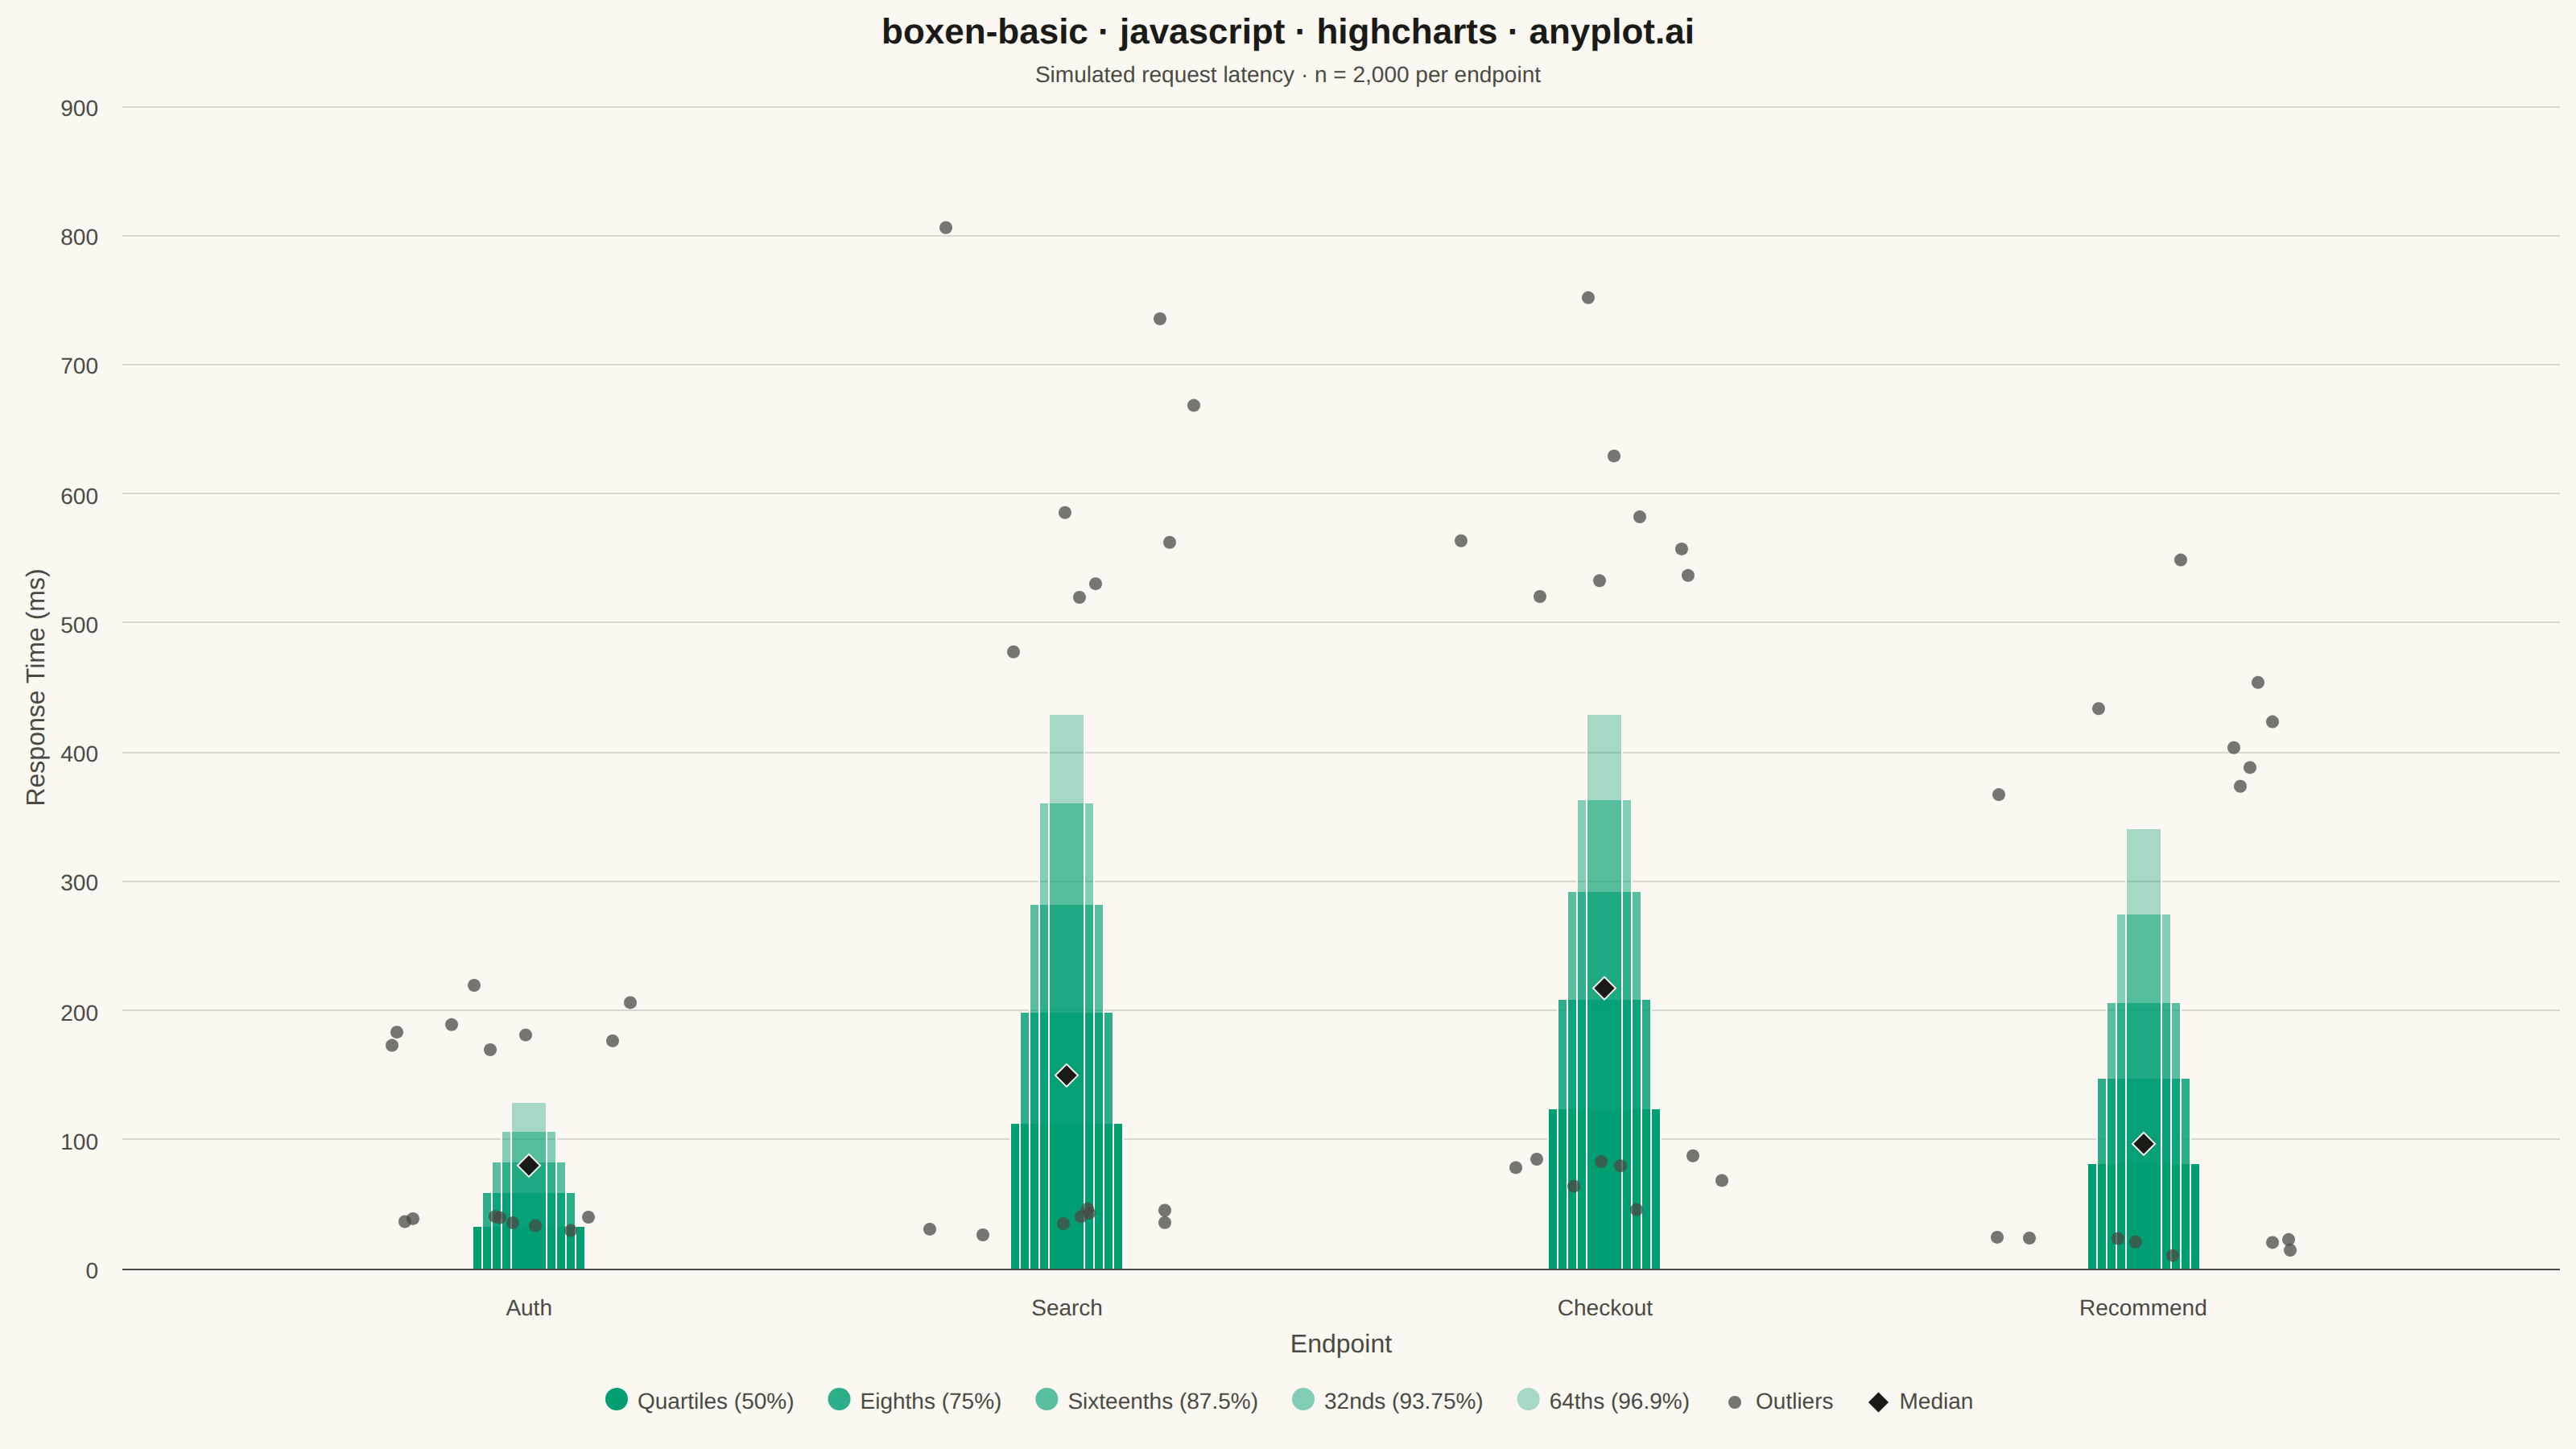
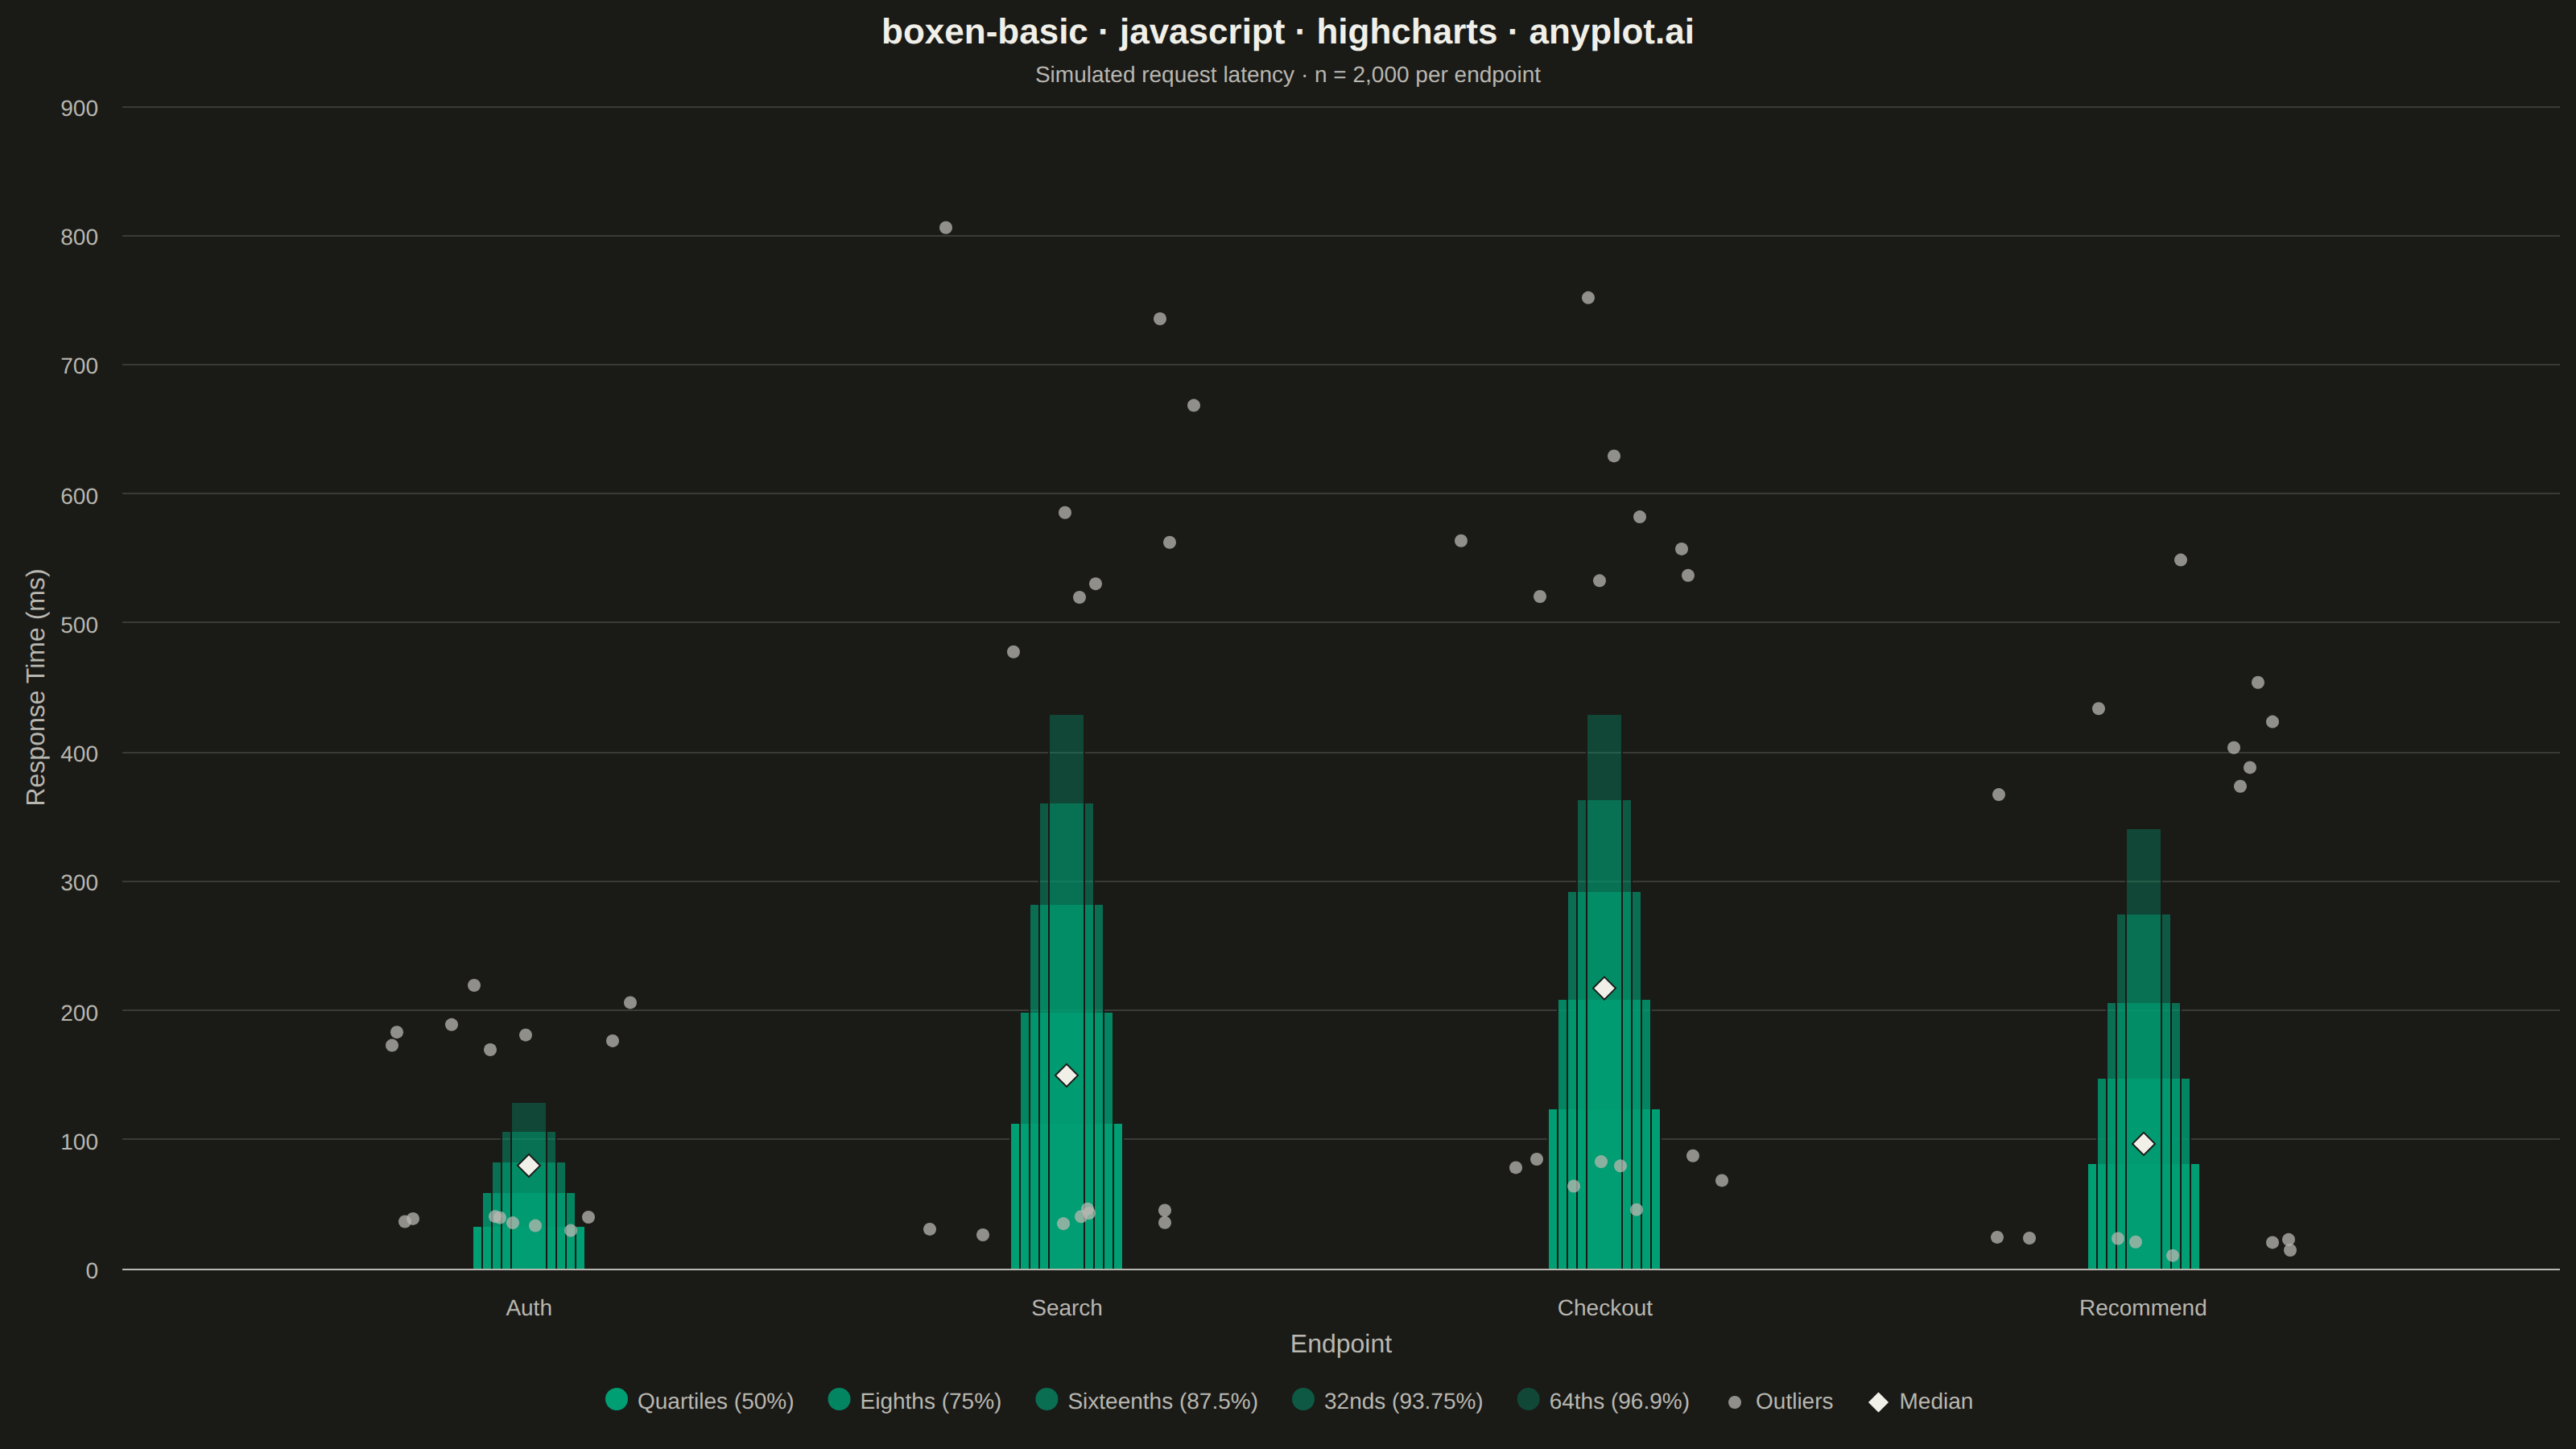
The same plot in 14 other libraries — JavaScript: Chart.js, D3.js, Apache ECharts, MUI X Charts; Python: Altair, Bokeh, lets-plot, Matplotlib, Plotly, plotnine, Pygal, Seaborn; R: ggplot2; Julia: Makie.jl. Compare all 15 side by side: Basic Boxen Plot (Letter-Value Plot) in Python, R, Julia and JavaScript.
A boxen plot (also known as letter-value plot) extends the traditional box plot to show more quantile information, making it ideal for large datasets with 1000+ observations. Instead of just displaying the median and quartiles, it shows additional "letter values" (eighths, sixteenths, etc.) as nested boxes, revealing the full shape of the distribution including tail behavior. This makes outlier detection more meaningful and distribution comparison more detailed.
// anyplot.ai
// boxen-basic: Basic Boxen Plot (Letter-Value Plot)
// Library: highcharts 12.6.0 | JavaScript 22.23.2
// Quality: 92/100 | Created: 2026-09-01

//# anyplot-orientation: landscape
const t = window.ANYPLOT_TOKENS;

// --- Deterministic PRNG (LCG) + Box-Muller normal ---------------------------
function makeRng(seed) {
  let state = seed >>> 0;
  return function uniform() {
    state = (state * 1664525 + 1013904223) >>> 0;
    return state / 4294967296;
  };
}
const rng = makeRng(20260901);
function normal() {
  const u1 = Math.max(rng(), 1e-12);
  const u2 = rng();
  return Math.sqrt(-2 * Math.log(u1)) * Math.cos(2 * Math.PI * u2);
}
function quantile(sorted, p) {
  const idx = p * (sorted.length - 1);
  const lo = Math.floor(idx);
  const hi = Math.ceil(idx);
  const frac = idx - lo;
  return sorted[lo] + (sorted[hi] - sorted[lo]) * frac;
}

// --- Data: simulated request-latency distributions per endpoint ------------
const SAMPLES_PER_ENDPOINT = 2000;
const endpoints = [
  { name: "Auth", mu: Math.log(80), sigma: 0.32 },
  { name: "Search", mu: Math.log(150), sigma: 0.55 },
  { name: "Checkout", mu: Math.log(220), sigma: 0.4 },
  { name: "Recommend", mu: Math.log(95), sigma: 0.62 },
];
const categories = endpoints.map((e) => e.name);

const distributions = endpoints.map((endpoint) => {
  const samples = [];
  for (let i = 0; i < SAMPLES_PER_ENDPOINT; i++) {
    samples.push(Math.exp(endpoint.mu + endpoint.sigma * normal()));
  }
  samples.sort((a, b) => a - b);
  return samples;
});

// Letter values: successively narrower boxes covering wider tail coverage.
const levelDefs = [
  { depth: 0.25, width: 70, opacity: 1.0, label: "Quartiles (50%)" },
  { depth: 0.125, width: 58, opacity: 0.82, label: "Eighths (75%)" },
  { depth: 0.0625, width: 46, opacity: 0.64, label: "Sixteenths (87.5%)" },
  { depth: 0.03125, width: 34, opacity: 0.48, label: "32nds (93.75%)" },
  { depth: 0.015625, width: 22, opacity: 0.34, label: "64ths (96.9%)" },
];

const deepest = levelDefs[levelDefs.length - 1];
const boxColor = t.palette[0];

function selectOutliers(sorted, lowBound, highBound, maxPerSide) {
  const below = sorted.filter((v) => v < lowBound);
  const above = sorted.filter((v) => v > highBound);
  const picked = [];
  const step = (arr) => Math.max(1, Math.ceil(arr.length / maxPerSide));
  for (let i = 0; i < below.length; i += step(below)) picked.push(below[i]);
  for (let i = 0; i < above.length; i += step(above)) picked.push(above[i]);
  return picked;
}

// --- Box series: one floating-column pair (invisible base + shaded box) ----
// per letter-value level, stacked per-category, grouping disabled so all
// levels share the same x position — narrower widths stack visually on top,
// producing the classic nested "stepped" letter-value silhouette.
const boxSeries = [];
levelDefs.forEach((level, levelIndex) => {
  const lows = distributions.map((sorted) => quantile(sorted, level.depth));
  const highs = distributions.map((sorted) => quantile(sorted, 1 - level.depth));
  boxSeries.push({
    type: "column",
    name: `${level.label} base`,
    data: lows,
    stack: `level${levelIndex}`,
    grouping: false,
    pointPlacement: 0,
    pointWidth: level.width,
    color: "transparent",
    borderWidth: 0,
    enableMouseTracking: false,
    showInLegend: false,
  });
  boxSeries.push({
    type: "column",
    name: level.label,
    data: highs.map((h, i) => h - lows[i]),
    stack: `level${levelIndex}`,
    grouping: false,
    pointPlacement: 0,
    pointWidth: level.width,
    color: Highcharts.color(boxColor).setOpacity(level.opacity).get("rgba"),
    borderWidth: 1,
    borderColor: t.pageBg,
    borderRadius: 0,
  });
});

// --- Outliers: points beyond the deepest letter value -----------------------
const outlierPoints = [];
distributions.forEach((sorted, categoryIndex) => {
  const lowBound = quantile(sorted, deepest.depth);
  const highBound = quantile(sorted, 1 - deepest.depth);
  const picked = selectOutliers(sorted, lowBound, highBound, 10);
  picked.forEach((value) => {
    outlierPoints.push({ x: categoryIndex + (rng() - 0.5) * 0.55, y: value });
  });
});

// --- Median markers ----------------------------------------------------------
const medianPoints = distributions.map((sorted, categoryIndex) => ({
  x: categoryIndex,
  y: quantile(sorted, 0.5),
}));

// --- Chart -------------------------------------------------------------------
Highcharts.chart("container", {
  chart: {
    type: "column",
    backgroundColor: "transparent",
    animation: false,
    style: { fontFamily: "inherit" },
  },
  credits: { enabled: false },
  title: {
    text: "boxen-basic · javascript · highcharts · anyplot.ai",
    style: { color: t.ink, fontSize: "22px", fontWeight: "600" },
  },
  subtitle: {
    text: `Simulated request latency · n = ${SAMPLES_PER_ENDPOINT.toLocaleString()} per endpoint`,
    style: { color: t.inkSoft, fontSize: "14px" },
  },
  xAxis: {
    categories,
    lineColor: t.inkSoft,
    tickColor: t.inkSoft,
    gridLineWidth: 0,
    labels: { style: { color: t.inkSoft, fontSize: "14px" } },
    title: { text: "Endpoint", style: { color: t.inkSoft, fontSize: "16px" } },
  },
  yAxis: {
    title: { text: "Response Time (ms)", style: { color: t.inkSoft, fontSize: "16px" } },
    gridLineColor: t.grid,
    lineColor: t.inkSoft,
    tickColor: t.inkSoft,
    labels: { style: { color: t.inkSoft, fontSize: "14px" } },
  },
  legend: {
    itemStyle: { color: t.inkSoft, fontSize: "14px" },
    itemHoverStyle: { color: t.ink },
  },
  plotOptions: {
    series: { animation: false },
    column: { pointPadding: 0, groupPadding: 0.3 },
  },
  series: [
    ...boxSeries,
    {
      type: "scatter",
      name: "Outliers",
      data: outlierPoints,
      color: Highcharts.color(t.inkSoft).setOpacity(0.75).get("rgba"),
      marker: { radius: 4, lineWidth: 0 },
      zIndex: levelDefs.length + 1,
    },
    {
      type: "scatter",
      name: "Median",
      data: medianPoints,
      color: t.ink,
      marker: {
        symbol: "diamond",
        radius: 7,
        lineWidth: 1,
        lineColor: t.pageBg,
      },
      zIndex: levelDefs.length + 2,
    },
  ],
});
Runnable source as JSON, for any HTTP client: https://api.anyplot.ai/specs/boxen-basic/highcharts/code. Any spec id and library id listed in llms-full.txt fit the same URL shape; every URL below is complete and callable.
{
  "spec_id": "boxen-basic",
  "language": "javascript",
  "library": "highcharts",
  "page": "https://anyplot.ai/boxen-basic/javascript/highcharts",
  "hub": "https://anyplot.ai/boxen-basic",
  "code_json": "https://api.anyplot.ai/specs/boxen-basic/highcharts/code",
  "spec_json": "https://api.anyplot.ai/specs/boxen-basic",
  "render_light_png": "https://storage.googleapis.com/anyplot-images/plots/boxen-basic/javascript/highcharts/plot-light.png",
  "render_dark_png": "https://storage.googleapis.com/anyplot-images/plots/boxen-basic/javascript/highcharts/plot-dark.png",
  "interactive_light_html": "https://storage.googleapis.com/anyplot-images/plots/boxen-basic/javascript/highcharts/plot-light.html",
  "interactive_dark_html": "https://storage.googleapis.com/anyplot-images/plots/boxen-basic/javascript/highcharts/plot-dark.html",
  "quality_score": 92.0,
  "license": "MIT",
  "guide": "https://anyplot.ai/llms.txt"
}
Part of Basic Boxen Plot (Letter-Value Plot) on anyplot.ai.