The same plot in 14 other libraries — JavaScript: Chart.js, D3.js, Apache ECharts, Highcharts; Python: Altair, Bokeh, lets-plot, Matplotlib, Plotly, plotnine, Pygal, Seaborn; R: ggplot2; Julia: Makie.jl. Compare all 15 side by side: Basic Boxen Plot (Letter-Value Plot) in Python, R, Julia and JavaScript.
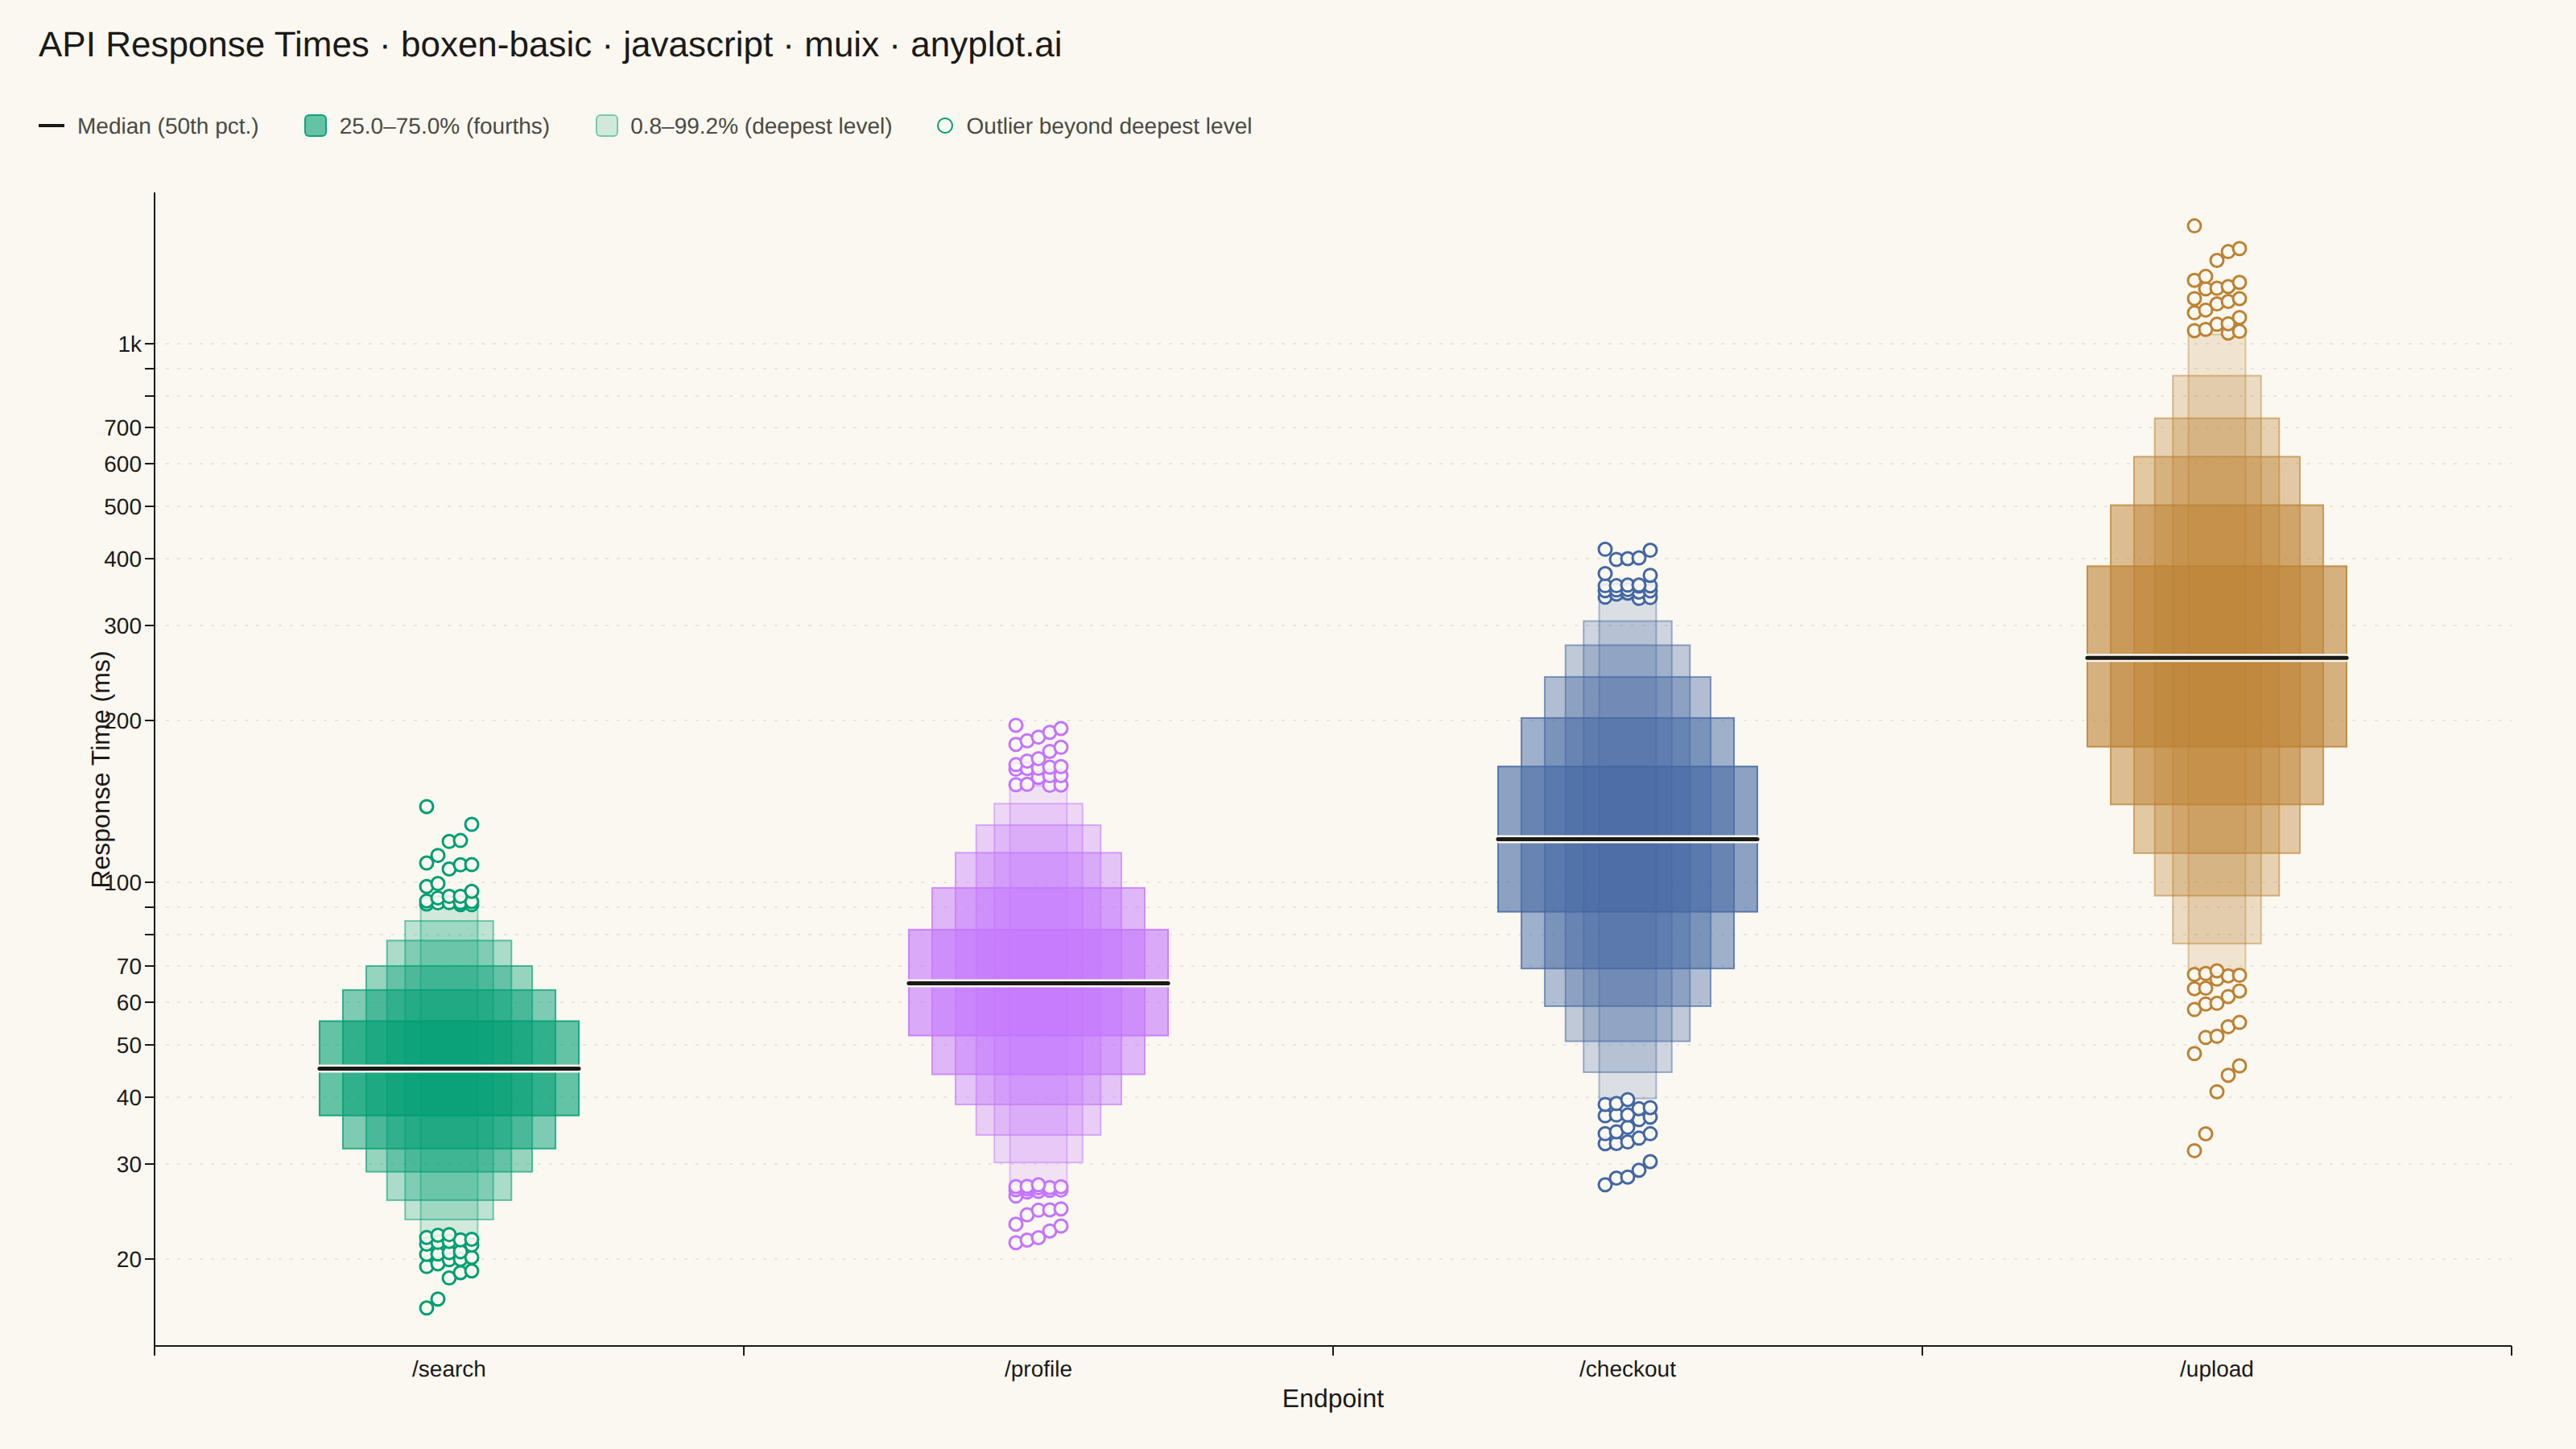
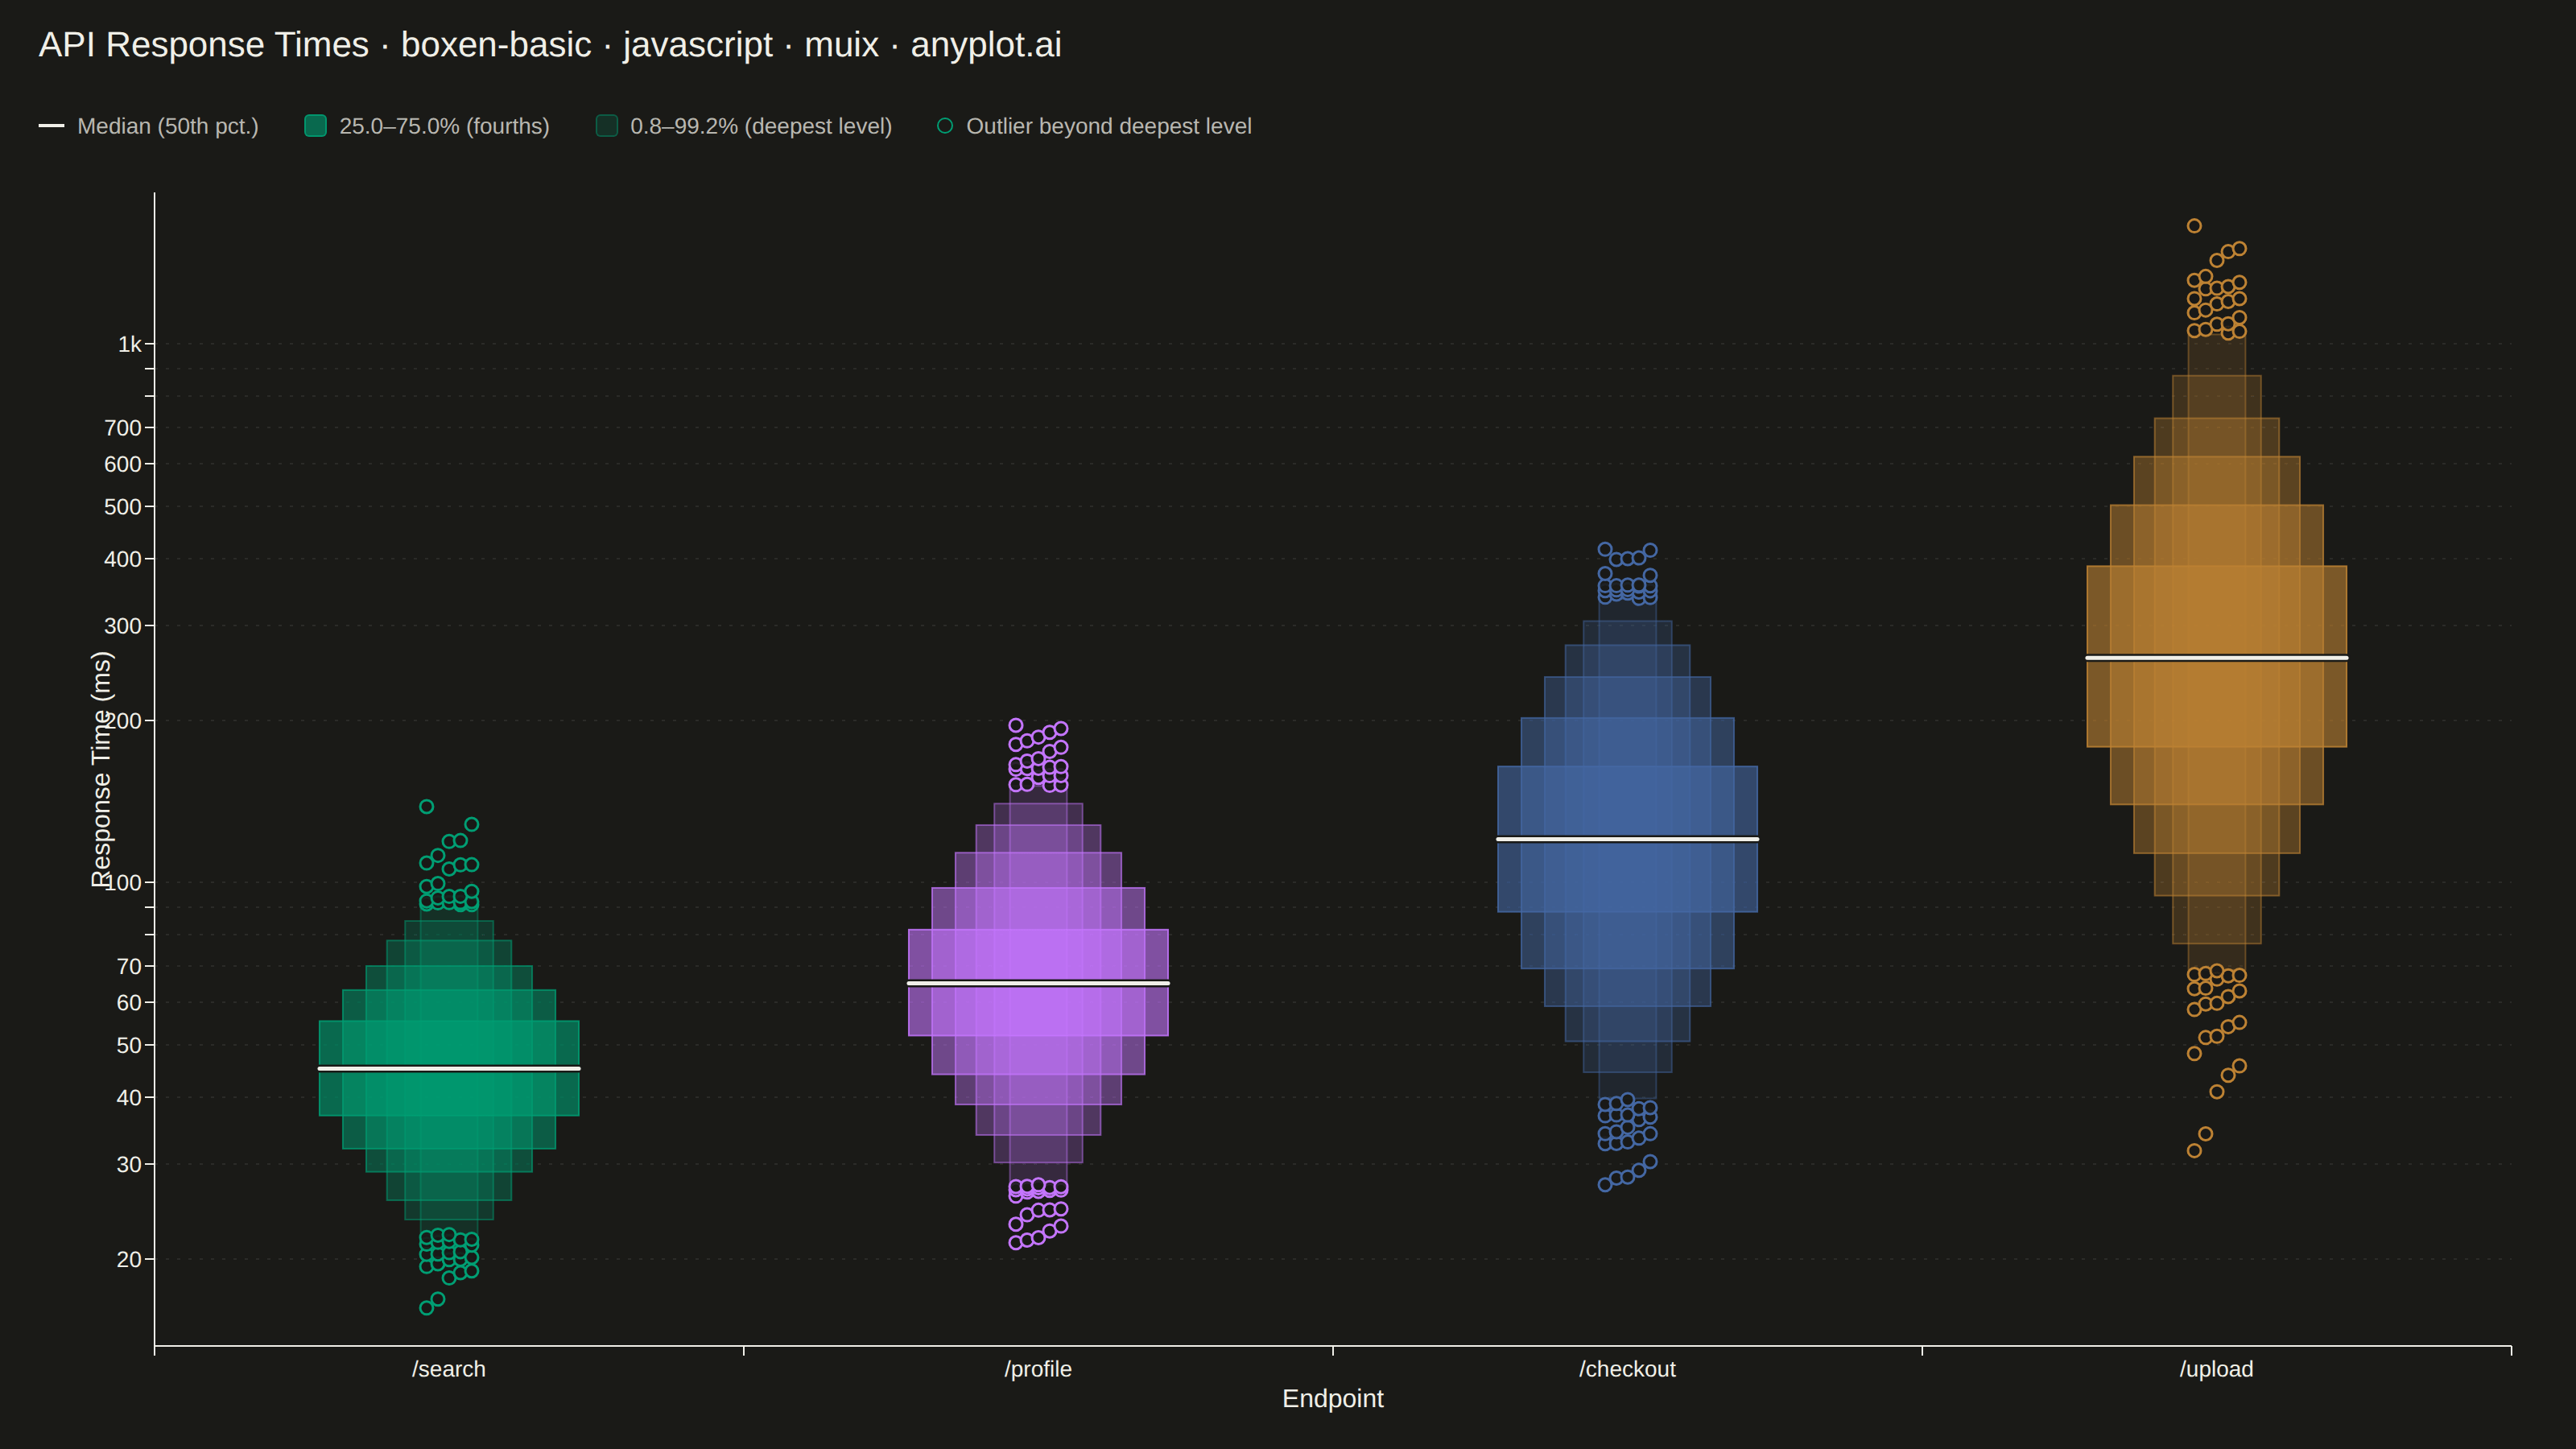
A boxen plot (also known as letter-value plot) extends the traditional box plot to show more quantile information, making it ideal for large datasets with 1000+ observations. Instead of just displaying the median and quartiles, it shows additional "letter values" (eighths, sixteenths, etc.) as nested boxes, revealing the full shape of the distribution including tail behavior. This makes outlier detection more meaningful and distribution comparison more detailed.
// anyplot.ai
// boxen-basic: Basic Boxen Plot (Letter-Value Plot)
// Library: muix 7.29.1 | JavaScript 22.23.2
// Quality: 92/100 | Created: 2026-09-01
import { ChartContainer } from "@mui/x-charts/ChartContainer";
import { ChartsGrid } from "@mui/x-charts/ChartsGrid";
import { ChartsXAxis } from "@mui/x-charts/ChartsXAxis";
import { ChartsYAxis } from "@mui/x-charts/ChartsYAxis";
import { useXScale, useYScale } from "@mui/x-charts/hooks";

const t = window.ANYPLOT_TOKENS;
const TITLE = "API Response Times · boxen-basic · javascript · muix · anyplot.ai";
const TITLE_HEIGHT = 56;
const LEGEND_HEIGHT = 44;

// --- Data (in-memory, deterministic LCG — no seeded RNG in the browser) -----
function lcg(seed) {
  let state = seed;
  return () => {
    state = (state * 1664525 + 1013904223) % 4294967296;
    return state / 4294967296;
  };
}

function randomNormal(rand) {
  const u1 = Math.max(rand(), 1e-9);
  const u2 = rand();
  return Math.sqrt(-2 * Math.log(u1)) * Math.cos(2 * Math.PI * u2);
}

// Server endpoints — right-skewed (log-normal) latency, the classic shape
// where a boxen/letter-value plot earns its keep over a regular box plot:
// the interesting behavior lives in the tail, not around the median.
const endpoints = [
  { name: "/search", medianMs: 45, sigma: 0.3 },
  { name: "/profile", medianMs: 65, sigma: 0.35 },
  { name: "/checkout", medianMs: 120, sigma: 0.45 },
  { name: "/upload", medianMs: 260, sigma: 0.55 },
];

const N_PER_ENDPOINT = 3000;
const MAX_LEVELS = 6; // capped for legibility — deeper levels shrink toward imperceptible slivers at this canvas size

const rand = lcg(42);

function orderStat(sortedAsc, depth) {
  const n = sortedAsc.length;
  const lo = Math.max(0, Math.floor(depth) - 1);
  const hi = Math.min(n - 1, Math.ceil(depth) - 1);
  return lo === hi ? sortedAsc[lo] : (sortedAsc[lo] + sortedAsc[hi]) / 2;
}

// Tukey letter-value recursion: each level's depth is half the previous
// level's (floored) depth + 1, converging from the median toward the
// extremes. Each level's box spans the order statistics at that depth from
// either end — quartiles first, then eighths, sixteenths, and so on.
function letterValues(sortedAsc, maxLevels) {
  const n = sortedAsc.length;
  let depth = (n + 1) / 2;
  const median = orderStat(sortedAsc, depth);
  const boxes = [];
  for (let i = 0; i < maxLevels; i++) {
    const nextDepth = (Math.floor(depth) + 1) / 2;
    if (nextDepth < 1 || nextDepth === depth) break;
    depth = nextDepth;
    boxes.push({
      lower: orderStat(sortedAsc, depth),
      upper: orderStat(sortedAsc, n - depth + 1),
      pctLower: (depth / (n + 1)) * 100,
      pctUpper: 100 - (depth / (n + 1)) * 100,
    });
  }
  return { median, boxes };
}

const categoryStats = endpoints.map(({ name, medianMs, sigma }) => {
  const mu = Math.log(medianMs);
  const values = Array.from({ length: N_PER_ENDPOINT }, () =>
    Math.exp(mu + sigma * randomNormal(rand)),
  ).sort((a, b) => a - b);

  const { median, boxes } = letterValues(values, MAX_LEVELS);
  const outer = boxes[boxes.length - 1];
  const outliers = values.filter((v) => v < outer.lower || v > outer.upper);

  return { name, median, boxes, outer, outliers };
});

// series=[] means the ChartContainer has no dataset to infer a y-domain
// from, so the log-scale axis needs an explicit min/max computed from the
// actual plotted extremes (outer letter-value bounds + outliers).
const allExtremes = categoryStats.flatMap((s) => [
  s.outer.lower,
  s.outer.upper,
  ...s.outliers,
]);
const Y_MIN = Math.min(...allExtremes) * 0.85;
const Y_MAX = Math.max(...allExtremes) * 1.15;

// Box width shrinks and fill lightens at deeper levels — the wider,
// paler bands cover more of the tail but represent a thinner slice of the
// distribution, giving the characteristic tapered "boxen" silhouette.
const WIDTH_FACTORS = [1, 0.82, 0.64, 0.48, 0.34, 0.22];
const FILL_OPACITY = [0.6, 0.5, 0.4, 0.32, 0.24, 0.17];

function hexToRgba(hex, alpha) {
  const r = parseInt(hex.slice(1, 3), 16);
  const g = parseInt(hex.slice(3, 5), 16);
  const b = parseInt(hex.slice(5, 7), 16);
  return `rgba(${r}, ${g}, ${b}, ${alpha})`;
}

// --- Nested letter-value boxes -----------------------------------------------
// The community package (7.29.1) ships no box/letter-value plot component at
// all — this reproduces one as a custom SVG layer positioned via the chart's
// own band/linear scale hooks, the same technique used for span overlays.
function BoxenLayer() {
  const xScale = useXScale();
  const yScale = useYScale();
  const bandwidth = xScale.bandwidth();
  const baseWidth = bandwidth * 0.55;

  return (
    <g>
      {categoryStats.map((cat, ci) => {
        const center = xScale(cat.name) + bandwidth / 2;
        const color = t.palette[ci % t.palette.length];
        const innerWidth = baseWidth * WIDTH_FACTORS[0];

        return (
          <g key={cat.name}>
            {[...cat.boxes].reverse().map((box, ri) => {
              const idx = cat.boxes.length - 1 - ri;
              const w = baseWidth * WIDTH_FACTORS[idx];
              const yTop = yScale(box.upper);
              const yBottom = yScale(box.lower);
              return (
                <rect
                  key={idx}
                  x={center - w / 2}
                  y={yTop}
                  width={w}
                  height={Math.max(1, yBottom - yTop)}
                  fill={color}
                  fillOpacity={FILL_OPACITY[idx]}
                  stroke={color}
                  strokeOpacity={Math.min(1, FILL_OPACITY[idx] + 0.25)}
                  strokeWidth={1}
                />
              );
            })}
            <line
              x1={center - innerWidth / 2}
              x2={center + innerWidth / 2}
              y1={yScale(cat.median)}
              y2={yScale(cat.median)}
              stroke={t.pageBg}
              strokeWidth={5}
              strokeLinecap="round"
            />
            <line
              x1={center - innerWidth / 2}
              x2={center + innerWidth / 2}
              y1={yScale(cat.median)}
              y2={yScale(cat.median)}
              stroke={t.ink}
              strokeWidth={2.5}
              strokeLinecap="round"
            />
            {cat.outliers.map((v, j) => (
              <circle
                key={j}
                cx={center + ((j % 5) - 2) * 7}
                cy={yScale(v)}
                r={4}
                fill={t.pageBg}
                stroke={color}
                strokeWidth={1.5}
                fillOpacity={0.9}
              />
            ))}
          </g>
        );
      })}
    </g>
  );
}

export default function Chart() {
  const chartHeight = window.ANYPLOT_SIZE.height - TITLE_HEIGHT - LEGEND_HEIGHT;
  const brand = t.palette[0];
  const inner = categoryStats[0].boxes[0];
  const outer = categoryStats[0].outer;

  const legendItems = [
    { kind: "line", label: "Median (50th pct.)" },
    {
      kind: "swatch",
      opacity: FILL_OPACITY[0],
      label: `${inner.pctLower.toFixed(1)}–${inner.pctUpper.toFixed(1)}% (fourths)`,
    },
    {
      kind: "swatch",
      opacity: FILL_OPACITY[FILL_OPACITY.length - 1],
      label: `${outer.pctLower.toFixed(1)}–${outer.pctUpper.toFixed(1)}% (deepest level)`,
    },
    { kind: "outlier", label: "Outlier beyond deepest level" },
  ];

  return (
    <div
      style={{
        width: window.ANYPLOT_SIZE.width,
        height: window.ANYPLOT_SIZE.height,
      }}
    >
      <div
        style={{
          height: TITLE_HEIGHT,
          lineHeight: `${TITLE_HEIGHT}px`,
          paddingLeft: 24,
          fontSize: 22,
          fontWeight: 500,
          color: t.ink,
        }}
      >
        {TITLE}
      </div>
      <div
        style={{
          height: LEGEND_HEIGHT,
          display: "flex",
          alignItems: "center",
          gap: 28,
          paddingLeft: 24,
          fontSize: 14,
          color: t.inkSoft,
        }}
      >
        {legendItems.map((item) => (
          <div
            key={item.label}
            style={{ display: "flex", alignItems: "center", gap: 8 }}
          >
            {item.kind === "line" && (
              <div style={{ width: 16, height: 2.5, background: t.ink }} />
            )}
            {item.kind === "swatch" && (
              <div
                style={{
                  width: 14,
                  height: 14,
                  borderRadius: 3,
                  background: hexToRgba(brand, item.opacity),
                  border: `1px solid ${hexToRgba(brand, Math.min(1, item.opacity + 0.25))}`,
                }}
              />
            )}
            {item.kind === "outlier" && (
              <div
                style={{
                  width: 10,
                  height: 10,
                  borderRadius: "50%",
                  background: t.pageBg,
                  border: `1.5px solid ${brand}`,
                }}
              />
            )}
            <span>{item.label}</span>
          </div>
        ))}
      </div>
      <ChartContainer
        width={window.ANYPLOT_SIZE.width}
        height={chartHeight}
        series={[]}
        skipAnimation
        margin={{ top: 20, right: 40, bottom: 64, left: 96 }}
        xAxis={[
          {
            id: "endpoints",
            data: categoryStats.map((s) => s.name),
            scaleType: "band",
            label: "Endpoint",
            labelStyle: { fontSize: 16 },
            tickLabelStyle: { fontSize: 14 },
          },
        ]}
        yAxis={[
          {
            id: "latency",
            scaleType: "log",
            min: Y_MIN,
            max: Y_MAX,
            label: "Response Time (ms)",
            labelStyle: { fontSize: 16 },
            tickLabelStyle: { fontSize: 14 },
          },
        ]}
      >
        <ChartsGrid
          horizontal
          sx={{
            "& .MuiChartsGrid-line": {
              opacity: 0.55,
              strokeDasharray: "2 5",
            },
          }}
        />
        <BoxenLayer />
        <ChartsXAxis axisId="endpoints" />
        <ChartsYAxis axisId="latency" />
      </ChartContainer>
    </div>
  );
}
Runnable source as JSON, for any HTTP client: https://api.anyplot.ai/specs/boxen-basic/muix/code. Any spec id and library id listed in llms-full.txt fit the same URL shape; every URL below is complete and callable.
{
  "spec_id": "boxen-basic",
  "language": "javascript",
  "library": "muix",
  "page": "https://anyplot.ai/boxen-basic/javascript/muix",
  "hub": "https://anyplot.ai/boxen-basic",
  "code_json": "https://api.anyplot.ai/specs/boxen-basic/muix/code",
  "spec_json": "https://api.anyplot.ai/specs/boxen-basic",
  "render_light_png": "https://storage.googleapis.com/anyplot-images/plots/boxen-basic/javascript/muix/plot-light.png",
  "render_dark_png": "https://storage.googleapis.com/anyplot-images/plots/boxen-basic/javascript/muix/plot-dark.png",
  "interactive_light_html": "https://storage.googleapis.com/anyplot-images/plots/boxen-basic/javascript/muix/plot-light.html",
  "interactive_dark_html": "https://storage.googleapis.com/anyplot-images/plots/boxen-basic/javascript/muix/plot-dark.html",
  "quality_score": 92.0,
  "license": "MIT",
  "guide": "https://anyplot.ai/llms.txt"
}
Part of Basic Boxen Plot (Letter-Value Plot) on anyplot.ai.