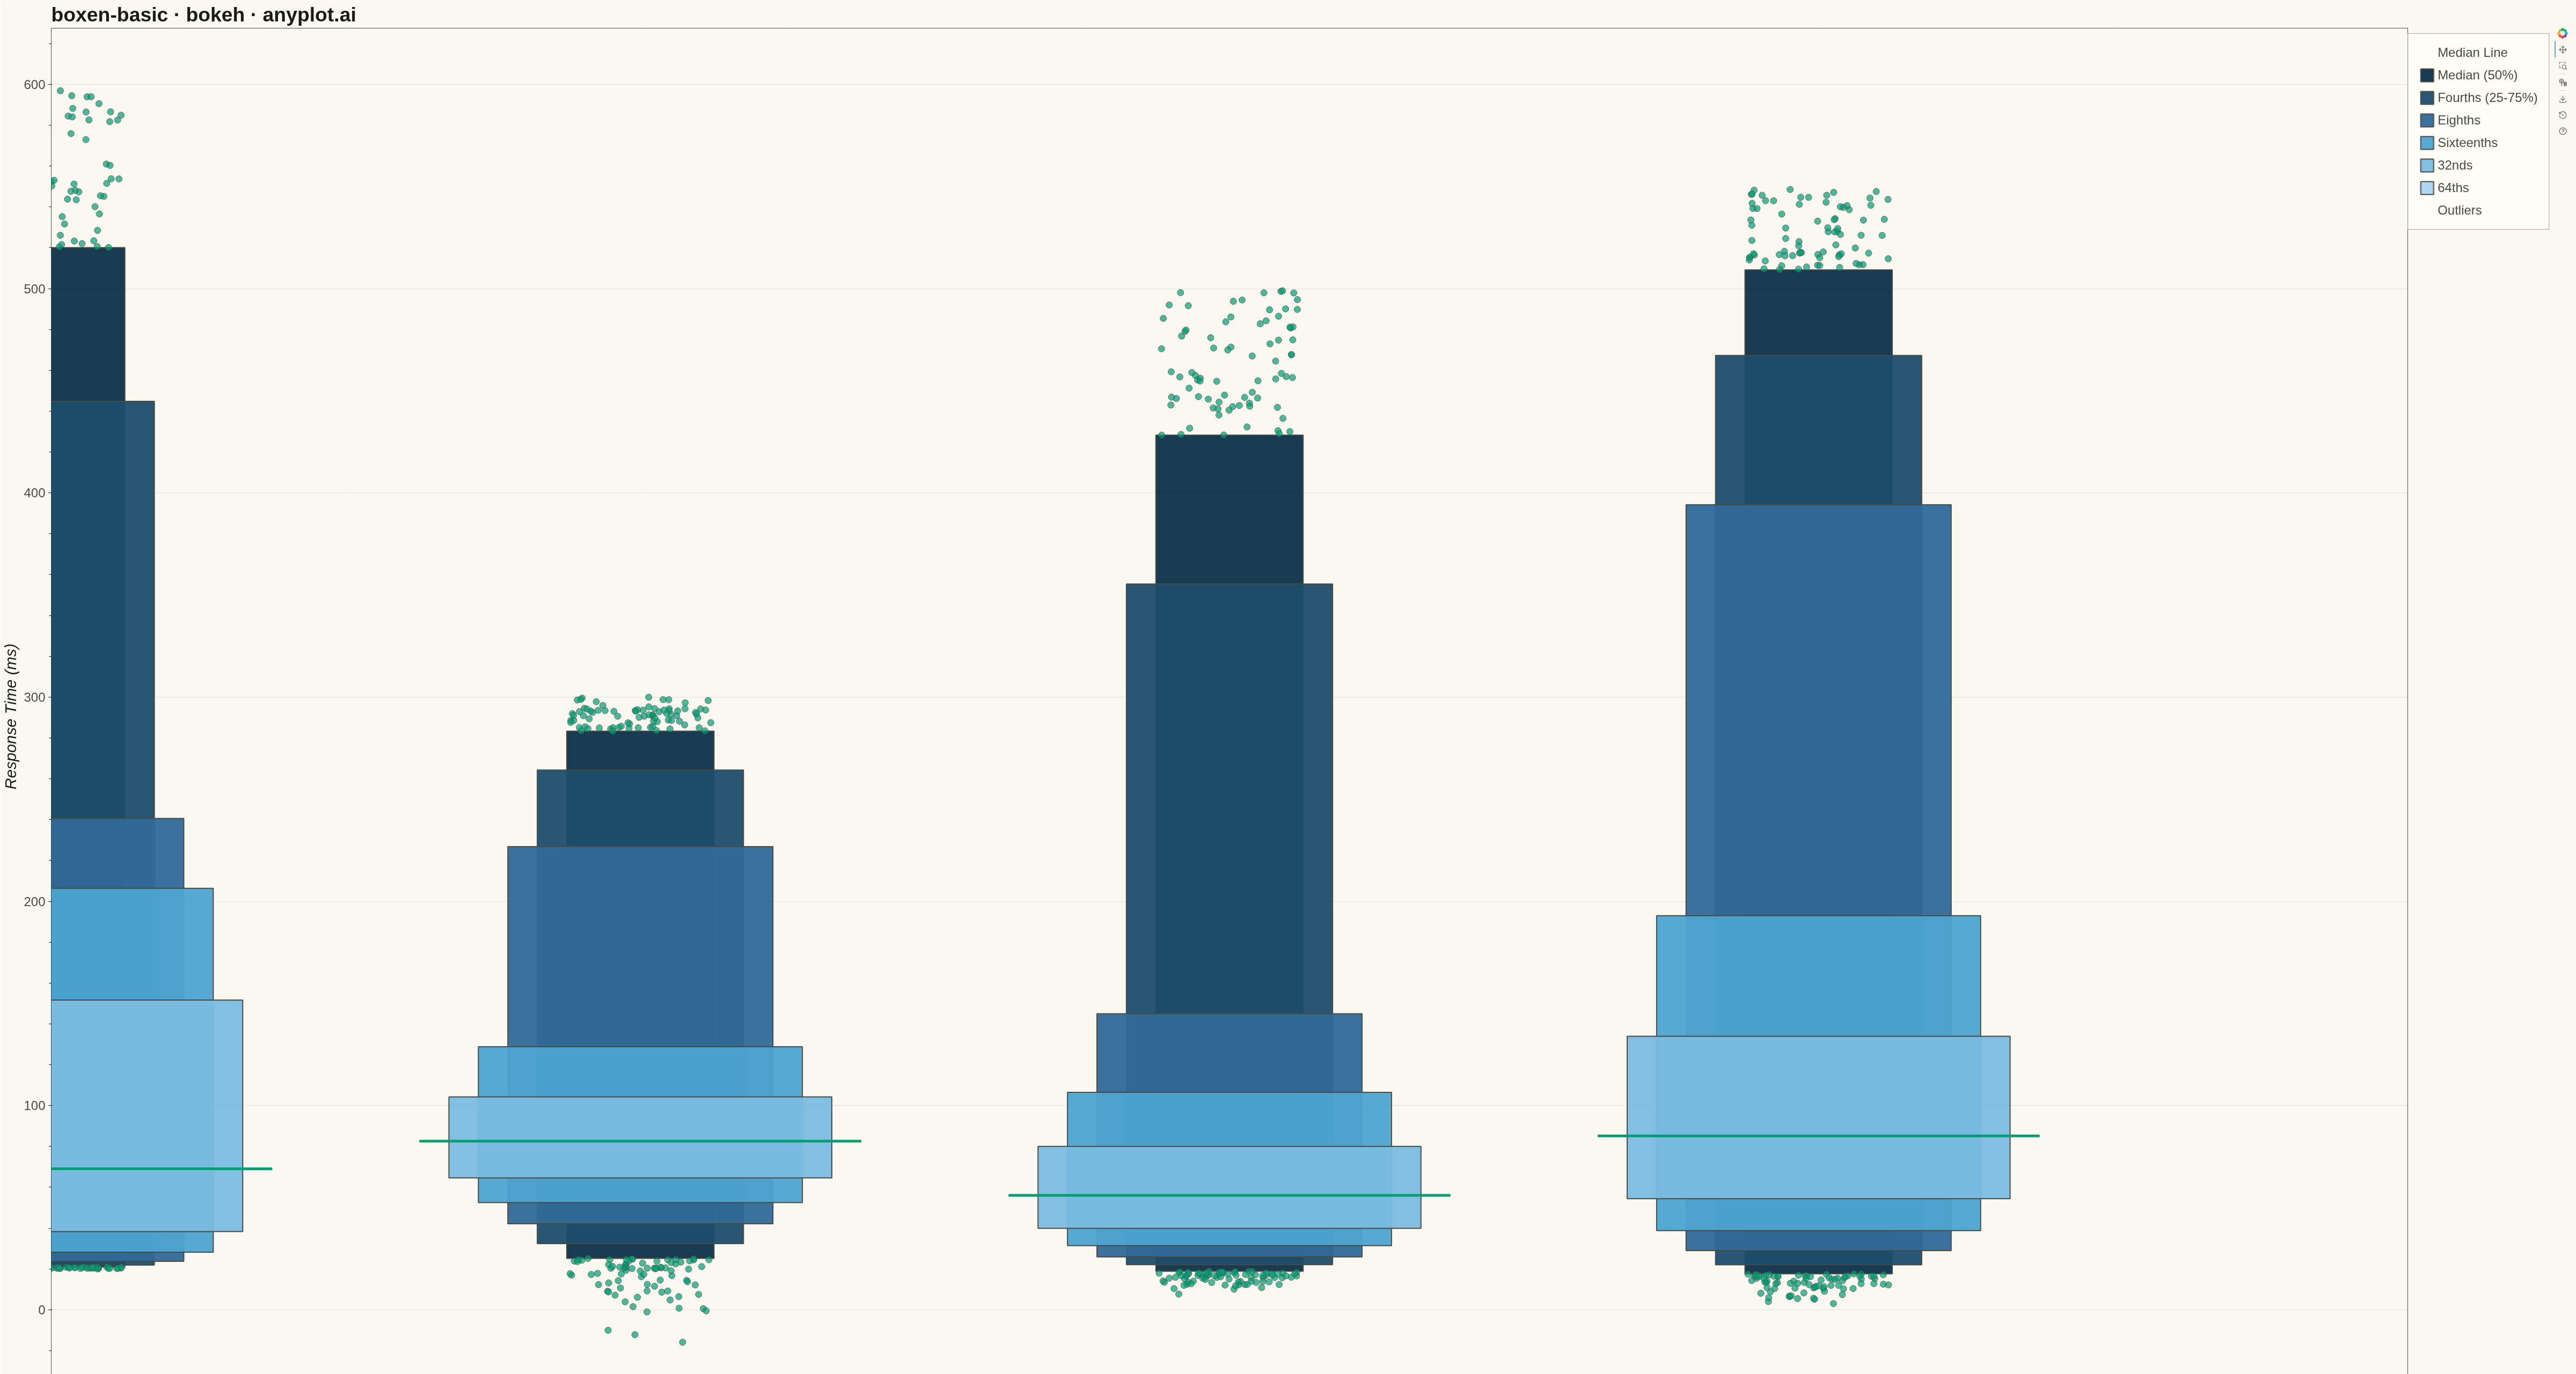
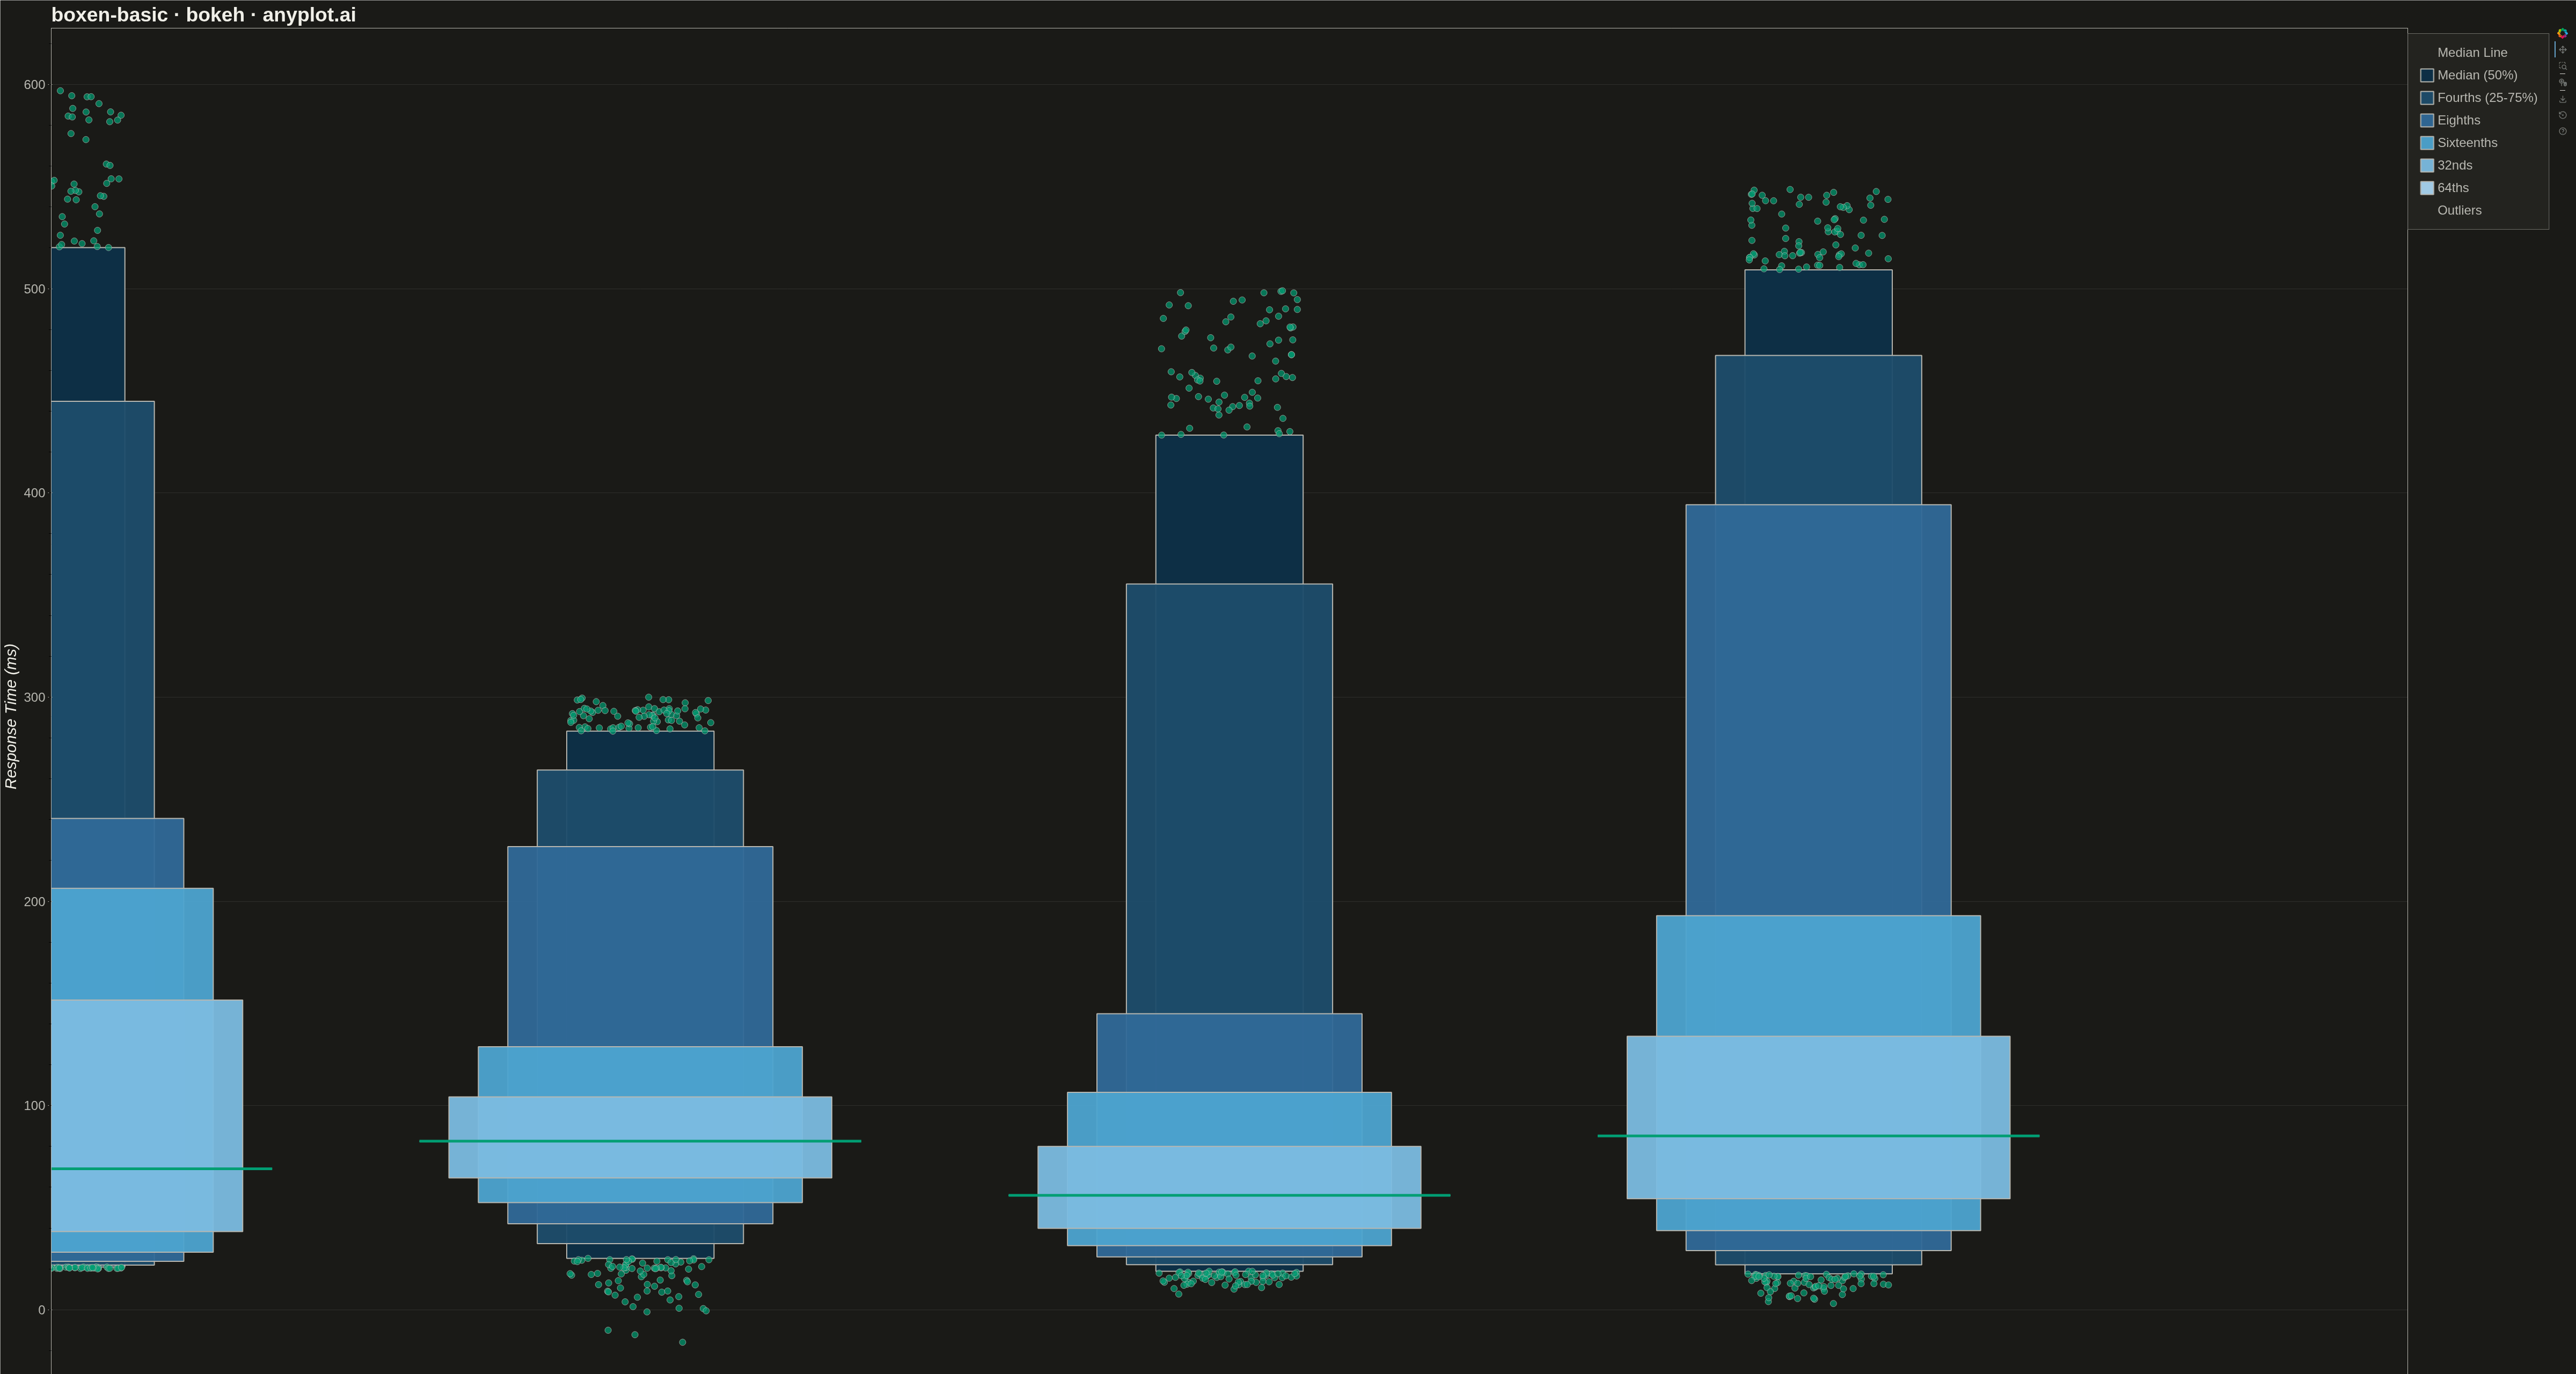
A boxen plot (also known as letter-value plot) extends the traditional box plot to show more quantile information, making it ideal for large datasets with 1000+ observations. Instead of just displaying the median and quartiles, it shows additional "letter values" (eighths, sixteenths, etc.) as nested boxes, revealing the full shape of the distribution including tail behavior. This makes outlier detection more meaningful and distribution comparison more detailed.
""" anyplot.ai
boxen-basic: Basic Boxen Plot (Letter-Value Plot)
Library: bokeh 3.9.0 | Python 3.13.13
Quality: 96/100 | Updated: 2026-05-17
"""

import os
import time
from pathlib import Path

import numpy as np
from bokeh.io import output_file, save
from bokeh.models import ColumnDataSource, Legend, LegendItem
from bokeh.plotting import figure
from selenium import webdriver
from selenium.webdriver.chrome.options import Options


# Theme configuration
THEME = os.getenv("ANYPLOT_THEME", "light")
PAGE_BG = "#FAF8F1" if THEME == "light" else "#1A1A17"
ELEVATED_BG = "#FFFDF6" if THEME == "light" else "#242420"
INK = "#1A1A17" if THEME == "light" else "#F0EFE8"
INK_SOFT = "#4A4A44" if THEME == "light" else "#B8B7B0"

# Data - Server response times by endpoint (large datasets ideal for boxen)
np.random.seed(42)

# Generate 5000 points per category with different distributions
categories = ["API Auth", "API Users", "API Orders", "API Search"]
data = {
    "API Auth": np.concatenate(
        [np.random.exponential(50, 4000) + 20, np.random.normal(200, 30, 800), np.random.uniform(400, 600, 200)]
    ),
    "API Users": np.concatenate([np.random.normal(80, 25, 4500), np.random.uniform(180, 300, 500)]),
    "API Orders": np.concatenate([np.random.lognormal(4, 0.5, 4800), np.random.uniform(300, 500, 200)]),
    "API Search": np.concatenate([np.random.gamma(3, 30, 4600), np.random.uniform(350, 550, 400)]),
}

# Create figure
p = figure(
    width=4800,
    height=2700,
    title="boxen-basic · bokeh · anyplot.ai",
    x_axis_label="API Endpoint",
    y_axis_label="Response Time (ms)",
    x_range=categories,
)

# Colors for quantile levels (gradient from light to dark)
colors = [
    "#a8d4f0",  # Lightest - 64ths
    "#7bbce0",  # 32nds
    "#4da4d0",  # Sixteenths
    "#306998",  # Eighths
    "#1e4d6b",  # Fourths (25-75%)
    "#0d3048",  # Median (50%)
]

# Width factors for nested boxes (wider outer, narrower inner)
width_factors = [0.75, 0.65, 0.55, 0.45, 0.35, 0.25]

# Legend items in reverse order (light to dark for clear visual hierarchy)
legend_items = []

# Plot boxen for each category
for cat_idx, category in enumerate(categories):
    values = data[category]

    # Compute letter-value quantiles inline: median, fourths, eighths, sixteenths, 32nds, 64ths
    letter_values = []
    for i in range(6):
        q_low = 0.5 ** (i + 1)
        q_high = 1 - q_low
        lower = np.percentile(values, q_low * 100)
        upper = np.percentile(values, q_high * 100)
        letter_values.append((lower, upper, i))

    # Plot from outer to inner (deepest quantile first, so inner boxes are on top)
    for level_idx in range(len(letter_values) - 1, -1, -1):
        lower, upper, _ = letter_values[level_idx]
        width = width_factors[level_idx]
        color = colors[level_idx]

        # Create box as a quad
        source = ColumnDataSource(
            data={"left": [cat_idx - width / 2], "right": [cat_idx + width / 2], "bottom": [lower], "top": [upper]}
        )

        renderer = p.quad(
            left="left",
            right="right",
            bottom="bottom",
            top="top",
            source=source,
            fill_color=color,
            line_color=INK_SOFT,
            line_width=2,
            fill_alpha=0.95,
        )

        # Add legend item only once per level (first category)
        if cat_idx == 0:
            level_names = ["64ths", "32nds", "Sixteenths", "Eighths", "Fourths (25-75%)", "Median (50%)"]
            legend_items.append(LegendItem(label=level_names[level_idx], renderers=[renderer]))

    # Add median line
    median = np.median(values)
    median_width = width_factors[0]
    p.line(
        x=[cat_idx - median_width / 2, cat_idx + median_width / 2],
        y=[median, median],
        line_color="#009E73",
        line_width=5,
    )

    # Add outliers (beyond 64th percentile level)
    deepest_lower, deepest_upper, _ = letter_values[-1]
    outliers = values[(values < deepest_lower) | (values > deepest_upper)]
    if len(outliers) > 0:
        # Jitter x positions for visibility
        jitter = np.random.uniform(-0.12, 0.12, len(outliers))
        outlier_source = ColumnDataSource(data={"x": [cat_idx + j for j in jitter], "y": outliers})
        p.scatter(
            x="x",
            y="y",
            source=outlier_source,
            size=12,
            fill_color="#009E73",
            line_color=INK_SOFT,
            line_width=1,
            alpha=0.7,
        )

# Add median line to legend first
median_renderer = p.line(x=[], y=[], line_color="#009E73", line_width=5)
legend_items.insert(0, LegendItem(label="Median Line", renderers=[median_renderer]))

# Add outlier to legend
outlier_renderer = p.scatter(x=[], y=[], size=12, fill_color="#009E73", line_color=INK_SOFT)
legend_items.append(LegendItem(label="Outliers", renderers=[outlier_renderer]))

# Create and add legend
legend = Legend(items=legend_items, location="top_right")
legend.label_text_font_size = "18pt"
legend.label_text_color = INK_SOFT
legend.glyph_height = 30
legend.glyph_width = 30
legend.spacing = 12
legend.padding = 20
legend.background_fill_color = ELEVATED_BG
legend.border_line_color = INK_SOFT
p.add_layout(legend, "right")

# Styling
p.title.text_font_size = "28pt"
p.title.text_color = INK
p.xaxis.axis_label_text_font_size = "22pt"
p.yaxis.axis_label_text_font_size = "22pt"
p.xaxis.axis_label_text_color = INK
p.yaxis.axis_label_text_color = INK
p.xaxis.major_label_text_font_size = "18pt"
p.yaxis.major_label_text_font_size = "18pt"
p.xaxis.major_label_text_color = INK_SOFT
p.yaxis.major_label_text_color = INK_SOFT
p.xaxis.axis_line_color = INK_SOFT
p.yaxis.axis_line_color = INK_SOFT
p.xaxis.major_tick_line_color = INK_SOFT
p.yaxis.major_tick_line_color = INK_SOFT
p.xaxis.major_label_orientation = 0.0

# Grid
p.xgrid.grid_line_color = None
p.ygrid.grid_line_color = INK
p.ygrid.grid_line_alpha = 0.10

# Background
p.background_fill_color = PAGE_BG
p.border_fill_color = PAGE_BG
p.outline_line_color = INK_SOFT

# Save HTML
output_file(f"plot-{THEME}.html")
save(p)

# Screenshot with headless Chrome
W, H = 4800, 2700
opts = Options()
for arg in (
    "--headless=new",
    "--no-sandbox",
    "--disable-dev-shm-usage",
    "--disable-gpu",
    f"--window-size={W},{H}",
    "--hide-scrollbars",
):
    opts.add_argument(arg)
driver = webdriver.Chrome(options=opts)
driver.set_window_size(W, H)
driver.get(f"file://{Path(f'plot-{THEME}.html').resolve()}")
time.sleep(3)
driver.save_screenshot(f"plot-{THEME}.png")
driver.quit()
Runnable source as JSON, for any HTTP client: https://api.anyplot.ai/specs/boxen-basic/bokeh/code. Any spec id and library id listed in llms-full.txt fit the same URL shape; every URL below is complete and callable.
{
  "spec_id": "boxen-basic",
  "language": "python",
  "library": "bokeh",
  "page": "https://anyplot.ai/boxen-basic/python/bokeh",
  "hub": "https://anyplot.ai/boxen-basic",
  "code_json": "https://api.anyplot.ai/specs/boxen-basic/bokeh/code",
  "spec_json": "https://api.anyplot.ai/specs/boxen-basic",
  "render_light_png": "https://storage.googleapis.com/anyplot-images/plots/boxen-basic/python/bokeh/plot-light.png",
  "render_dark_png": "https://storage.googleapis.com/anyplot-images/plots/boxen-basic/python/bokeh/plot-dark.png",
  "interactive_light_html": "https://storage.googleapis.com/anyplot-images/plots/boxen-basic/python/bokeh/plot-light.html",
  "interactive_dark_html": "https://storage.googleapis.com/anyplot-images/plots/boxen-basic/python/bokeh/plot-dark.html",
  "quality_score": 96.0,
  "license": "MIT",
  "guide": "https://anyplot.ai/llms.txt"
}
Part of Basic Boxen Plot (Letter-Value Plot) on anyplot.ai.