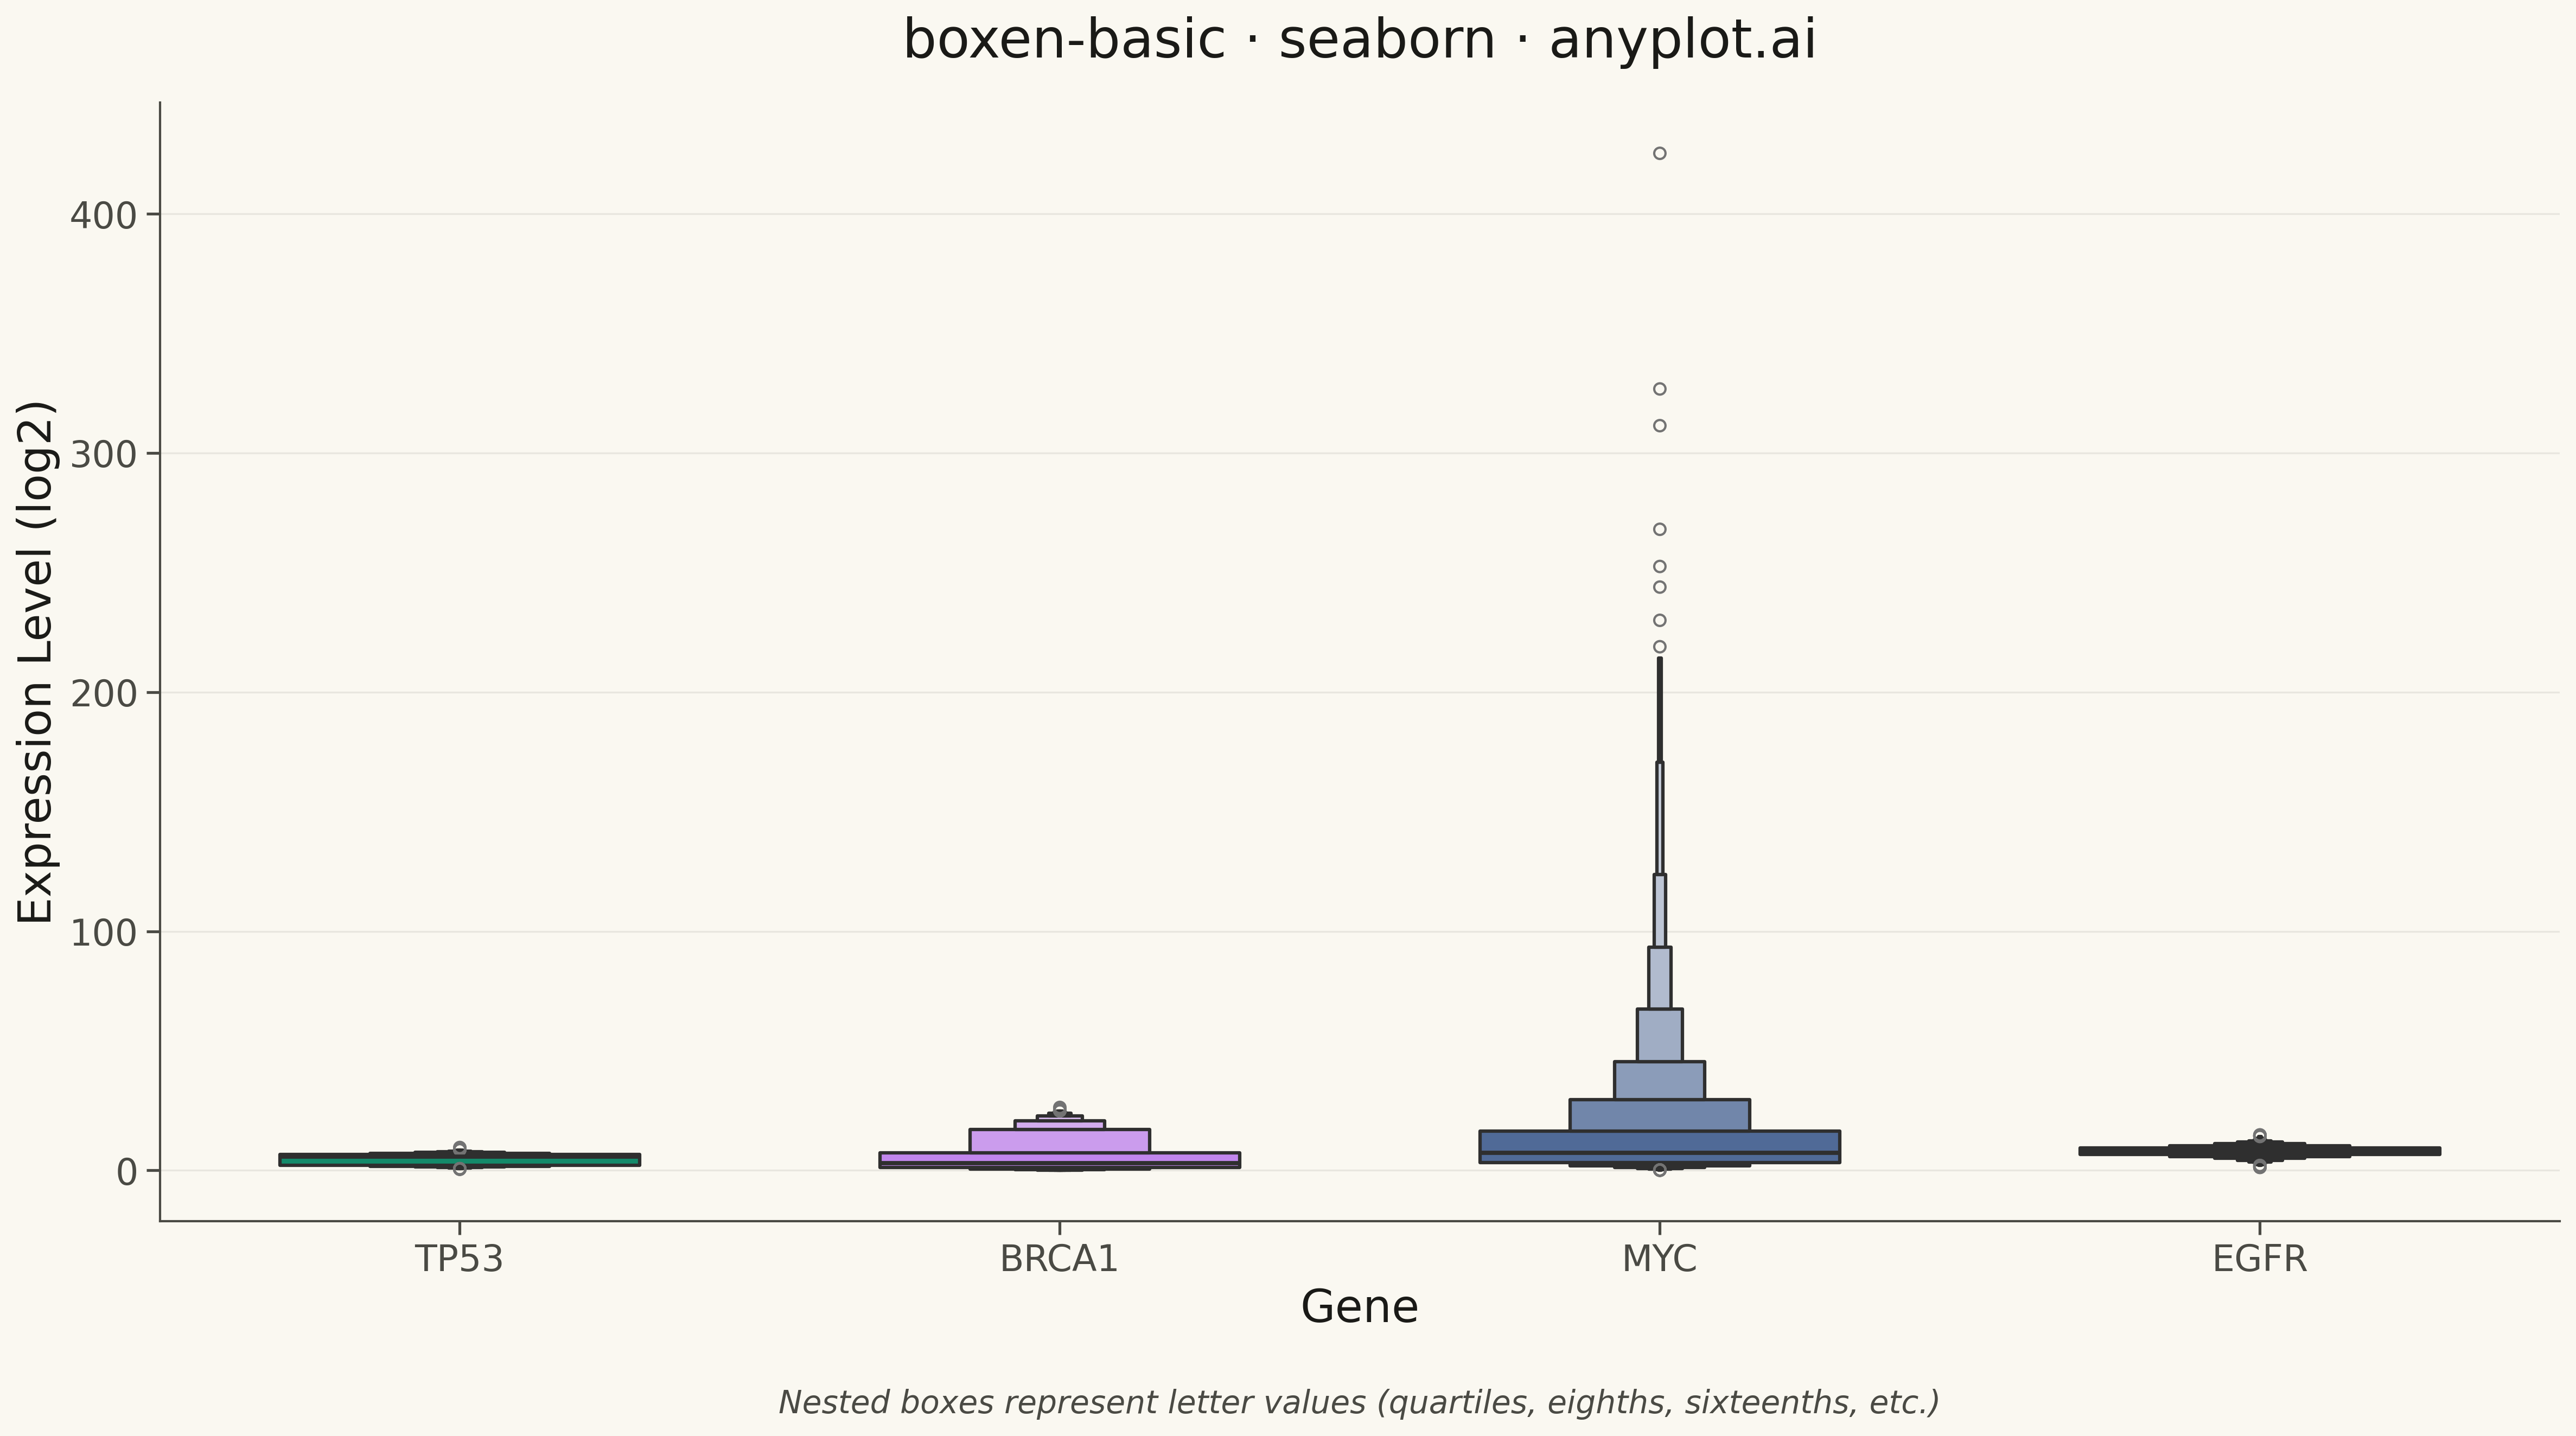
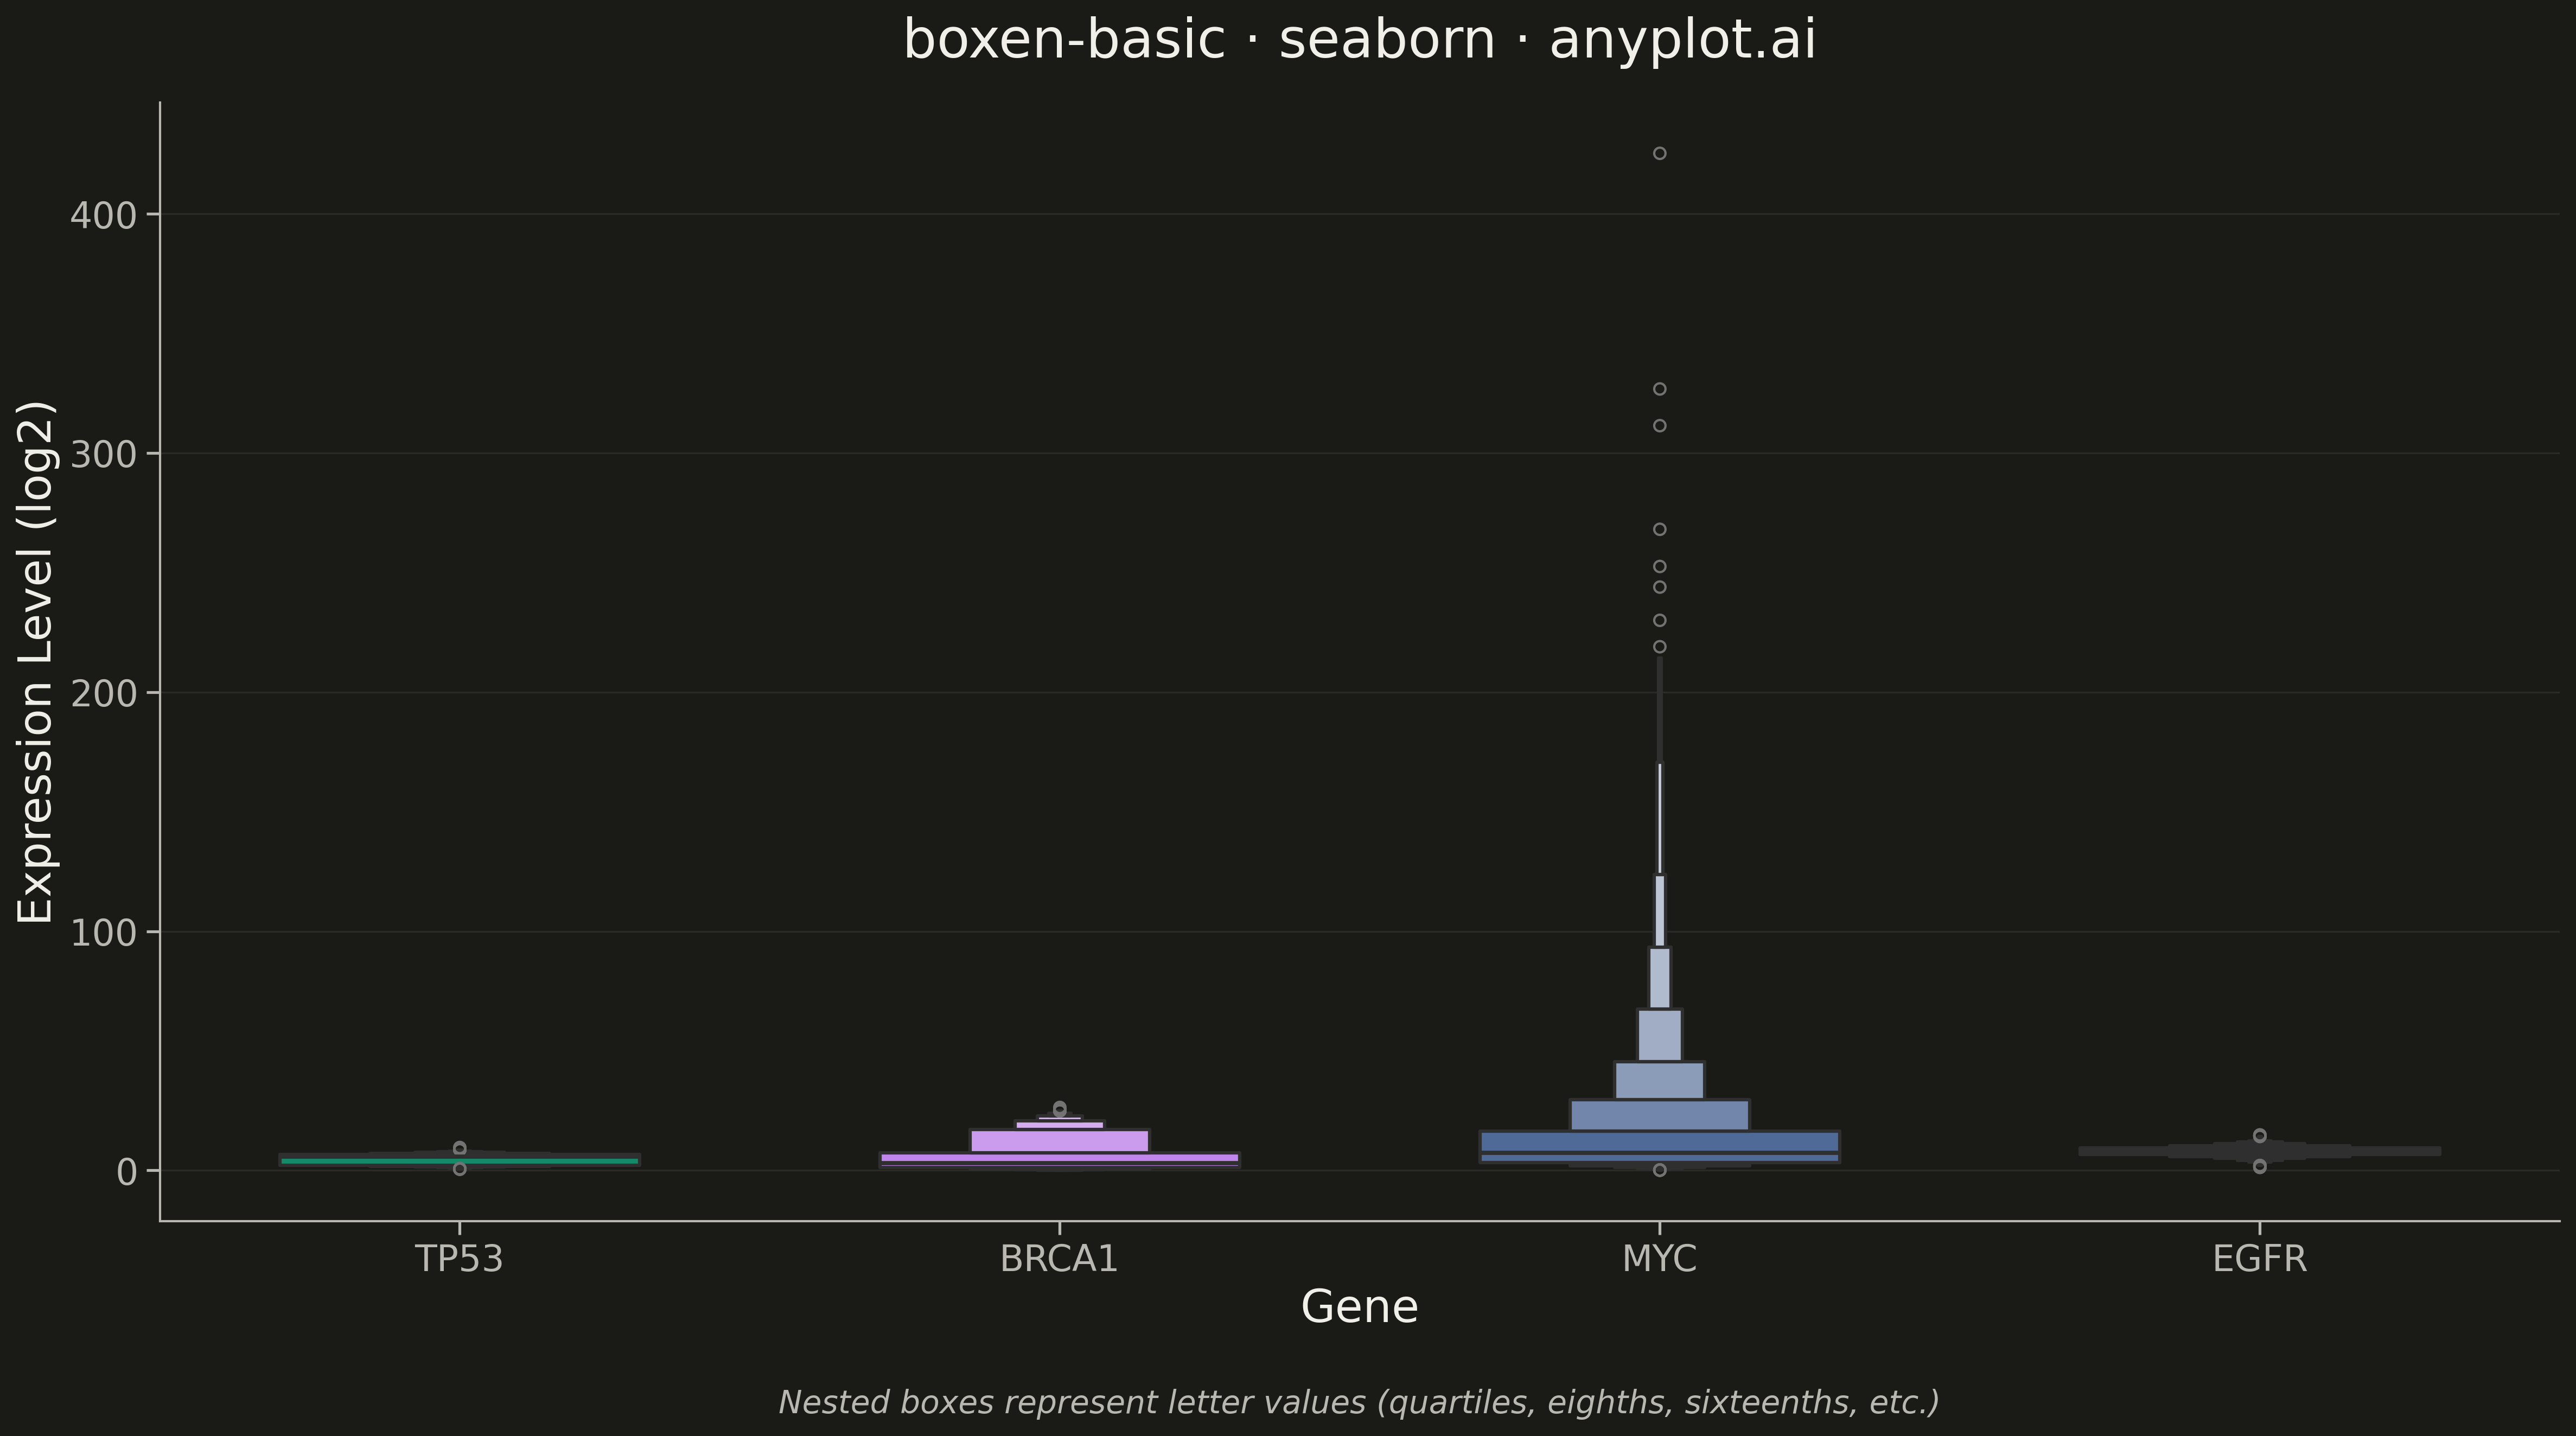
A boxen plot (also known as letter-value plot) extends the traditional box plot to show more quantile information, making it ideal for large datasets with 1000+ observations. Instead of just displaying the median and quartiles, it shows additional "letter values" (eighths, sixteenths, etc.) as nested boxes, revealing the full shape of the distribution including tail behavior. This makes outlier detection more meaningful and distribution comparison more detailed.
""" anyplot.ai
boxen-basic: Basic Boxen Plot (Letter-Value Plot)
Library: seaborn 0.13.2 | Python 3.13.13
Quality: 90/100 | Updated: 2026-05-17
"""

import os

import matplotlib.pyplot as plt
import numpy as np
import pandas as pd
import seaborn as sns


# Theme tokens
THEME = os.getenv("ANYPLOT_THEME", "light")
PAGE_BG = "#FAF8F1" if THEME == "light" else "#1A1A17"
ELEVATED_BG = "#FFFDF6" if THEME == "light" else "#242420"
INK = "#1A1A17" if THEME == "light" else "#F0EFE8"
INK_SOFT = "#4A4A44" if THEME == "light" else "#B8B7B0"

# Okabe-Ito palette (first series always #009E73)
IMPRINT = [
    "#009E73",  # bluish green
    "#C475FD",  # vermillion
    "#4467A3",  # blue
    "#BD8233",  # reddish purple
]

# Data - Gene expression levels across tumor and normal samples
np.random.seed(42)

genes = ["TP53", "BRCA1", "MYC", "EGFR"]
n_per_group = 4000

data = []
for _i, gene in enumerate(genes):
    if gene == "TP53":
        # Tumor suppressor - bimodal (wild-type vs mutant expression)
        values = np.concatenate(
            [
                np.random.normal(loc=6.5, scale=0.8, size=int(n_per_group * 0.6)),
                np.random.normal(loc=2.0, scale=0.5, size=int(n_per_group * 0.4)),
            ]
        )
    elif gene == "BRCA1":
        # Breast cancer susceptibility - right-skewed, occasional high expression
        values = np.concatenate(
            [
                np.random.exponential(scale=3.5, size=int(n_per_group * 0.85)),
                np.random.uniform(15, 25, size=int(n_per_group * 0.15)),
            ]
        )
    elif gene == "MYC":
        # Oncogene - highly variable, long tail
        values = np.random.lognormal(mean=2.0, sigma=1.2, size=n_per_group)
    else:  # EGFR
        # Growth receptor - relatively symmetric with moderate spread
        values = np.random.normal(loc=8.0, scale=2.0, size=n_per_group)

    # Ensure positive expression values
    values = np.clip(values, 0.1, None)
    data.extend([(gene, v) for v in values])

df = pd.DataFrame(data, columns=["Gene", "Expression Level (log2)"])

# Configure seaborn theme
sns.set_theme(
    style="ticks",
    rc={
        "figure.facecolor": PAGE_BG,
        "axes.facecolor": PAGE_BG,
        "axes.edgecolor": INK_SOFT,
        "axes.labelcolor": INK,
        "text.color": INK,
        "xtick.color": INK_SOFT,
        "ytick.color": INK_SOFT,
        "grid.color": INK,
        "grid.alpha": 0.10,
    },
)

# Plot
fig, ax = plt.subplots(figsize=(16, 9), facecolor=PAGE_BG)

sns.boxenplot(
    data=df,
    x="Gene",
    y="Expression Level (log2)",
    hue="Gene",
    palette=IMPRINT,
    legend=False,
    width=0.6,
    linewidth=1.5,
    ax=ax,
)

# Styling
ax.set_title("boxen-basic · seaborn · anyplot.ai", fontsize=24, fontweight="medium", color=INK, pad=20)
ax.set_xlabel("Gene", fontsize=20, color=INK)
ax.set_ylabel("Expression Level (log2)", fontsize=20, color=INK)
ax.tick_params(axis="both", labelsize=16, colors=INK_SOFT)

# Grid
ax.yaxis.grid(True, alpha=0.10, linewidth=0.8, color=INK_SOFT)

# Remove top and right spines
ax.spines["top"].set_visible(False)
ax.spines["right"].set_visible(False)
for spine in ["left", "bottom"]:
    ax.spines[spine].set_color(INK_SOFT)
    ax.spines[spine].set_linewidth(1.0)

# Legend explaining quantile levels
legend_text = "Nested boxes represent letter values (quartiles, eighths, sixteenths, etc.)"
ax.text(
    0.5, -0.15, legend_text, transform=ax.transAxes, ha="center", va="top", fontsize=14, color=INK_SOFT, style="italic"
)

plt.tight_layout()
plt.savefig(f"plot-{THEME}.png", dpi=300, bbox_inches="tight", facecolor=PAGE_BG)
Runnable source as JSON, for any HTTP client: https://api.anyplot.ai/specs/boxen-basic/seaborn/code. Any spec id and library id listed in llms-full.txt fit the same URL shape; every URL below is complete and callable.
{
  "spec_id": "boxen-basic",
  "language": "python",
  "library": "seaborn",
  "page": "https://anyplot.ai/boxen-basic/python/seaborn",
  "hub": "https://anyplot.ai/boxen-basic",
  "code_json": "https://api.anyplot.ai/specs/boxen-basic/seaborn/code",
  "spec_json": "https://api.anyplot.ai/specs/boxen-basic",
  "render_light_png": "https://storage.googleapis.com/anyplot-images/plots/boxen-basic/python/seaborn/plot-light.png",
  "render_dark_png": "https://storage.googleapis.com/anyplot-images/plots/boxen-basic/python/seaborn/plot-dark.png",
  "quality_score": 90.0,
  "license": "MIT",
  "guide": "https://anyplot.ai/llms.txt"
}
Part of Basic Boxen Plot (Letter-Value Plot) on anyplot.ai.