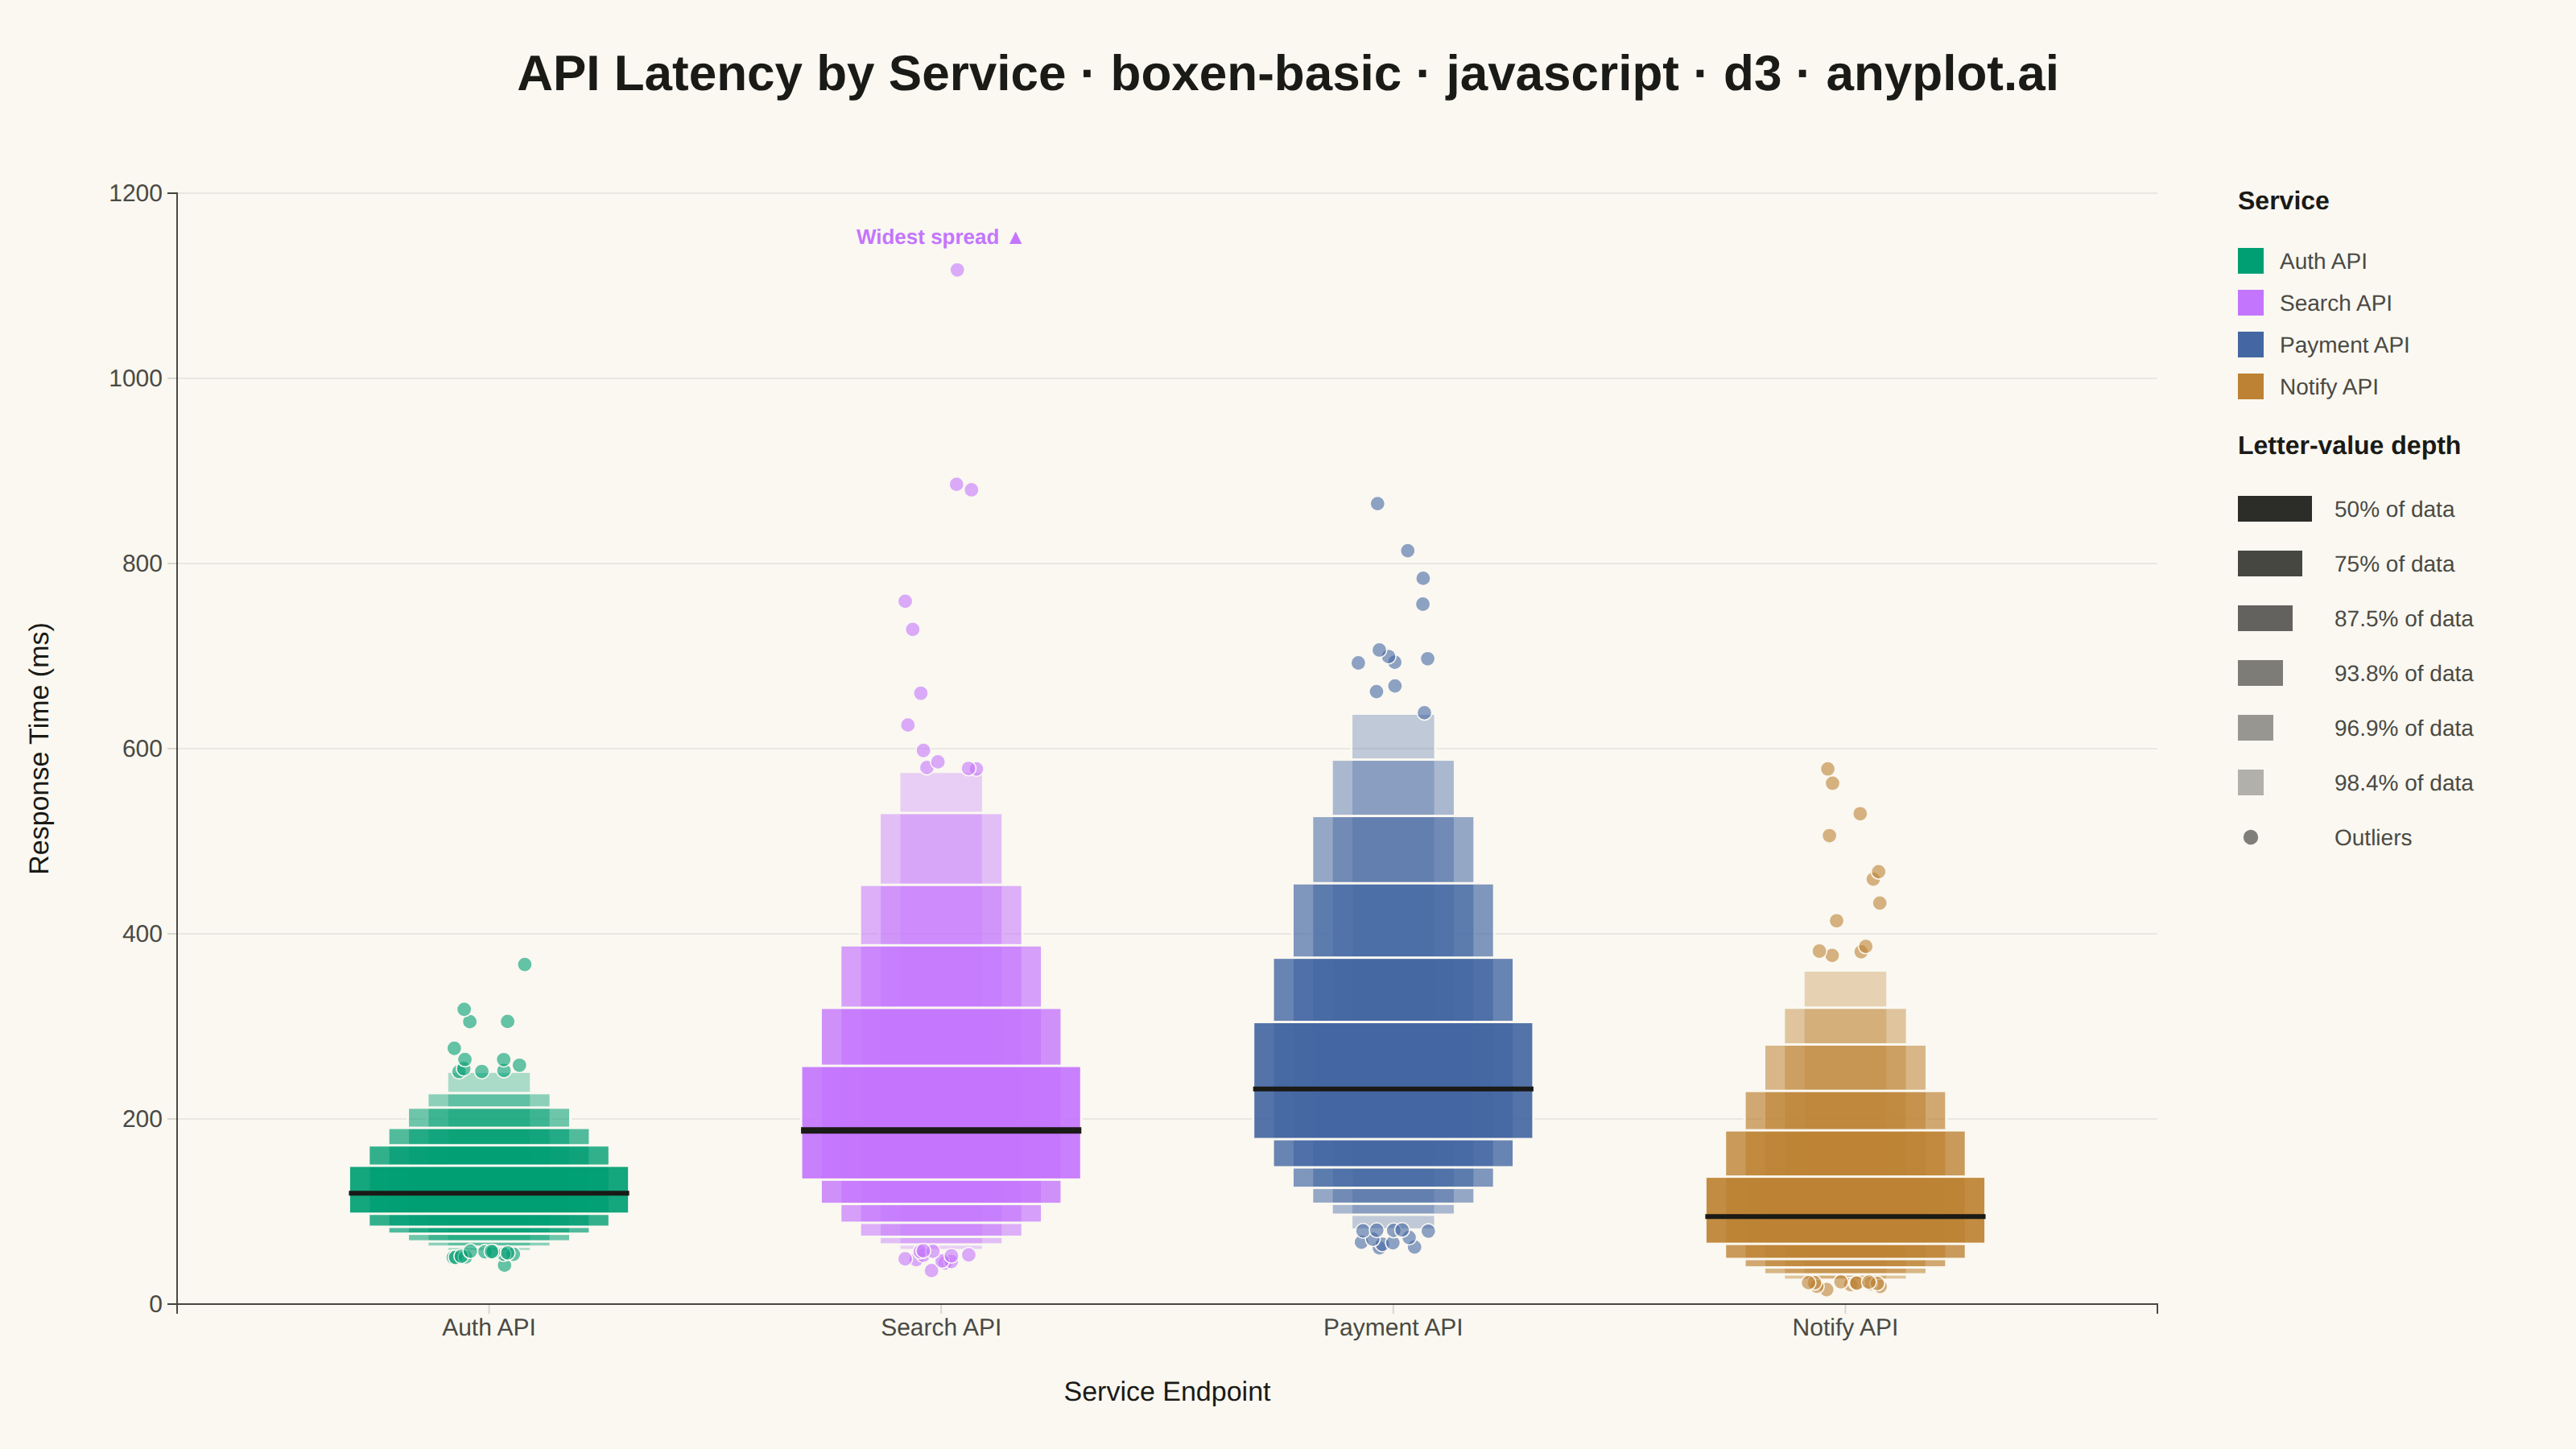
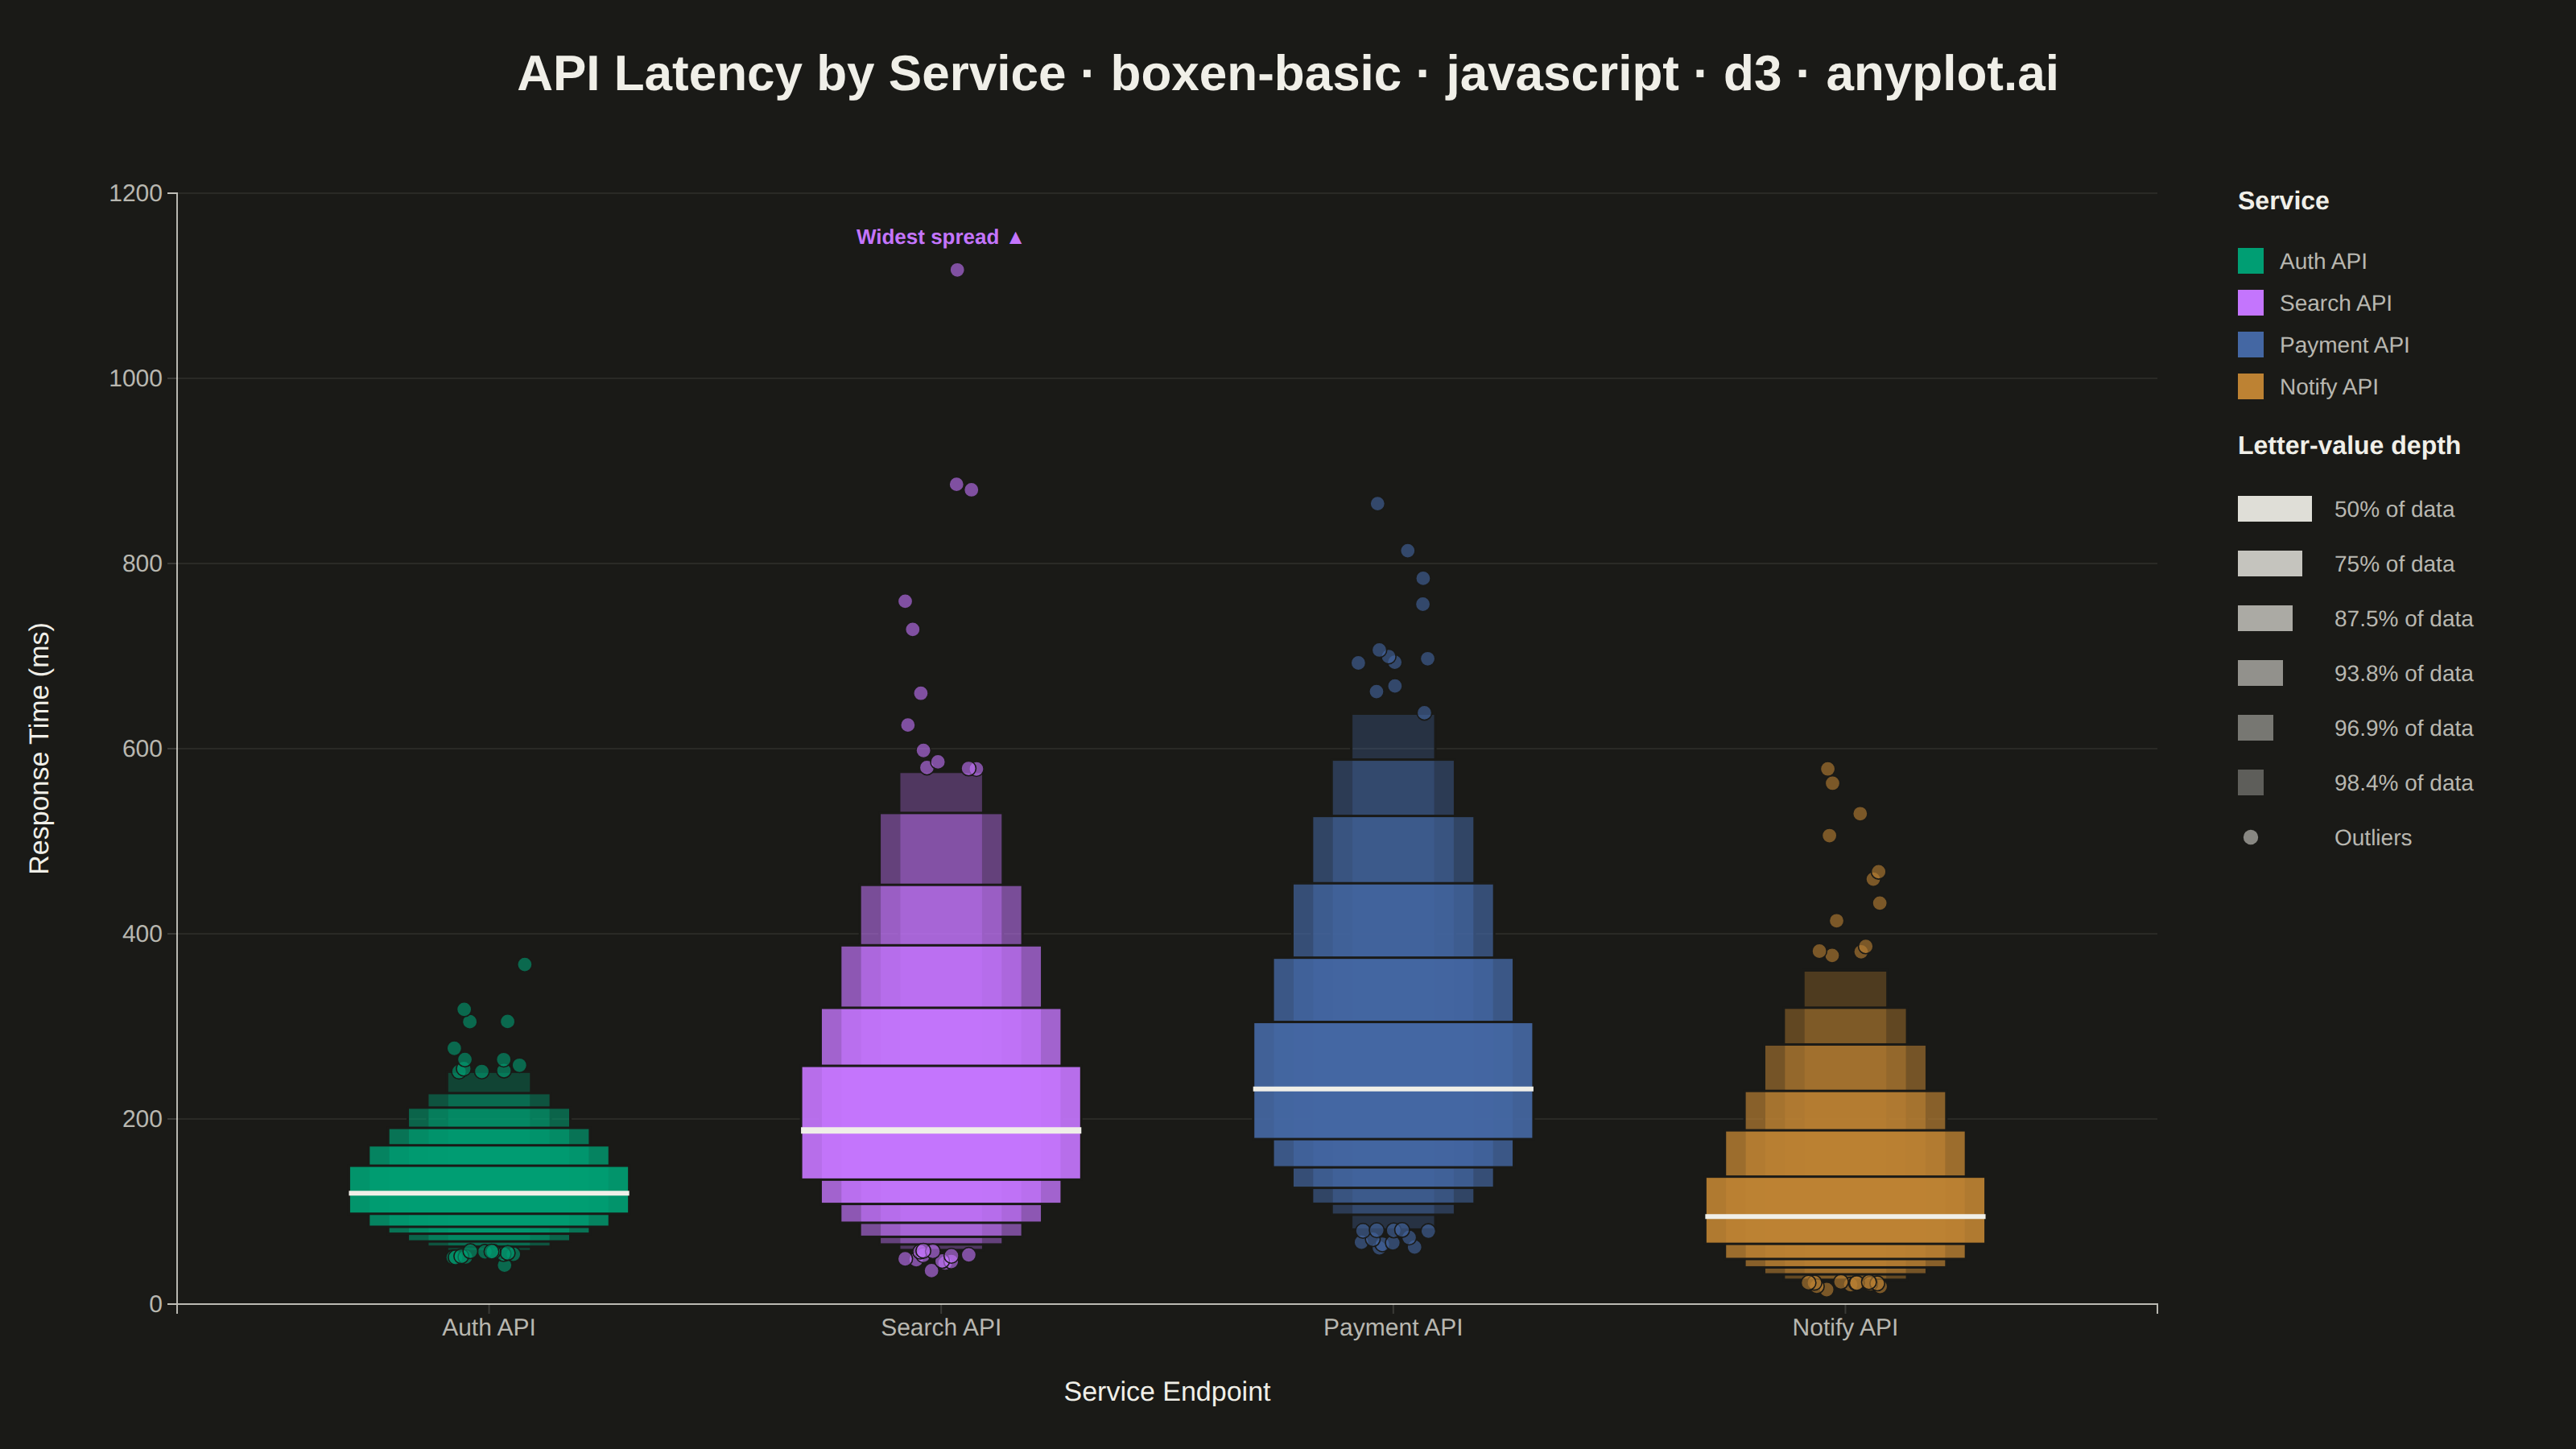
The same plot in 14 other libraries — JavaScript: Chart.js, Apache ECharts, Highcharts, MUI X Charts; Python: Altair, Bokeh, lets-plot, Matplotlib, Plotly, plotnine, Pygal, Seaborn; R: ggplot2; Julia: Makie.jl. Compare all 15 side by side: Basic Boxen Plot (Letter-Value Plot) in Python, R, Julia and JavaScript.
A boxen plot (also known as letter-value plot) extends the traditional box plot to show more quantile information, making it ideal for large datasets with 1000+ observations. Instead of just displaying the median and quartiles, it shows additional "letter values" (eighths, sixteenths, etc.) as nested boxes, revealing the full shape of the distribution including tail behavior. This makes outlier detection more meaningful and distribution comparison more detailed.
// anyplot.ai
// boxen-basic: Basic Boxen Plot (Letter-Value Plot)
// Library: d3 7.9.0 | JavaScript 22.23.2
// Quality: 92/100 | Created: 2026-09-01

const t = window.ANYPLOT_TOKENS;
const { width, height } = window.ANYPLOT_SIZE;
const margin = { top: 120, right: 260, bottom: 90, left: 110 };
const iw = width - margin.left - margin.right;
const ih = height - margin.top - margin.bottom;

// --- Data (in-memory, deterministic log-normal latency per service) --------
function makeLcg(seed) {
  let state = seed;
  return function () {
    state = (state * 1664525 + 1013904223) >>> 0;
    return state / 4294967296;
  };
}
const rand = makeLcg(42);
function randNormal() {
  const u1 = Math.max(rand(), 1e-9);
  const u2 = rand();
  return Math.sqrt(-2 * Math.log(u1)) * Math.cos(2 * Math.PI * u2);
}

const N = 1500;
const services = [
  { name: "Auth API", meanLog: Math.log(120), sdLog: 0.32 },
  { name: "Search API", meanLog: Math.log(185), sdLog: 0.48 },
  { name: "Payment API", meanLog: Math.log(230), sdLog: 0.42 },
  { name: "Notify API", meanLog: Math.log(95), sdLog: 0.58 },
];
const groups = services.map((s) => {
  const values = [];
  for (let i = 0; i < N; i++) {
    values.push(Math.exp(s.meanLog + s.sdLog * randNormal()));
  }
  values.sort((a, b) => a - b);
  return { name: s.name, values };
});

// --- Letter-value statistics -------------------------------------------------
function letterValueDepth(n) {
  return Math.min(6, Math.max(3, Math.floor(Math.log2(n)) - 3));
}
function letterValueStats(sortedValues) {
  const n = sortedValues.length;
  const k = letterValueDepth(n);
  const levels = [];
  for (let i = 1; i <= k; i++) {
    const pLow = Math.pow(0.5, i + 1);
    const pHigh = 1 - pLow;
    levels.push({
      depth: i,
      low: d3.quantileSorted(sortedValues, pLow),
      high: d3.quantileSorted(sortedValues, pHigh),
      coverage: pHigh - pLow,
    });
  }
  const median = d3.quantileSorted(sortedValues, 0.5);
  const deepest = levels[levels.length - 1];
  const outliers = sortedValues.filter((v) => v < deepest.low || v > deepest.high);
  return { median, levels, outliers, k };
}
const stats = groups.map((g) => letterValueStats(g.values));
const k = stats[0].k;
const spreads = groups.map((g) => d3.max(g.values) - d3.min(g.values));
const standoutIdx = spreads.indexOf(d3.max(spreads));

// --- Scales -------------------------------------------------------------------
const x = d3
  .scaleBand()
  .domain(groups.map((g) => g.name))
  .range([0, iw])
  .padding(0.38);

const allValues = groups.flatMap((g) => g.values);
const y = d3
  .scaleLinear()
  .domain([0, d3.max(allValues) * 1.05])
  .nice()
  .range([ih, 0]);

const widthScale = d3.scaleLinear().domain([1, k]).range([x.bandwidth(), x.bandwidth() * 0.3]);
const opacityScale = d3.scaleLinear().domain([1, k]).range([0.92, 0.32]);

// --- SVG mount ----------------------------------------------------------------
const svg = d3.select("#container").append("svg").attr("width", width).attr("height", height);
const g = svg.append("g").attr("transform", `translate(${margin.left},${margin.top})`);

// --- Axes -----------------------------------------------------------------
const xAxisG = g.append("g").attr("transform", `translate(0,${ih})`).call(d3.axisBottom(x));
const yAxisG = g.append("g").call(d3.axisLeft(y).ticks(6).tickFormat((v) => `${v}`));
for (const axG of [xAxisG, yAxisG]) {
  axG.selectAll("text").attr("fill", t.inkSoft).style("font-size", "15px");
  axG.selectAll("line").attr("stroke", t.grid);
  axG.select(".domain").attr("stroke", t.inkSoft);
}
g.append("g")
  .attr("class", "grid")
  .call(d3.axisLeft(y).ticks(6).tickSize(-iw).tickFormat(""))
  .selectAll("line")
  .attr("stroke", t.grid)
  .attr("stroke-opacity", 0.5);
g.select(".grid .domain").remove();

g.append("text")
  .attr("x", -ih / 2)
  .attr("y", -80)
  .attr("transform", "rotate(-90)")
  .attr("text-anchor", "middle")
  .attr("fill", t.ink)
  .style("font-size", "17px")
  .text("Response Time (ms)");

g.append("text")
  .attr("x", iw / 2)
  .attr("y", ih + 60)
  .attr("text-anchor", "middle")
  .attr("fill", t.ink)
  .style("font-size", "17px")
  .text("Service Endpoint");

// --- Boxen (letter-value) boxes ------------------------------------------------
groups.forEach((grp, idx) => {
  const color = t.palette[idx % t.palette.length];
  const cx = x(grp.name) + x.bandwidth() / 2;
  const s = stats[idx];
  const cell = g.append("g");

  // Draw from the deepest (widest y-span, narrowest box) up to the innermost
  // (narrowest y-span, widest box) so each subsequent box is not hidden.
  for (let i = s.levels.length - 1; i >= 0; i--) {
    const lvl = s.levels[i];
    const w = widthScale(lvl.depth);
    cell
      .append("rect")
      .attr("x", cx - w / 2)
      .attr("y", y(lvl.high))
      .attr("width", w)
      .attr("height", Math.max(1, y(lvl.low) - y(lvl.high)))
      .attr("fill", color)
      .attr("fill-opacity", opacityScale(lvl.depth))
      .attr("stroke", t.pageBg)
      .attr("stroke-width", 1.5);
  }

  // Median line spans the widest (innermost) box; the standout group gets a
  // bolder line as a subtle storytelling cue.
  const innerWidth = widthScale(1);
  cell
    .append("line")
    .attr("x1", cx - innerWidth / 2)
    .attr("x2", cx + innerWidth / 2)
    .attr("y1", y(s.median))
    .attr("y2", y(s.median))
    .attr("stroke", t.ink)
    .attr("stroke-width", idx === standoutIdx ? 4 : 3);

  // Outliers beyond the deepest letter value, jittered deterministically.
  const jitterWidth = widthScale(k) * 0.9;
  cell
    .selectAll("circle")
    .data(s.outliers)
    .join("circle")
    .attr("cx", (v) => cx + (((v * 97) % 1) - 0.5) * jitterWidth)
    .attr("cy", (v) => y(v))
    .attr("r", 4.6)
    .attr("fill", color)
    .attr("fill-opacity", 0.6)
    .attr("stroke", t.pageBg)
    .attr("stroke-width", 0.8);

  // Callout on the group with the widest overall spread.
  if (idx === standoutIdx) {
    const topY = Math.max(12, y(d3.max(grp.values)) - 16);
    cell
      .append("text")
      .attr("x", cx)
      .attr("y", topY)
      .attr("text-anchor", "middle")
      .attr("fill", color)
      .style("font-size", "13px")
      .style("font-weight", "600")
      .text("Widest spread ▲");
  }
});

// --- Legend: service colors + quantile depth encoding --------------------------
const legend = svg.append("g").attr("transform", `translate(${margin.left + iw + 50},${margin.top + 10})`);
legend
  .append("text")
  .attr("x", 0)
  .attr("y", 0)
  .attr("fill", t.ink)
  .style("font-size", "16px")
  .style("font-weight", "600")
  .text("Service");

const catRowHeight = 26;
groups.forEach((grp, i) => {
  const rowY = 24 + i * catRowHeight;
  legend
    .append("rect")
    .attr("x", 0)
    .attr("y", rowY)
    .attr("width", 16)
    .attr("height", 16)
    .attr("fill", t.palette[i % t.palette.length]);
  legend
    .append("text")
    .attr("x", 26)
    .attr("y", rowY + 13)
    .attr("fill", t.inkSoft)
    .style("font-size", "14px")
    .text(grp.name);
});

const depthLegendY = 24 + groups.length * catRowHeight + 24;
legend
  .append("text")
  .attr("x", 0)
  .attr("y", depthLegendY)
  .attr("fill", t.ink)
  .style("font-size", "16px")
  .style("font-weight", "600")
  .text("Letter-value depth");

const legendRowHeight = 34;
for (let i = 1; i <= k; i++) {
  const rowY = depthLegendY + 26 + (i - 1) * legendRowHeight;
  const swatchW = 16 + (k - i) * 6;
  const coverage = stats[0].levels[i - 1].coverage;
  legend
    .append("rect")
    .attr("x", 0)
    .attr("y", rowY)
    .attr("width", swatchW)
    .attr("height", 16)
    .attr("fill", t.ink)
    .attr("fill-opacity", opacityScale(i));
  legend
    .append("text")
    .attr("x", 60)
    .attr("y", rowY + 13)
    .attr("fill", t.inkSoft)
    .style("font-size", "14px")
    .text(`${(coverage * 100).toFixed(1).replace(/\.0$/, "")}% of data`);
}
const outlierRowY = depthLegendY + 26 + k * legendRowHeight;
legend
  .append("circle")
  .attr("cx", 8)
  .attr("cy", outlierRowY + 8)
  .attr("r", 4.6)
  .attr("fill", t.inkSoft)
  .attr("fill-opacity", 0.7);
legend
  .append("text")
  .attr("x", 60)
  .attr("y", outlierRowY + 13)
  .attr("fill", t.inkSoft)
  .style("font-size", "14px")
  .text("Outliers");

// --- Title --------------------------------------------------------------------
// Sized against the real rendered text width (Chromium layout, not a character-
// count guess) so it reliably fills ~60% of the canvas width.
const title = "API Latency by Service · boxen-basic · javascript · d3 · anyplot.ai";
const baseTitleSize = 26;
const titleText = svg
  .append("text")
  .attr("x", width / 2)
  .attr("y", 56)
  .attr("text-anchor", "middle")
  .attr("fill", t.ink)
  .style("font-size", `${baseTitleSize}px`)
  .style("font-weight", "600")
  .text(title);
const measuredWidth = titleText.node().getComputedTextLength();
const fittedTitleSize = Math.min(32, Math.max(18, Math.round((baseTitleSize * (width * 0.6)) / measuredWidth)));
titleText.style("font-size", `${fittedTitleSize}px`);
Runnable source as JSON, for any HTTP client: https://api.anyplot.ai/specs/boxen-basic/d3/code. Any spec id and library id listed in llms-full.txt fit the same URL shape; every URL below is complete and callable.
{
  "spec_id": "boxen-basic",
  "language": "javascript",
  "library": "d3",
  "page": "https://anyplot.ai/boxen-basic/javascript/d3",
  "hub": "https://anyplot.ai/boxen-basic",
  "code_json": "https://api.anyplot.ai/specs/boxen-basic/d3/code",
  "spec_json": "https://api.anyplot.ai/specs/boxen-basic",
  "render_light_png": "https://storage.googleapis.com/anyplot-images/plots/boxen-basic/javascript/d3/plot-light.png",
  "render_dark_png": "https://storage.googleapis.com/anyplot-images/plots/boxen-basic/javascript/d3/plot-dark.png",
  "interactive_light_html": "https://storage.googleapis.com/anyplot-images/plots/boxen-basic/javascript/d3/plot-light.html",
  "interactive_dark_html": "https://storage.googleapis.com/anyplot-images/plots/boxen-basic/javascript/d3/plot-dark.html",
  "quality_score": 92.0,
  "license": "MIT",
  "guide": "https://anyplot.ai/llms.txt"
}
Part of Basic Boxen Plot (Letter-Value Plot) on anyplot.ai.