The same plot in 14 other libraries — JavaScript: Chart.js, Apache ECharts, Highcharts, MUI X Charts; Python: Altair, Bokeh, lets-plot, Matplotlib, Plotly, plotnine, Pygal, Seaborn; R: ggplot2; Julia: Makie.jl. Compare all 15 side by side: Basic Bullet Chart in Python, R, Julia and JavaScript.
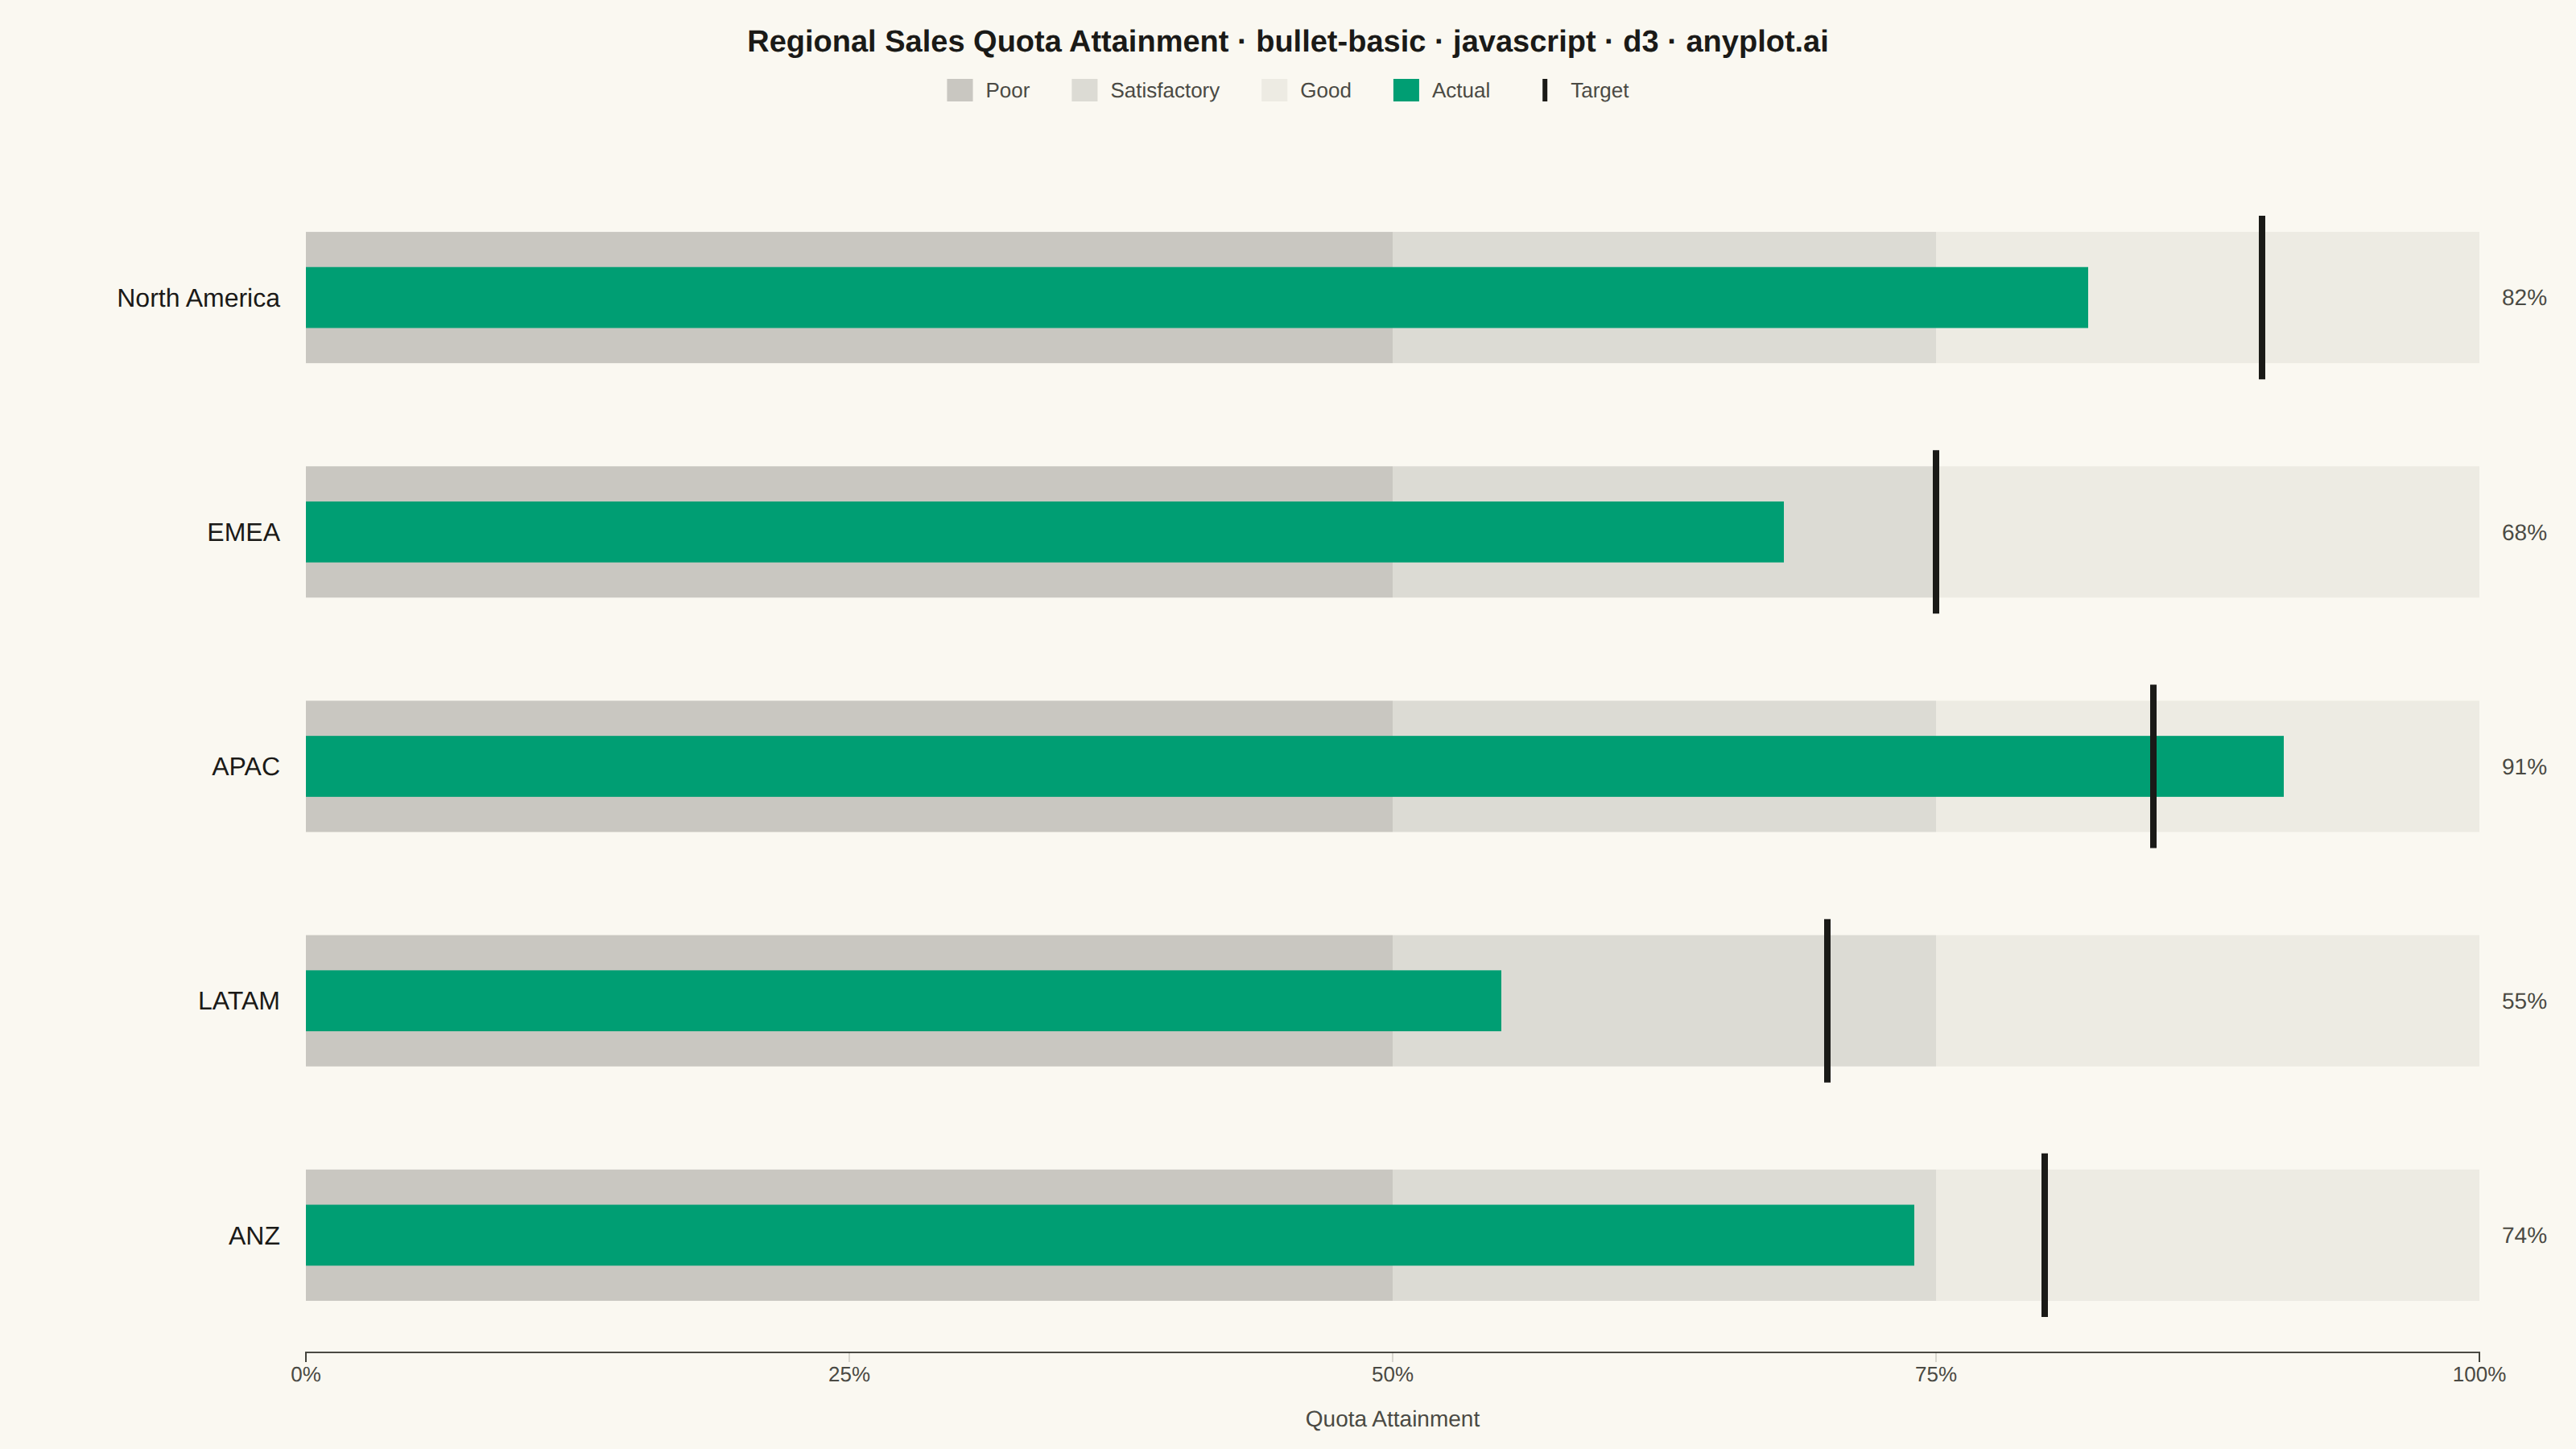
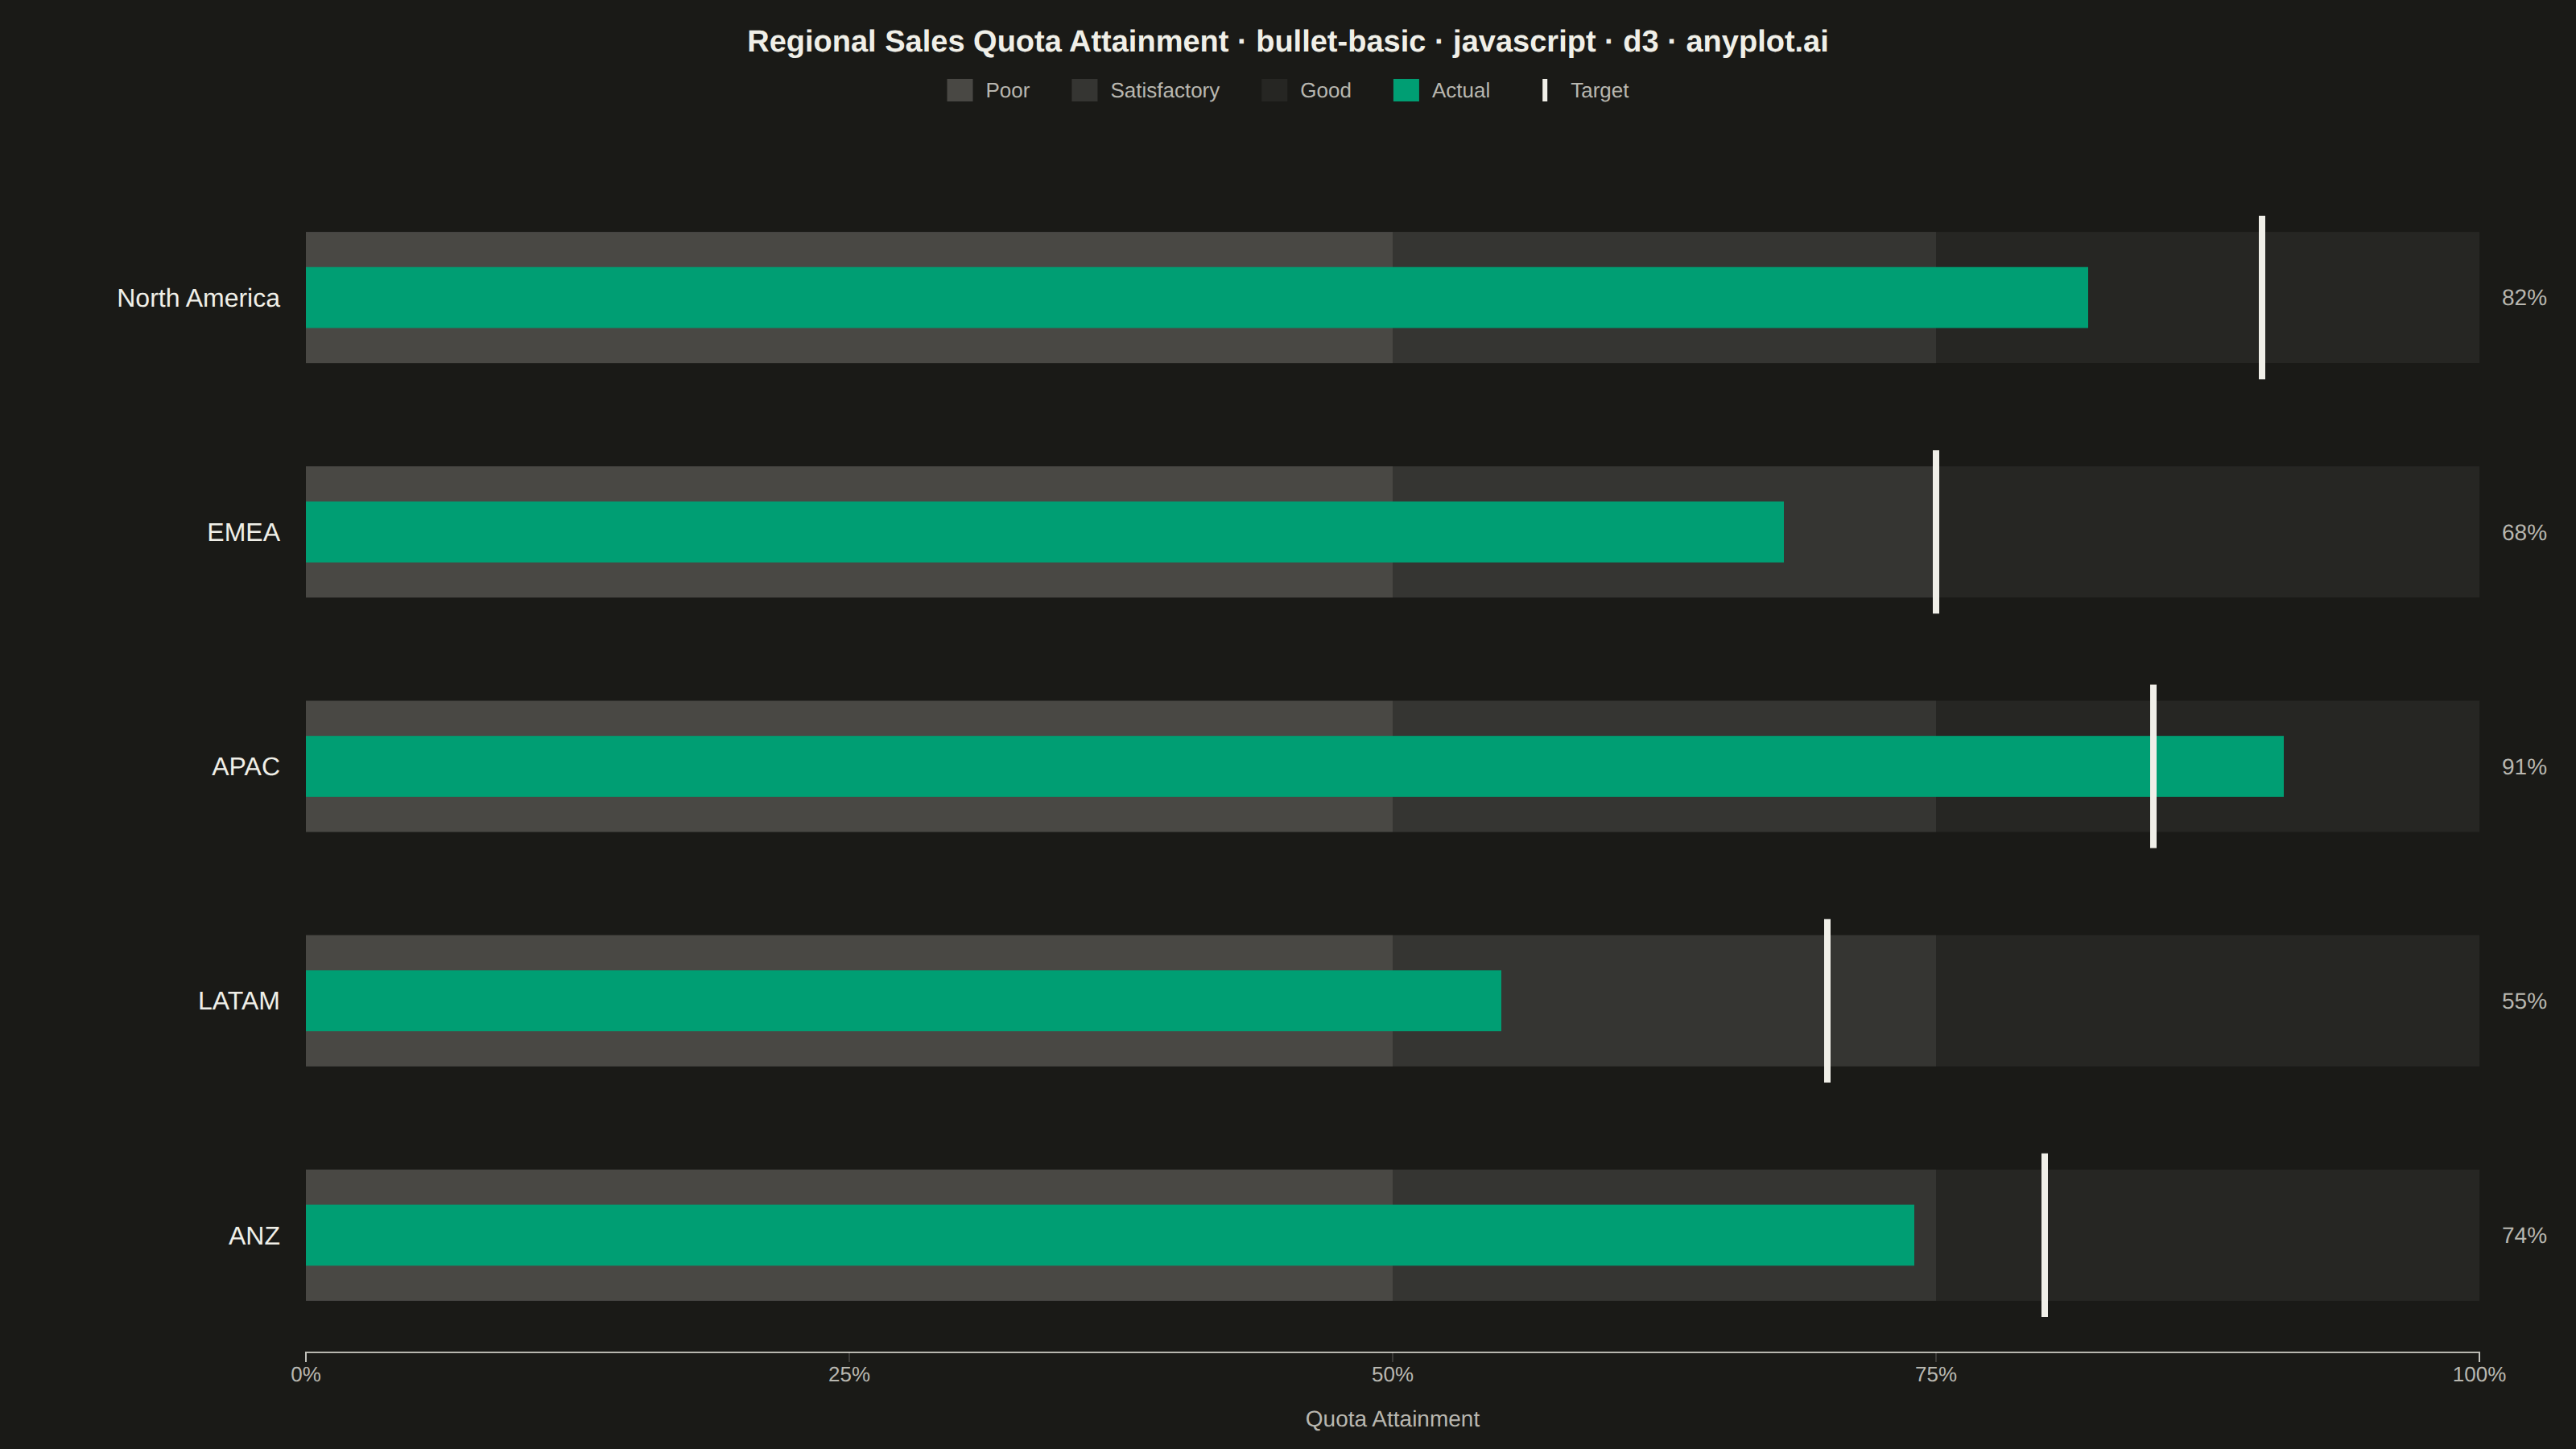
A bullet chart displays a single measure against qualitative ranges and a target marker, designed by Stephen Few as a space-efficient alternative to gauge charts. The linear format shows actual performance as a bar, a target as a vertical marker, and background bands representing qualitative ranges (poor/satisfactory/good). Its compact design allows multiple bullet charts to fit on a single dashboard for easy comparison across metrics.
// anyplot.ai
// bullet-basic: Basic Bullet Chart
// Library: d3 7.9.0 | JavaScript 22.23.2
// Quality: 84/100 | Created: 2026-08-24

const t = window.ANYPLOT_TOKENS;
const { width, height } = window.ANYPLOT_SIZE;

// --- Data (in-memory, deterministic) ----------------------------------------
// Regional sales-quota attainment: actual % vs. target %, all bullets share
// the same poor/satisfactory/good scale so they compare directly.
const ranges = [50, 75, 100]; // poor | satisfactory | good thresholds (%)
const regions = [
  { label: "North America", actual: 82, target: 90 },
  { label: "EMEA", actual: 68, target: 75 },
  { label: "APAC", actual: 91, target: 85 },
  { label: "LATAM", actual: 55, target: 70 },
  { label: "ANZ", actual: 74, target: 80 },
];

// --- SVG mount ----------------------------------------------------------------
const margin = { top: 112, right: 60, bottom: 60, left: 190 };
const iw = width - margin.left - margin.right;
const ih = height - margin.top - margin.bottom;

const svg = d3.select("#container").append("svg").attr("width", width).attr("height", height);
const g = svg.append("g").attr("transform", `translate(${margin.left},${margin.top})`);

// --- Scale --------------------------------------------------------------------
const x = d3.scaleLinear().domain([0, ranges[ranges.length - 1]]).range([0, iw]);

// --- Rows -----------------------------------------------------------------------
const rowHeight = ih / regions.length;
const bandHeight = rowHeight * 0.56;
const barHeight = rowHeight * 0.26;
const bandOpacity = [0.22, 0.13, 0.11]; // poor -> good, still legible on the darkest theme

// The region furthest below target gets a callout treatment.
const worstLabel = regions.reduce((a, b) => (a.actual - a.target < b.actual - b.target ? a : b)).label;

const row = g
  .selectAll(".row")
  .data(regions)
  .join("g")
  .attr("class", "row")
  .attr("transform", (d, i) => `translate(0,${i * rowHeight + rowHeight / 2})`);

// Qualitative range bands: nested data-join, one segment per range edge.
row.each(function (d) {
  let prev = 0;
  const segments = ranges.map((edge, i) => {
    const seg = { x0: prev, x1: edge, opacity: bandOpacity[i] };
    prev = edge;
    return seg;
  });
  d3.select(this)
    .selectAll("rect.band")
    .data(segments)
    .join("rect")
    .attr("class", "band")
    .attr("x", (s) => x(s.x0))
    .attr("y", -bandHeight / 2)
    .attr("width", (s) => x(s.x1) - x(s.x0))
    .attr("height", bandHeight)
    .attr("fill", t.ink)
    .attr("fill-opacity", (s) => s.opacity);
});

// Actual measure bar
row
  .append("rect")
  .attr("x", 0)
  .attr("y", -barHeight / 2)
  .attr("width", (d) => x(d.actual))
  .attr("height", barHeight)
  .attr("fill", t.palette[0])
  .append("title")
  .text((d) => `${d.label}: ${d.actual}% actual`);

// Target marker: vertical stem capped with diamonds, a shape distinct from the bar/bands.
const markerHalf = bandHeight / 2 + 10;
const diamond = 7;
row
  .append("line")
  .attr("x1", (d) => x(d.target))
  .attr("x2", (d) => x(d.target))
  .attr("y1", -markerHalf)
  .attr("y2", markerHalf)
  .attr("stroke", t.ink)
  .attr("stroke-width", 3);
row
  .append("path")
  .attr(
    "d",
    (d) =>
      `M ${x(d.target)} ${-markerHalf - diamond} L ${x(d.target) + diamond} ${-markerHalf} L ${x(d.target)} ${-markerHalf + diamond} L ${x(d.target) - diamond} ${-markerHalf} Z`,
  )
  .attr("fill", t.ink);
row
  .append("path")
  .attr(
    "d",
    (d) =>
      `M ${x(d.target)} ${markerHalf - diamond} L ${x(d.target) + diamond} ${markerHalf} L ${x(d.target)} ${markerHalf + diamond} L ${x(d.target) - diamond} ${markerHalf} Z`,
  )
  .attr("fill", t.ink)
  .append("title")
  .text((d) => `${d.label}: ${d.target}% target`);

// Row label — the region furthest below target gets a callout treatment.
row
  .append("text")
  .attr("x", -16)
  .attr("y", 0)
  .attr("dy", "0.35em")
  .attr("text-anchor", "end")
  .attr("fill", (d) => (d.label === worstLabel ? t.amber : t.ink))
  .style("font-size", "16px")
  .style("font-weight", (d) => (d.label === worstLabel ? "700" : "500"))
  .text((d) => (d.label === worstLabel ? `${d.label} ▾` : d.label));

// Actual-value readout
row
  .append("text")
  .attr("x", iw + 14)
  .attr("y", 0)
  .attr("dy", "0.35em")
  .attr("text-anchor", "start")
  .attr("fill", t.inkSoft)
  .style("font-size", "14px")
  .style("font-variant-numeric", "tabular-nums")
  .text((d) => `${d.actual}%`);

// --- Axis -----------------------------------------------------------------------
const xAxis = g
  .append("g")
  .attr("transform", `translate(0,${ih})`)
  .call(d3.axisBottom(x).tickValues([0, 25, 50, 75, 100]).tickFormat((v) => `${v}%`));
xAxis.selectAll("text").attr("fill", t.inkSoft).style("font-size", "13px");
xAxis.selectAll("line").attr("stroke", t.grid);
xAxis.select(".domain").attr("stroke", t.inkSoft);

g.append("text")
  .attr("x", iw / 2)
  .attr("y", ih + 46)
  .attr("text-anchor", "middle")
  .attr("fill", t.inkSoft)
  .style("font-size", "14px")
  .text("Quota Attainment");

// --- Legend ---------------------------------------------------------------------
const legendItems = [
  { type: "band", color: t.ink, opacity: bandOpacity[0], text: "Poor" },
  { type: "band", color: t.ink, opacity: bandOpacity[1], text: "Satisfactory" },
  { type: "band", color: t.ink, opacity: bandOpacity[2], text: "Good" },
  { type: "bar", color: t.palette[0], text: "Actual" },
  { type: "line", color: t.ink, text: "Target" },
];

const legend = svg.append("g").attr("transform", `translate(0,56)`);
let lx = 0;
for (const item of legendItems) {
  const li = legend.append("g").attr("transform", `translate(${lx},0)`);
  if (item.type === "line") {
    li.append("line").attr("x1", 8).attr("x2", 8).attr("y1", -7).attr("y2", 7).attr("stroke", item.color).attr("stroke-width", 3);
    li.append("path").attr("d", "M 8 -10 L 12 -7 L 8 -4 L 4 -7 Z").attr("fill", item.color);
  } else {
    li.append("rect")
      .attr("x", 0)
      .attr("y", -7)
      .attr("width", 16)
      .attr("height", 14)
      .attr("fill", item.color)
      .attr("fill-opacity", item.opacity ?? 1);
  }
  const label = li
    .append("text")
    .attr("x", 24)
    .attr("y", 0)
    .attr("dy", "0.35em")
    .attr("fill", t.inkSoft)
    .style("font-size", "13px")
    .text(item.text);
  lx += 24 + label.node().getComputedTextLength() + 26;
}
const legendWidth = lx - 26;
legend.attr("transform", `translate(${(width - legendWidth) / 2},56)`);

// --- Title ------------------------------------------------------------------------
const title = "Regional Sales Quota Attainment · bullet-basic · javascript · d3 · anyplot.ai";
const titleFontSize = Math.max(15, Math.round(22 * Math.min(1, 67 / title.length)));
svg
  .append("text")
  .attr("x", width / 2)
  .attr("y", 32)
  .attr("text-anchor", "middle")
  .attr("fill", t.ink)
  .style("font-size", `${titleFontSize}px`)
  .style("font-weight", "600")
  .text(title);
Runnable source as JSON, for any HTTP client: https://api.anyplot.ai/specs/bullet-basic/d3/code. Any spec id and library id listed in llms-full.txt fit the same URL shape; every URL below is complete and callable.
{
  "spec_id": "bullet-basic",
  "language": "javascript",
  "library": "d3",
  "page": "https://anyplot.ai/bullet-basic/javascript/d3",
  "hub": "https://anyplot.ai/bullet-basic",
  "code_json": "https://api.anyplot.ai/specs/bullet-basic/d3/code",
  "spec_json": "https://api.anyplot.ai/specs/bullet-basic",
  "render_light_png": "https://storage.googleapis.com/anyplot-images/plots/bullet-basic/javascript/d3/plot-light.png",
  "render_dark_png": "https://storage.googleapis.com/anyplot-images/plots/bullet-basic/javascript/d3/plot-dark.png",
  "interactive_light_html": "https://storage.googleapis.com/anyplot-images/plots/bullet-basic/javascript/d3/plot-light.html",
  "interactive_dark_html": "https://storage.googleapis.com/anyplot-images/plots/bullet-basic/javascript/d3/plot-dark.html",
  "quality_score": 84.0,
  "license": "MIT",
  "guide": "https://anyplot.ai/llms.txt"
}
Part of Basic Bullet Chart on anyplot.ai.