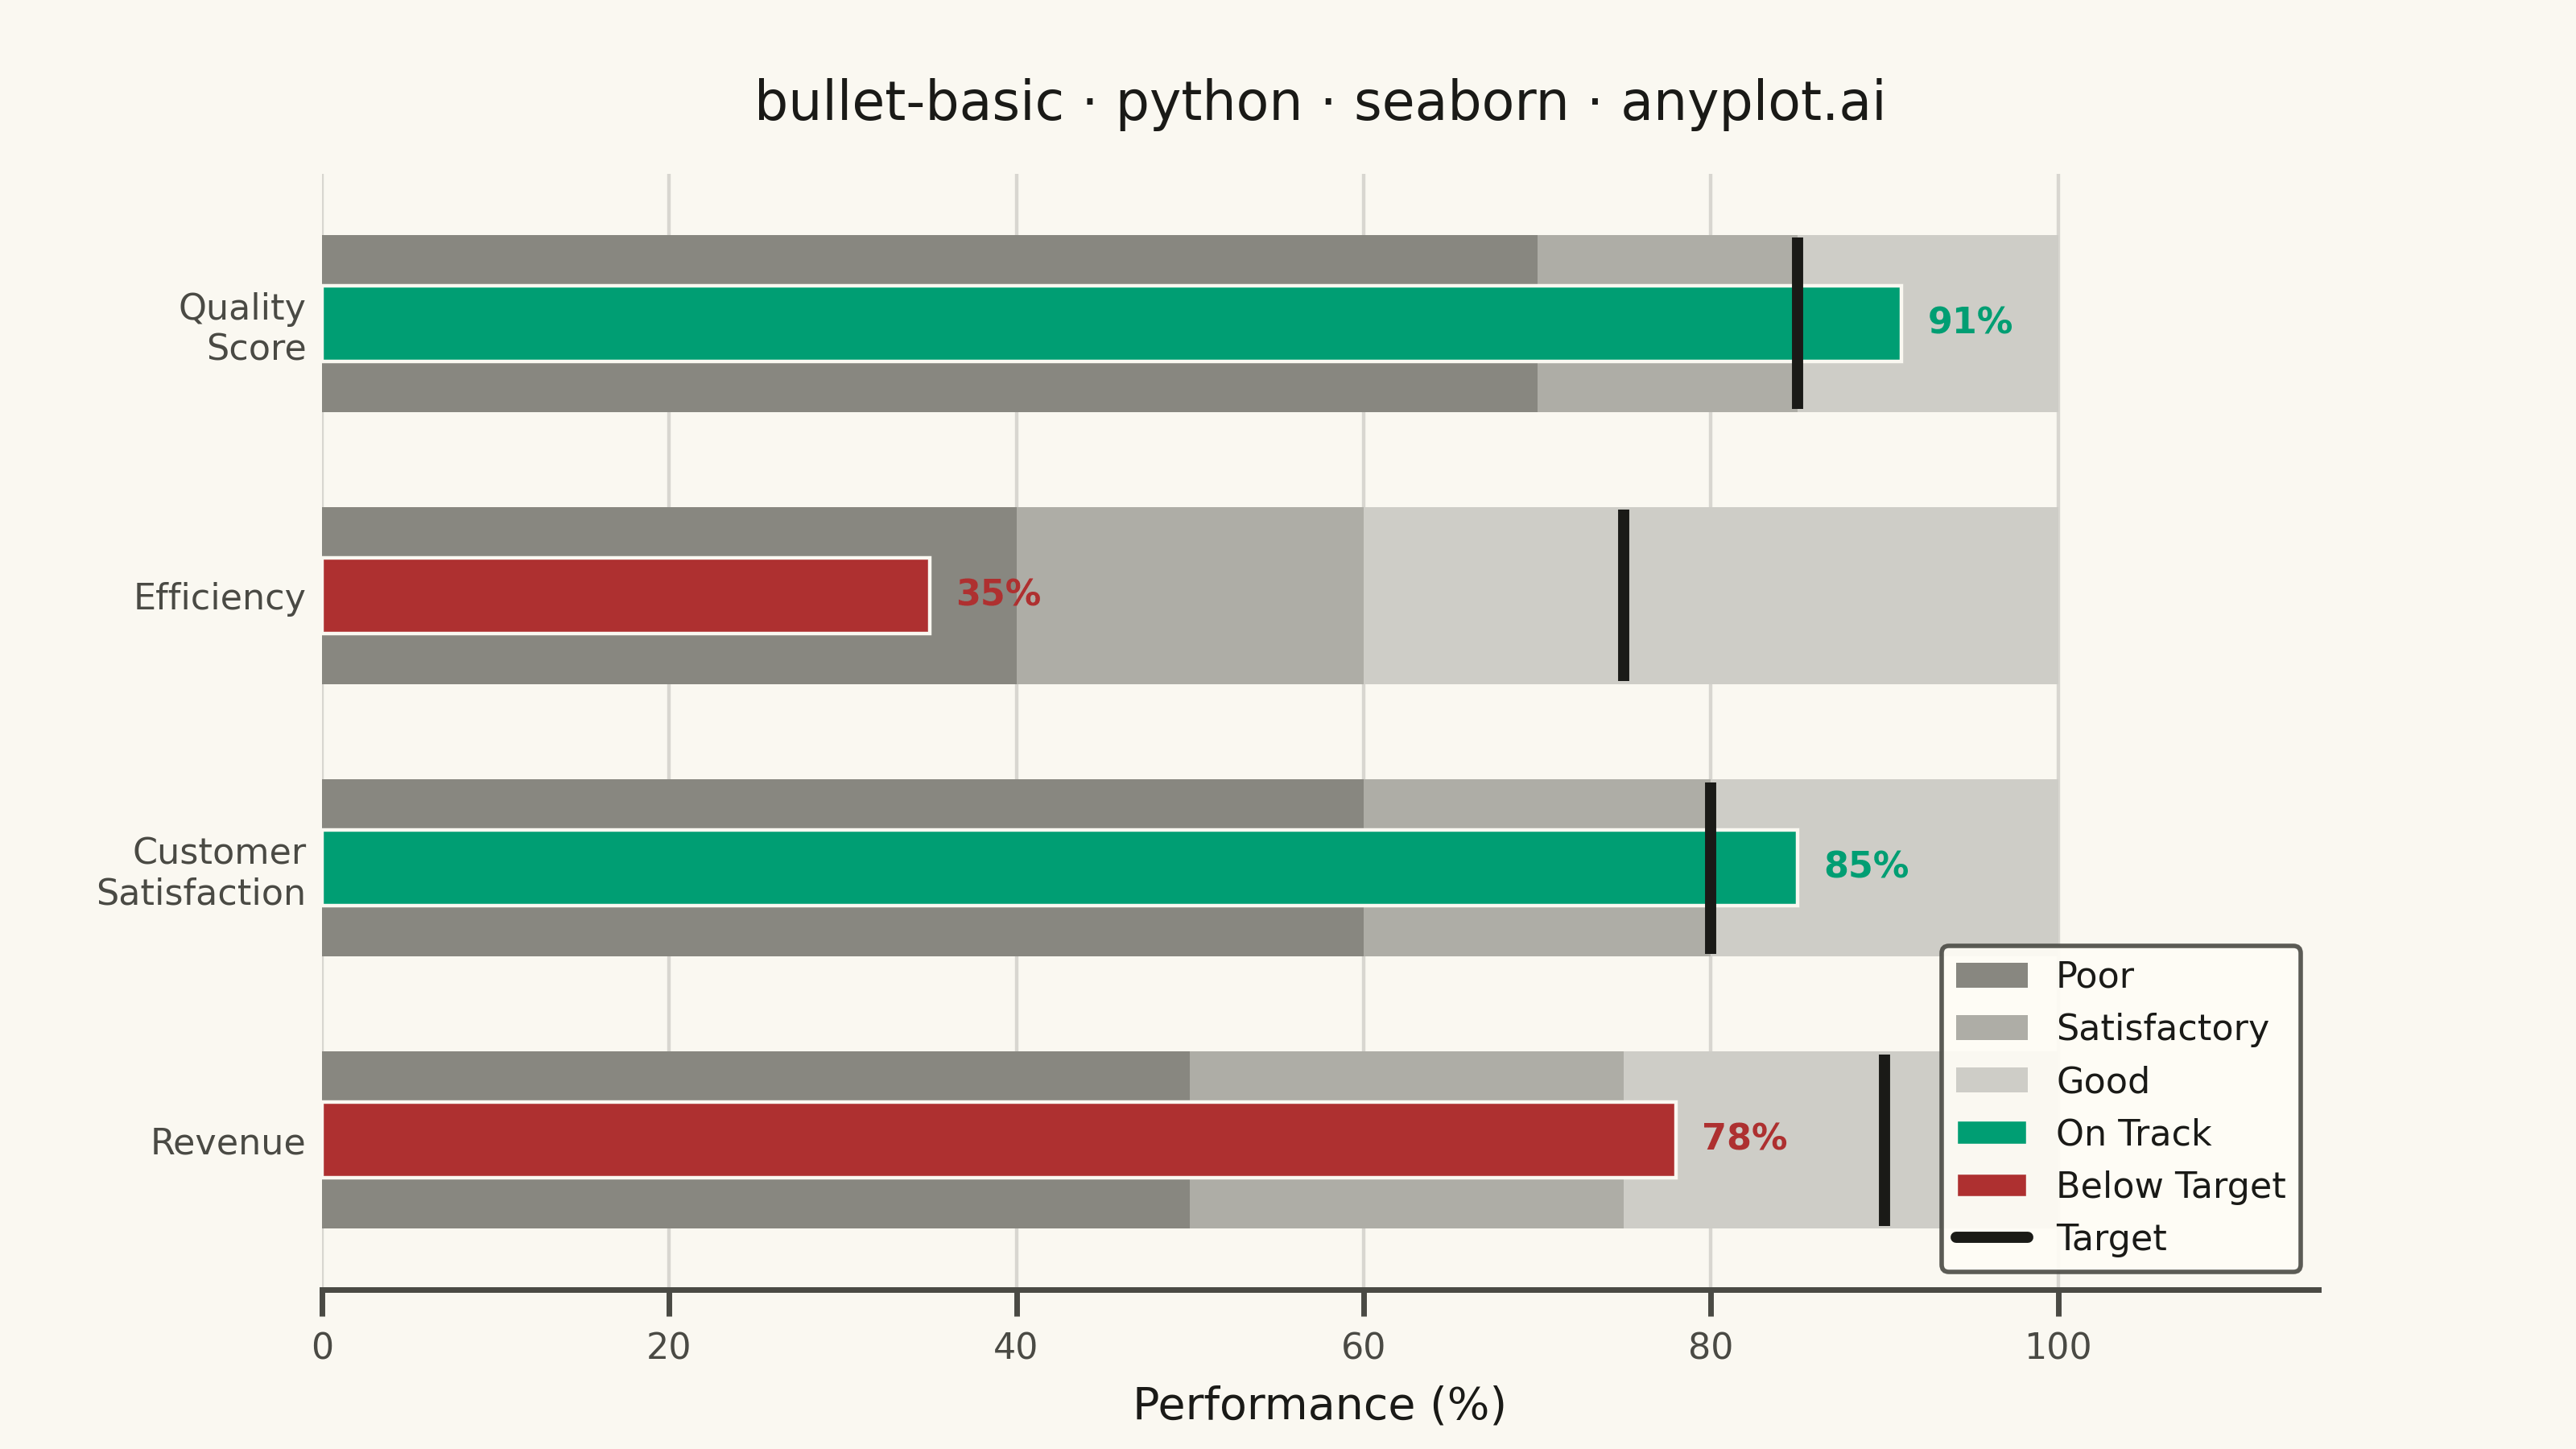
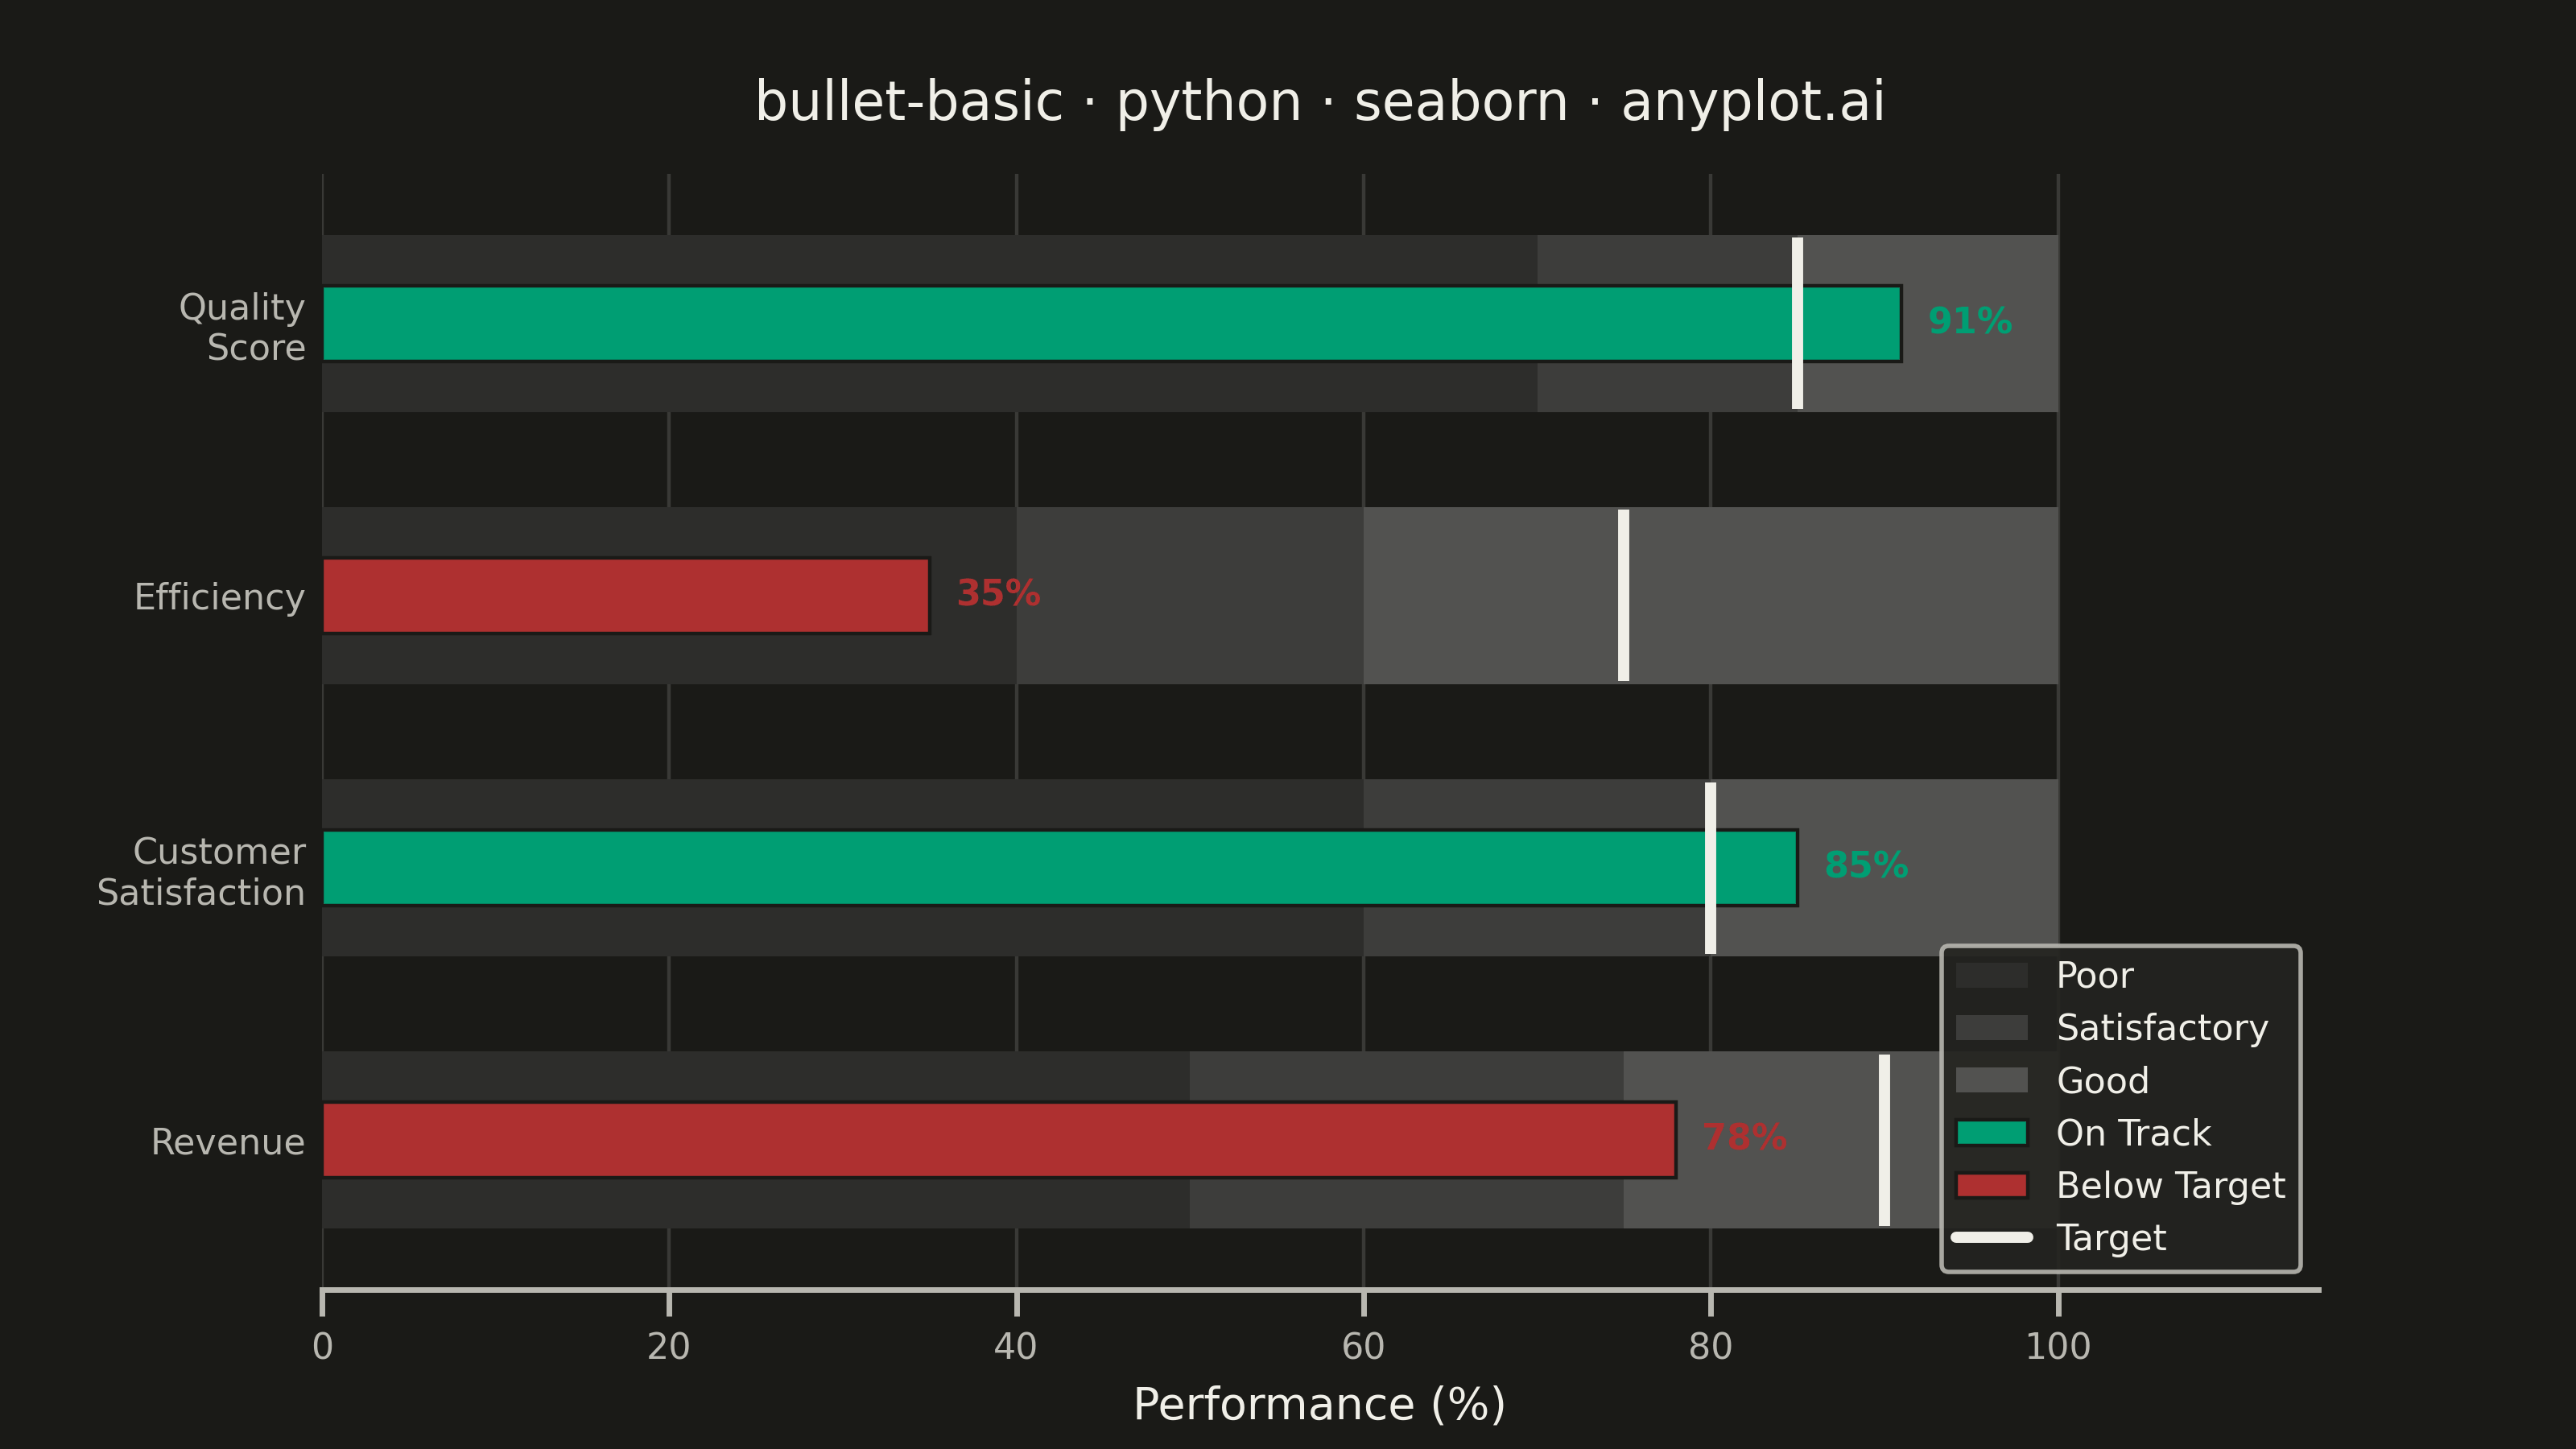
A bullet chart displays a single measure against qualitative ranges and a target marker, designed by Stephen Few as a space-efficient alternative to gauge charts. The linear format shows actual performance as a bar, a target as a vertical marker, and background bands representing qualitative ranges (poor/satisfactory/good). Its compact design allows multiple bullet charts to fit on a single dashboard for easy comparison across metrics.
""" anyplot.ai
bullet-basic: Basic Bullet Chart
Library: seaborn 0.13.2 | Python 3.13.13
Quality: 89/100 | Updated: 2026-05-29
"""

import os

import matplotlib.patches as mpatches
import matplotlib.pyplot as plt
import seaborn as sns


# Theme tokens
THEME = os.getenv("ANYPLOT_THEME", "light")
PAGE_BG = "#FAF8F1" if THEME == "light" else "#1A1A17"
ELEVATED_BG = "#FFFDF6" if THEME == "light" else "#242420"
INK = "#1A1A17" if THEME == "light" else "#F0EFE8"
INK_SOFT = "#4A4A44" if THEME == "light" else "#B8B7B0"

# Imprint palette — semantic exception: green = on-track (pass), red = below-target (fail)
ON_TRACK_COLOR = "#009E73"  # Imprint position 1 — green maps to success/pass
BELOW_TARGET_COLOR = "#AE3030"  # Imprint position 5 — matte red for fail/loss

# Grayscale range bands (theme-adaptive) — spec recommends grayscale to focus attention on bars
if THEME == "light":
    BAND_GOOD = "#CECDC7"
    BAND_SATISFACTORY = "#AEADA6"
    BAND_POOR = "#888780"
else:
    BAND_GOOD = "#525250"
    BAND_SATISFACTORY = "#3D3D3B"
    BAND_POOR = "#353532"  # lightened for better dark-mode band differentiation

# Data — department KPI dashboard with varied performance scenarios
metrics = ["Revenue", "Customer\nSatisfaction", "Efficiency", "Quality\nScore"]
actuals = [78, 85, 35, 91]
targets = [90, 80, 75, 85]
ranges_list = [
    [50, 75, 100],  # Revenue
    [60, 80, 100],  # Customer Satisfaction
    [40, 60, 100],  # Efficiency
    [70, 85, 100],  # Quality Score
]
status = ["On Track" if a >= t else "Below Target" for a, t in zip(actuals, targets, strict=True)]
status_palette = {"On Track": ON_TRACK_COLOR, "Below Target": BELOW_TARGET_COLOR}

# Configure seaborn theme with theme-adaptive chrome
sns.set_theme(
    style="ticks",
    rc={
        "figure.facecolor": PAGE_BG,
        "axes.facecolor": PAGE_BG,
        "axes.edgecolor": INK_SOFT,
        "axes.labelcolor": INK,
        "text.color": INK,
        "xtick.color": INK_SOFT,
        "ytick.color": INK_SOFT,
        "grid.color": INK,
        "grid.alpha": 0.15,
        "legend.facecolor": ELEVATED_BG,
        "legend.edgecolor": INK_SOFT,
    },
)

fig, ax = plt.subplots(figsize=(8, 4.5), dpi=400, facecolor=PAGE_BG)
ax.set_facecolor(PAGE_BG)

n_metrics = len(metrics)
range_height = 0.65
band_colors = [BAND_POOR, BAND_SATISFACTORY, BAND_GOOD]

# Qualitative range bands via ax.barh for reliable left-offset positioning
for i, ranges in enumerate(ranges_list):
    prev = 0
    for end, color in zip(ranges, band_colors, strict=True):
        ax.barh(i, end - prev, left=prev, height=range_height, color=color, edgecolor="none", zorder=1)
        prev = end

# Actual value bars — seaborn-native barplot, narrower than background bands
n_patches_before = len(ax.patches)
sns.barplot(
    y=list(range(n_metrics)),
    x=actuals,
    hue=status,
    palette=status_palette,
    width=0.28,
    orient="h",
    ax=ax,
    native_scale=True,
    dodge=False,
    errorbar=None,
    saturation=1.0,
    legend=False,
)
for patch in ax.patches[n_patches_before:]:
    patch.set_zorder(3)
    patch.set_edgecolor(PAGE_BG)
    patch.set_linewidth(0.8)

# Target markers — thin vertical line spanning the full range-band height
for i, target in enumerate(targets):
    ax.plot(
        [target, target],
        [i - range_height / 2 + 0.01, i + range_height / 2 - 0.01],
        color=INK,
        linewidth=2.5,
        zorder=4,
        solid_capstyle="butt",
    )

# Value labels — positioned just past the actual bar, colored by status
for i, (actual, s) in enumerate(zip(actuals, status, strict=True)):
    ax.text(
        actual + 1.5, i, f"{actual}%", va="center", ha="left", fontsize=8, fontweight="bold", color=status_palette[s]
    )

# Axes — title length 44 chars, ratio=1.0, title_fontsize=12
title = "bullet-basic · python · seaborn · anyplot.ai"
ax.set_xlim(0, 115)
ax.set_ylim(-0.55, n_metrics - 0.45)
ax.set_xlabel("Performance (%)", fontsize=10, color=INK)
ax.set_ylabel("")
ax.set_title(title, fontsize=12, fontweight="medium", color=INK, pad=12)
ax.set_yticks(range(n_metrics))
yticklabels = ax.set_yticklabels(metrics, fontsize=8, color=INK_SOFT)
for i, lbl in enumerate(yticklabels):
    if i == 2:  # Efficiency — most dramatic underperformance (35% vs 75% target)
        lbl.set_fontweight("bold")
        lbl.set_color(BELOW_TARGET_COLOR)
ax.tick_params(axis="y", length=0)
ax.tick_params(axis="x", labelsize=8)

sns.despine(left=True, top=True, right=True, ax=ax)
ax.xaxis.grid(True, alpha=0.15, linewidth=0.8, color=INK, zorder=2)
ax.yaxis.grid(False)

# Legend
legend_elements = [
    mpatches.Patch(facecolor=BAND_POOR, label="Poor", edgecolor="none"),
    mpatches.Patch(facecolor=BAND_SATISFACTORY, label="Satisfactory", edgecolor="none"),
    mpatches.Patch(facecolor=BAND_GOOD, label="Good", edgecolor="none"),
    mpatches.Patch(facecolor=ON_TRACK_COLOR, label="On Track", edgecolor=PAGE_BG, linewidth=0.8),
    mpatches.Patch(facecolor=BELOW_TARGET_COLOR, label="Below Target", edgecolor=PAGE_BG, linewidth=0.8),
    plt.Line2D([0], [0], color=INK, linewidth=2.5, label="Target"),
]
ax.legend(
    handles=legend_elements, loc="lower right", fontsize=8, framealpha=0.9, facecolor=ELEVATED_BG, edgecolor=INK_SOFT
)

plt.savefig(f"plot-{THEME}.png", dpi=400, facecolor=PAGE_BG)
Runnable source as JSON, for any HTTP client: https://api.anyplot.ai/specs/bullet-basic/seaborn/code. Any spec id and library id listed in llms-full.txt fit the same URL shape; every URL below is complete and callable.
{
  "spec_id": "bullet-basic",
  "language": "python",
  "library": "seaborn",
  "page": "https://anyplot.ai/bullet-basic/python/seaborn",
  "hub": "https://anyplot.ai/bullet-basic",
  "code_json": "https://api.anyplot.ai/specs/bullet-basic/seaborn/code",
  "spec_json": "https://api.anyplot.ai/specs/bullet-basic",
  "render_light_png": "https://storage.googleapis.com/anyplot-images/plots/bullet-basic/python/seaborn/plot-light.png",
  "render_dark_png": "https://storage.googleapis.com/anyplot-images/plots/bullet-basic/python/seaborn/plot-dark.png",
  "quality_score": 89.0,
  "license": "MIT",
  "guide": "https://anyplot.ai/llms.txt"
}
Part of Basic Bullet Chart on anyplot.ai.