The same plot in 14 other libraries — Python: Altair, Bokeh, lets-plot, Matplotlib, Plotly, plotnine, Pygal, Seaborn; R: ggplot2; JavaScript: Chart.js, D3.js, Apache ECharts, Highcharts, MUI X Charts. Compare all 15 side by side: Basic Bullet Chart in Python, R, Julia and JavaScript.
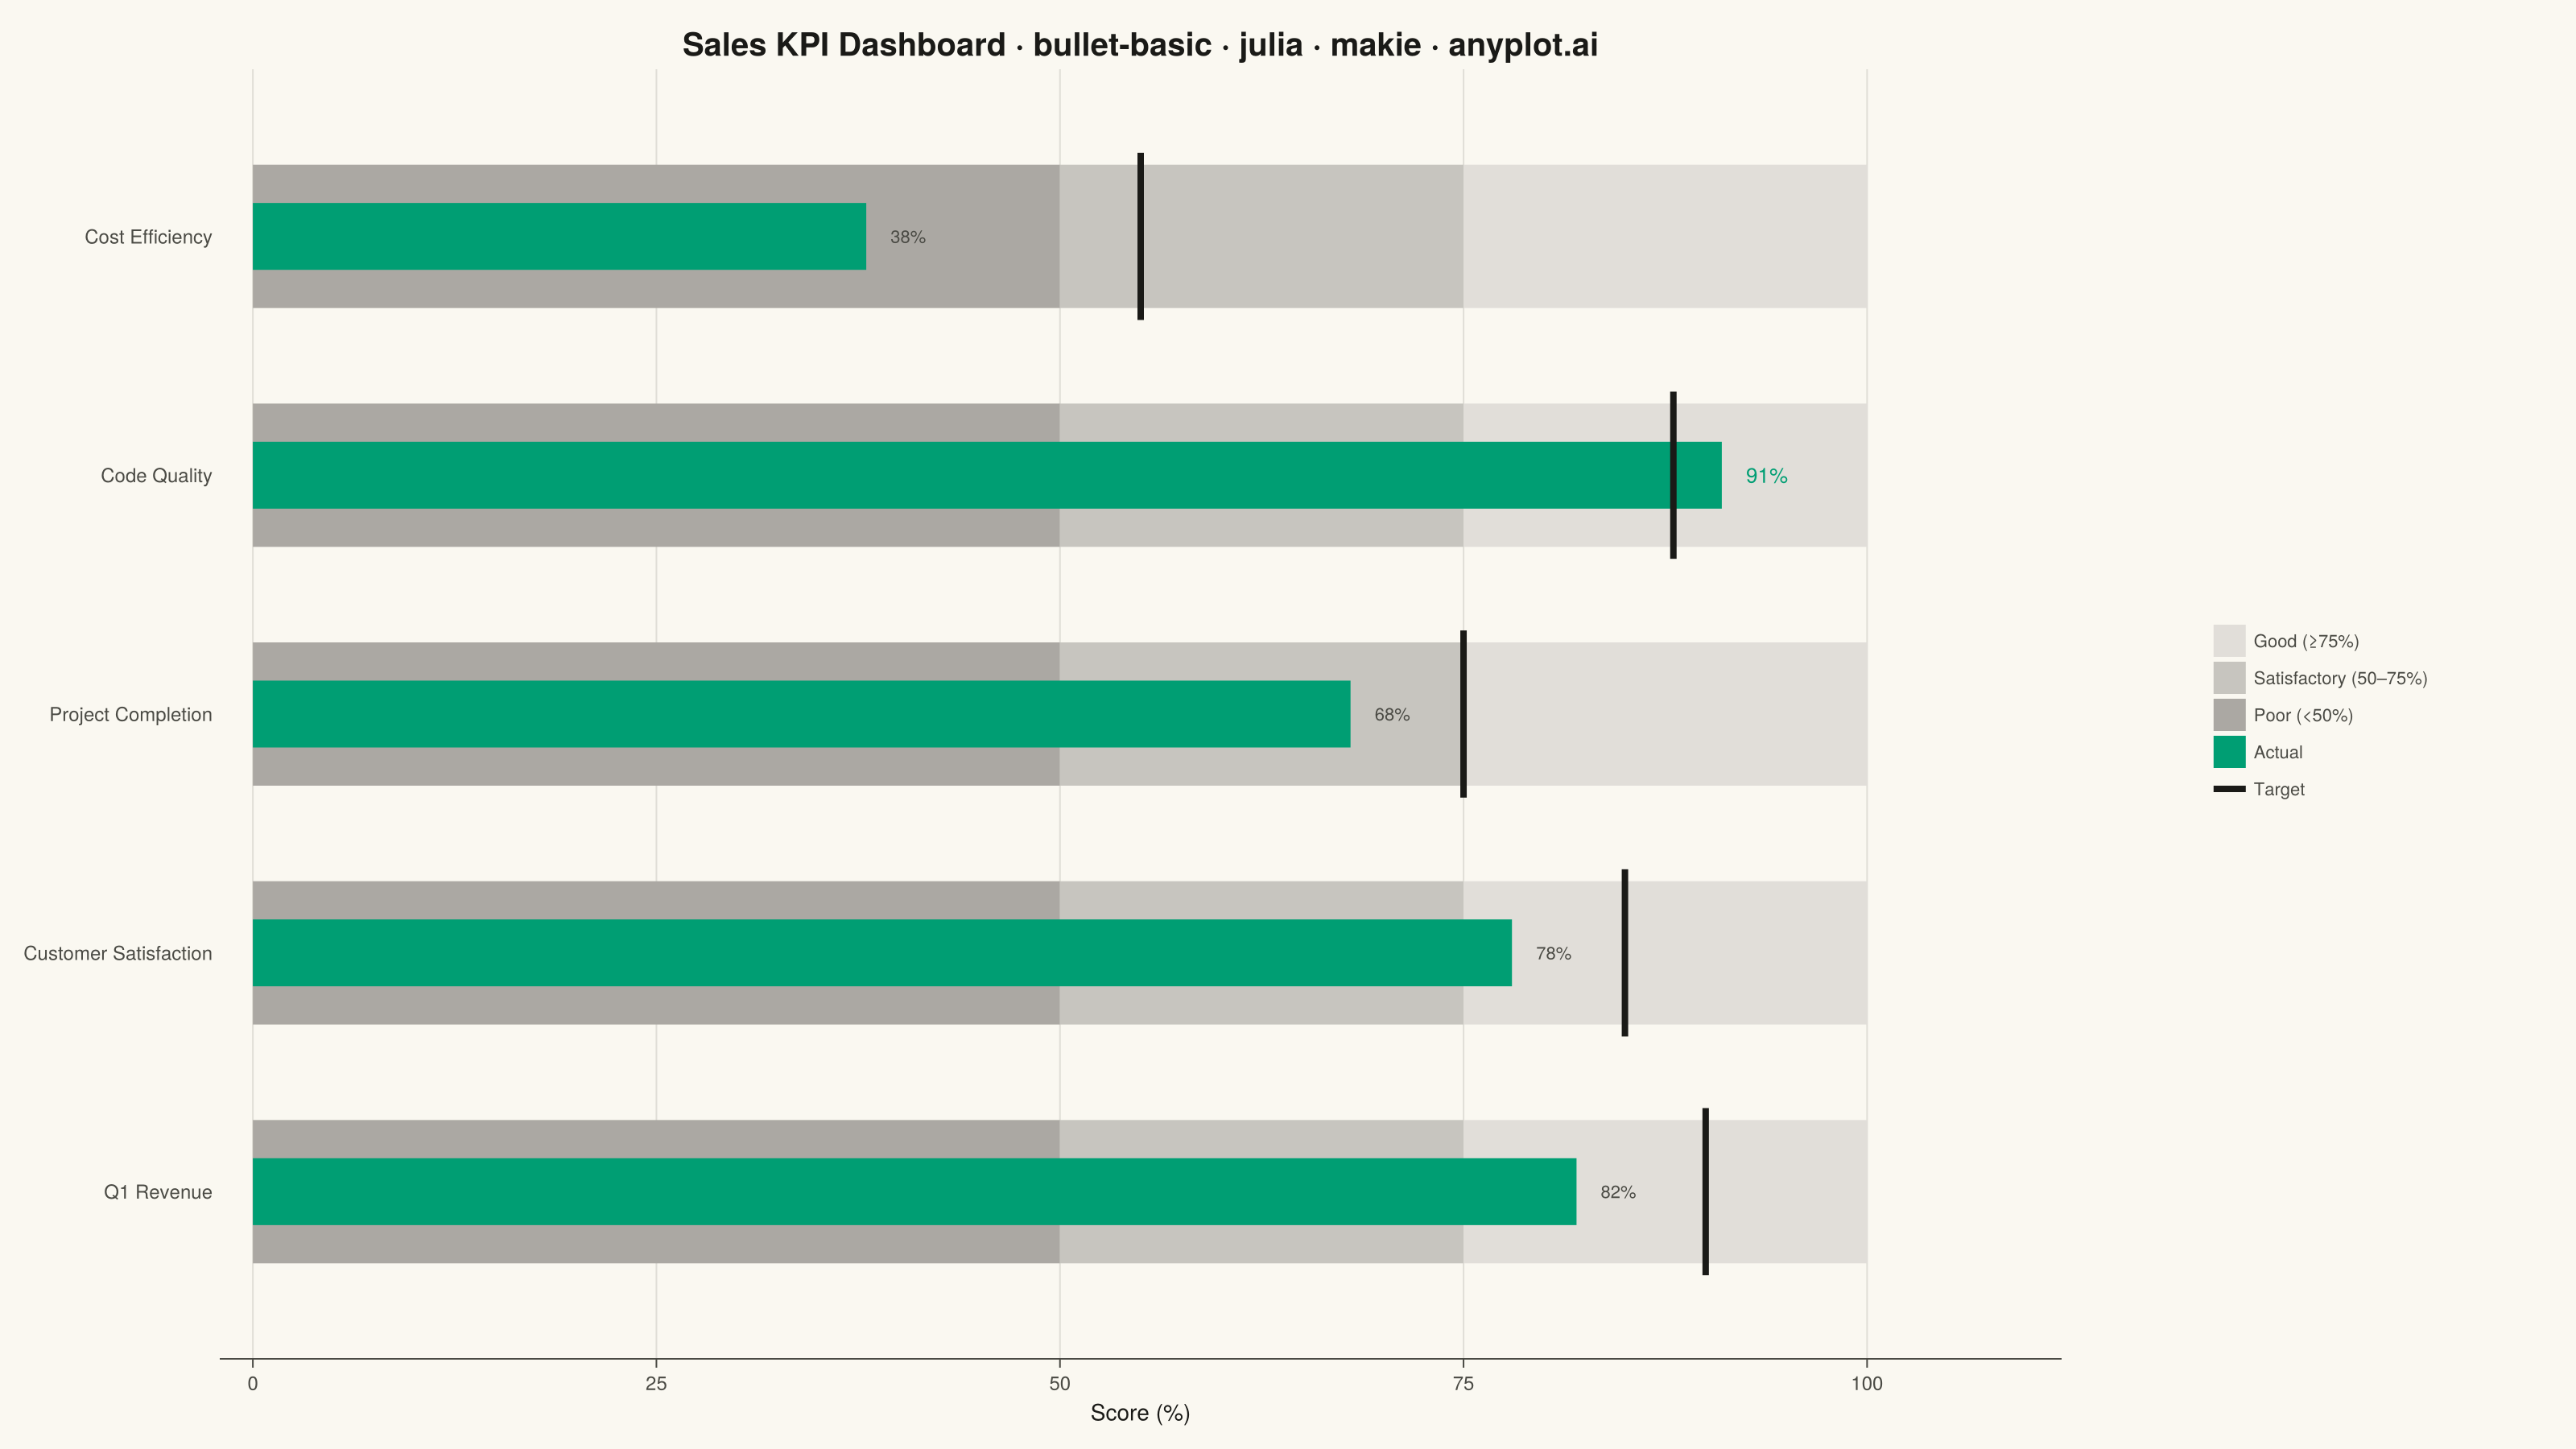
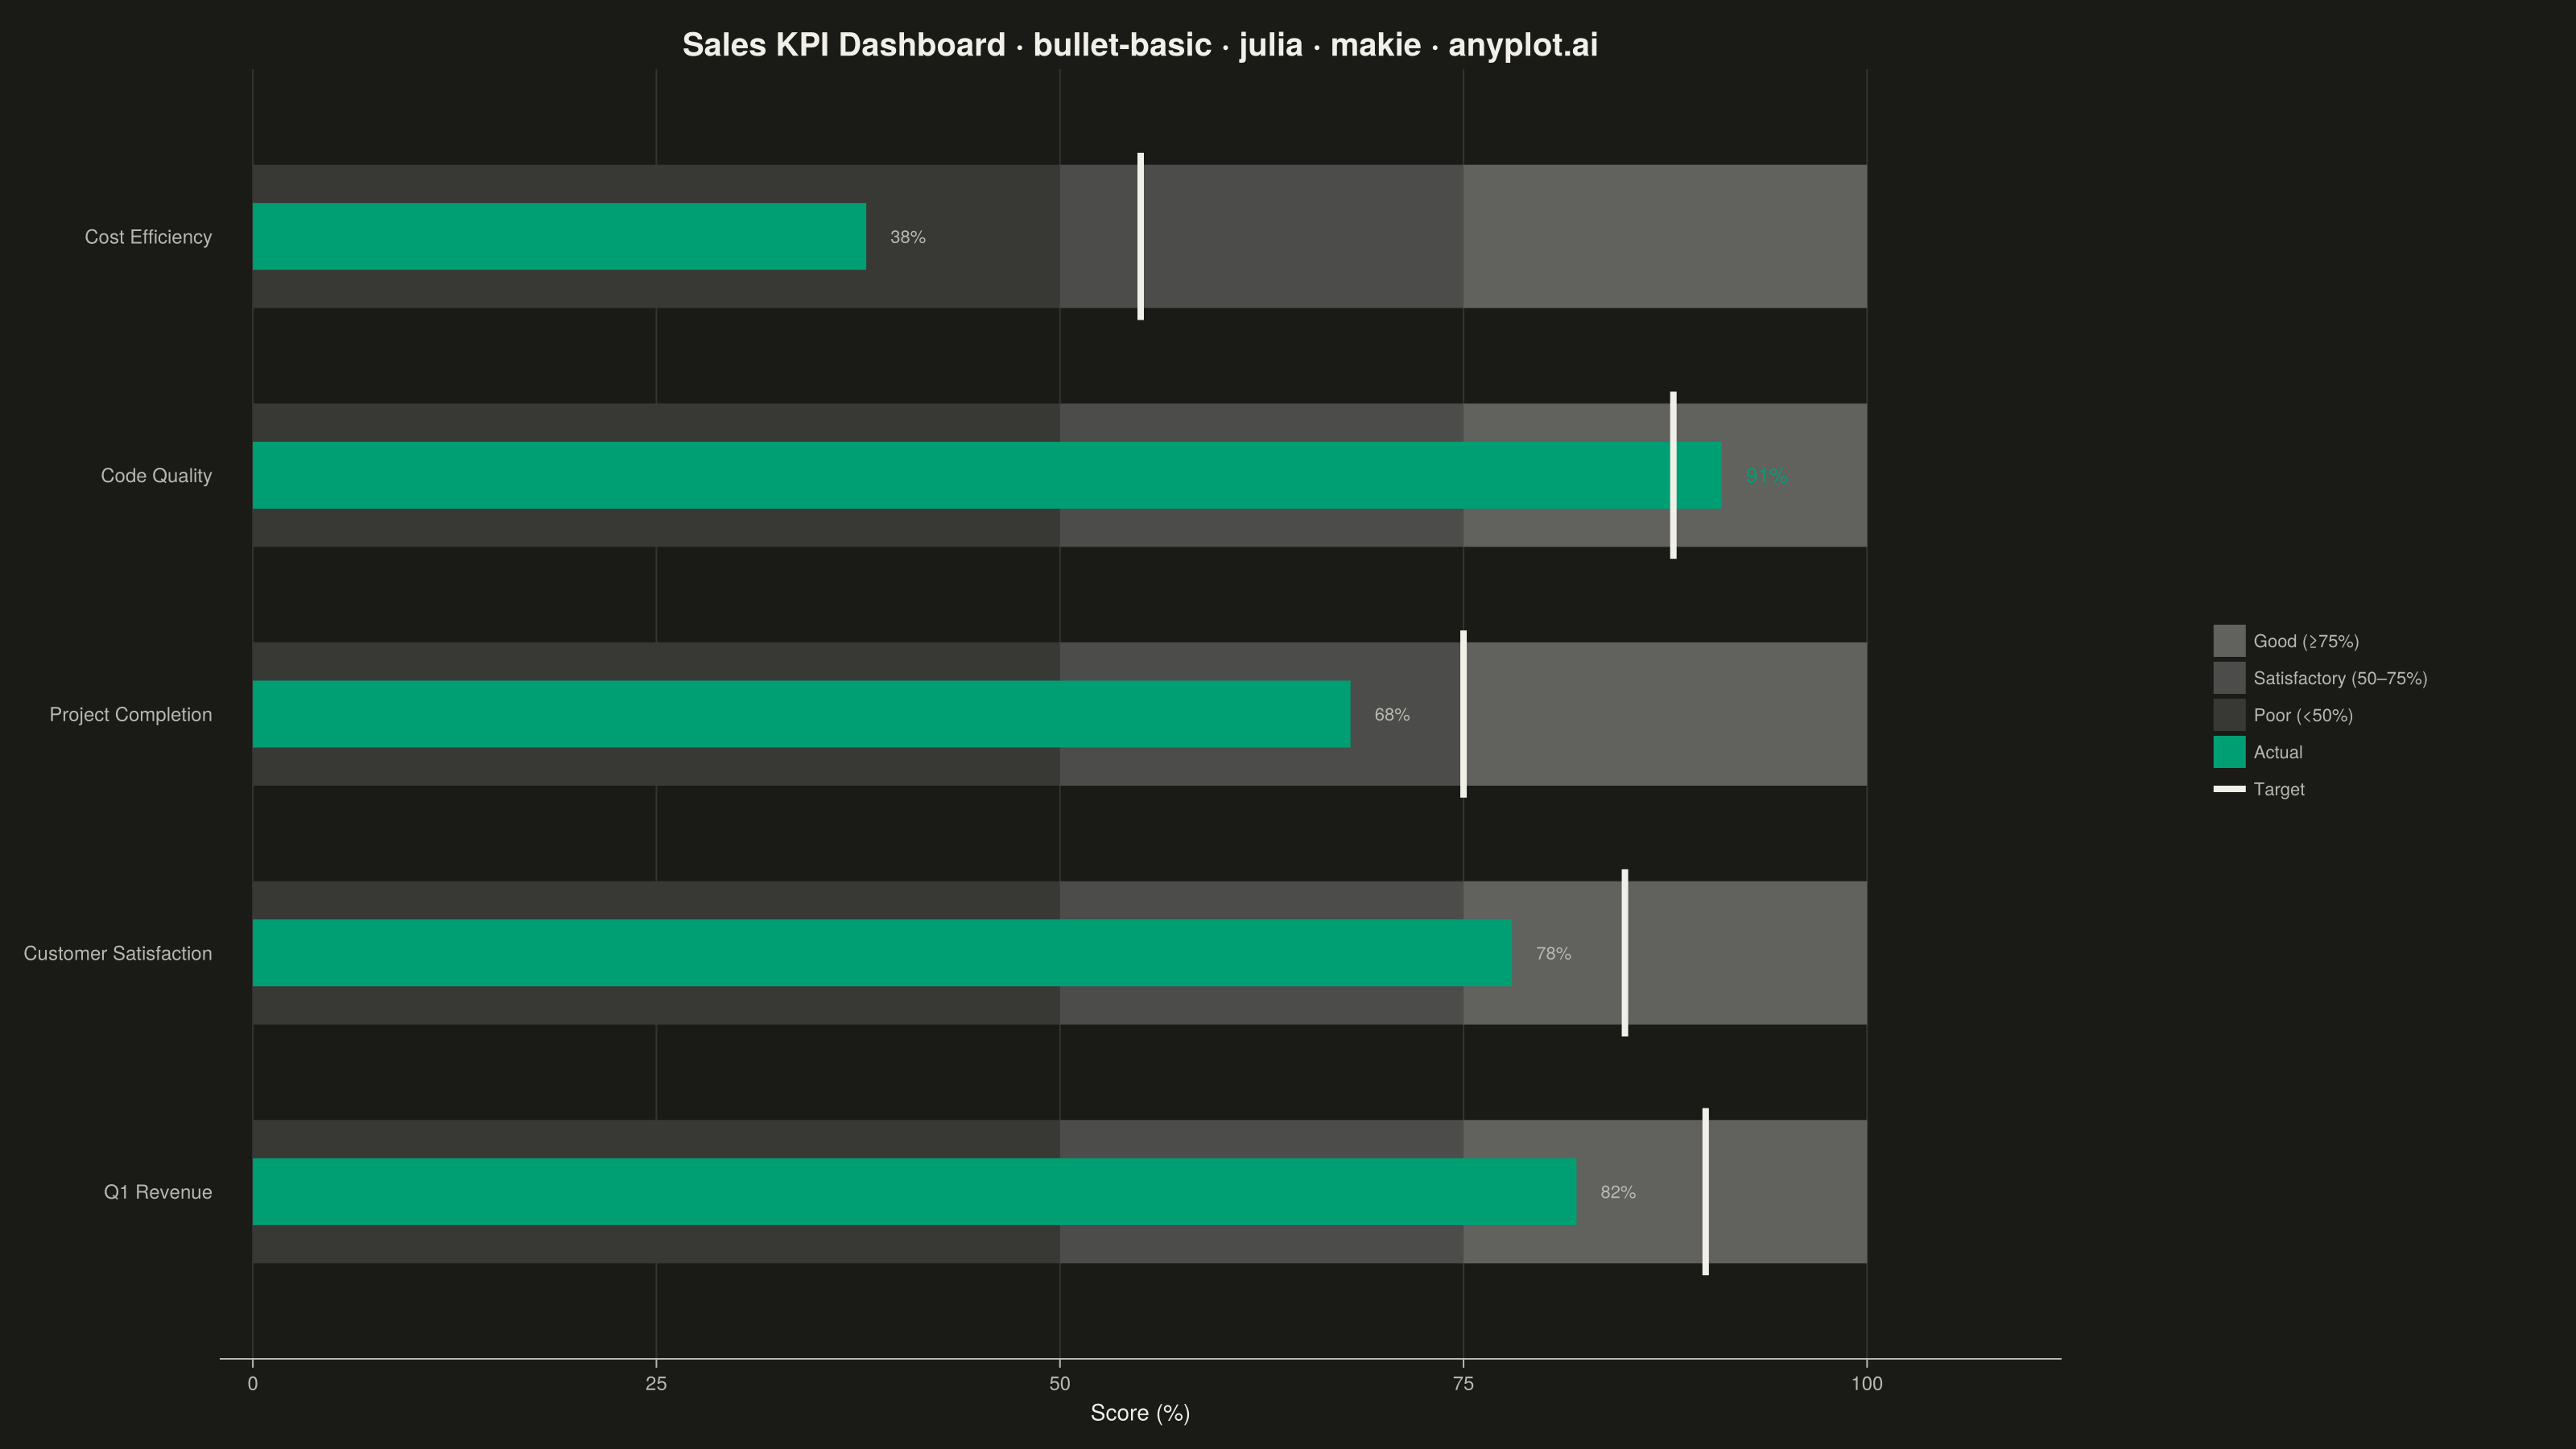
A bullet chart displays a single measure against qualitative ranges and a target marker, designed by Stephen Few as a space-efficient alternative to gauge charts. The linear format shows actual performance as a bar, a target as a vertical marker, and background bands representing qualitative ranges (poor/satisfactory/good). Its compact design allows multiple bullet charts to fit on a single dashboard for easy comparison across metrics.
# anyplot.ai
# bullet-basic: Basic Bullet Chart
# Library: makie 0.22.10 | Julia 1.11.9
# Quality: 88/100 | Created: 2026-05-29

using CairoMakie
using Colors

# --- Theme tokens -----------------------------------------------------------
const THEME       = get(ENV, "ANYPLOT_THEME", "light")
const PAGE_BG     = THEME == "light" ? colorant"#FAF8F1" : colorant"#1A1A17"
const ELEVATED_BG = THEME == "light" ? colorant"#FFFDF6" : colorant"#242420"
const INK         = THEME == "light" ? colorant"#1A1A17" : colorant"#F0EFE8"
const INK_SOFT    = THEME == "light" ? colorant"#4A4A44" : colorant"#B8B7B0"
const INK_MUTED   = THEME == "light" ? colorant"#6B6A63" : colorant"#A8A79F"
const BRAND       = colorant"#009E73"  # Imprint palette position 1

# Grayscale background bands (theme-adaptive; spec requires grayscale shading)
const BAND_POOR = THEME == "light" ? RGBAf(0.67, 0.66, 0.64, 1.0) : RGBAf(0.22, 0.22, 0.21, 1.0)
const BAND_SAT  = THEME == "light" ? RGBAf(0.78, 0.77, 0.75, 1.0) : RGBAf(0.30, 0.30, 0.29, 1.0)
const BAND_GOOD = THEME == "light" ? RGBAf(0.88, 0.87, 0.85, 1.0) : RGBAf(0.38, 0.38, 0.37, 1.0)
const GRID_CLR  = THEME == "light" ?
    RGBAf(26 / 255, 26 / 255, 23 / 255, 0.12) :
    RGBAf(240 / 255, 239 / 255, 232 / 255, 0.12)

# --- Data -------------------------------------------------------------------
labels  = ["Q1 Revenue", "Customer Satisfaction", "Project Completion", "Code Quality", "Cost Efficiency"]
actuals = [82, 78, 68, 91, 38]  # Cost Efficiency at 38 exercises the poor zone (<50)
targets = [90, 85, 75, 88, 55]
n = length(labels)

# --- Plot -------------------------------------------------------------------
title_str  = "Sales KPI Dashboard · bullet-basic · julia · makie · anyplot.ai"
title_size = length(title_str) > 67 ? round(Int, 20 * 67 / length(title_str)) : 20

fig = Figure(size = (1600, 900), fontsize = 14, backgroundcolor = PAGE_BG)

ax = Axis(
    fig[1, 1];
    title             = title_str,
    titlesize         = title_size,
    titlecolor        = INK,
    xlabel            = "Score (%)",
    xlabelsize        = 14,
    xlabelcolor       = INK,
    xticklabelsize    = 12,
    xticklabelcolor   = INK_SOFT,
    xtickcolor        = INK_SOFT,
    yticklabelsize    = 12,
    yticklabelcolor   = INK_SOFT,
    yticksvisible     = false,
    backgroundcolor   = PAGE_BG,
    topspinevisible   = false,
    rightspinevisible = false,
    leftspinevisible  = false,
    bottomspinecolor  = INK_SOFT,
    xgridcolor        = GRID_CLR,
    ygridvisible      = false,
    xminorgridvisible = false,
    yminorgridvisible = false,
)

band_h = 0.60
bar_h  = 0.28

for i in 1:n
    y      = Float64(i)
    actual = Float64(actuals[i])
    target = Float64(targets[i])

    poly!(ax, Rect2f(0.0,  y - band_h / 2, 50.0, band_h); color = BAND_POOR, strokewidth = 0)
    poly!(ax, Rect2f(50.0, y - band_h / 2, 25.0, band_h); color = BAND_SAT,  strokewidth = 0)
    poly!(ax, Rect2f(75.0, y - band_h / 2, 25.0, band_h); color = BAND_GOOD, strokewidth = 0)

    poly!(ax, Rect2f(0.0, y - bar_h / 2, actual, bar_h); color = BRAND, strokewidth = 0)

    lines!(ax, [target, target], [y - band_h / 2 - 0.05, y + band_h / 2 + 0.05];
           color = INK, linewidth = 4.0)

    exceeds = actuals[i] > targets[i]
    text!(ax, actual + 1.5, y;
          text    = "$(actuals[i])%",
          color   = exceeds ? BRAND : INK_SOFT,
          fontsize = exceeds ? 13 : 11,
          align   = (:left, :center))
end

ax.yticks    = (Float64.(1:n), labels)
ax.xticks    = [0, 25, 50, 75, 100]
ax.yreversed = true
xlims!(ax, -2.0, 112.0)
ylims!(ax, 0.3, Float64(n) + 0.7)

Legend(
    fig[1, 2],
    [PolyElement(color = BAND_GOOD, strokewidth = 0),
     PolyElement(color = BAND_SAT,  strokewidth = 0),
     PolyElement(color = BAND_POOR, strokewidth = 0),
     PolyElement(color = BRAND,     strokewidth = 0),
     LineElement(color = INK, linewidth = 4.0)],
    ["Good (≥75%)", "Satisfactory (50–75%)", "Poor (<50%)", "Actual", "Target"];
    backgroundcolor = ELEVATED_BG,
    framevisible    = false,
    labelcolor      = INK_SOFT,
    labelsize       = 11,
    padding         = (8, 8, 8, 8),
)

colsize!(fig.layout, 2, Relative(0.20))

# --- Save -------------------------------------------------------------------
save("plot-$(THEME).png", fig; px_per_unit = 2)
Runnable source as JSON, for any HTTP client: https://api.anyplot.ai/specs/bullet-basic/makie/code. Any spec id and library id listed in llms-full.txt fit the same URL shape; every URL below is complete and callable.
{
  "spec_id": "bullet-basic",
  "language": "julia",
  "library": "makie",
  "page": "https://anyplot.ai/bullet-basic/julia/makie",
  "hub": "https://anyplot.ai/bullet-basic",
  "code_json": "https://api.anyplot.ai/specs/bullet-basic/makie/code",
  "spec_json": "https://api.anyplot.ai/specs/bullet-basic",
  "render_light_png": "https://storage.googleapis.com/anyplot-images/plots/bullet-basic/julia/makie/plot-light.png",
  "render_dark_png": "https://storage.googleapis.com/anyplot-images/plots/bullet-basic/julia/makie/plot-dark.png",
  "quality_score": 88.0,
  "license": "MIT",
  "guide": "https://anyplot.ai/llms.txt"
}
Part of Basic Bullet Chart on anyplot.ai.