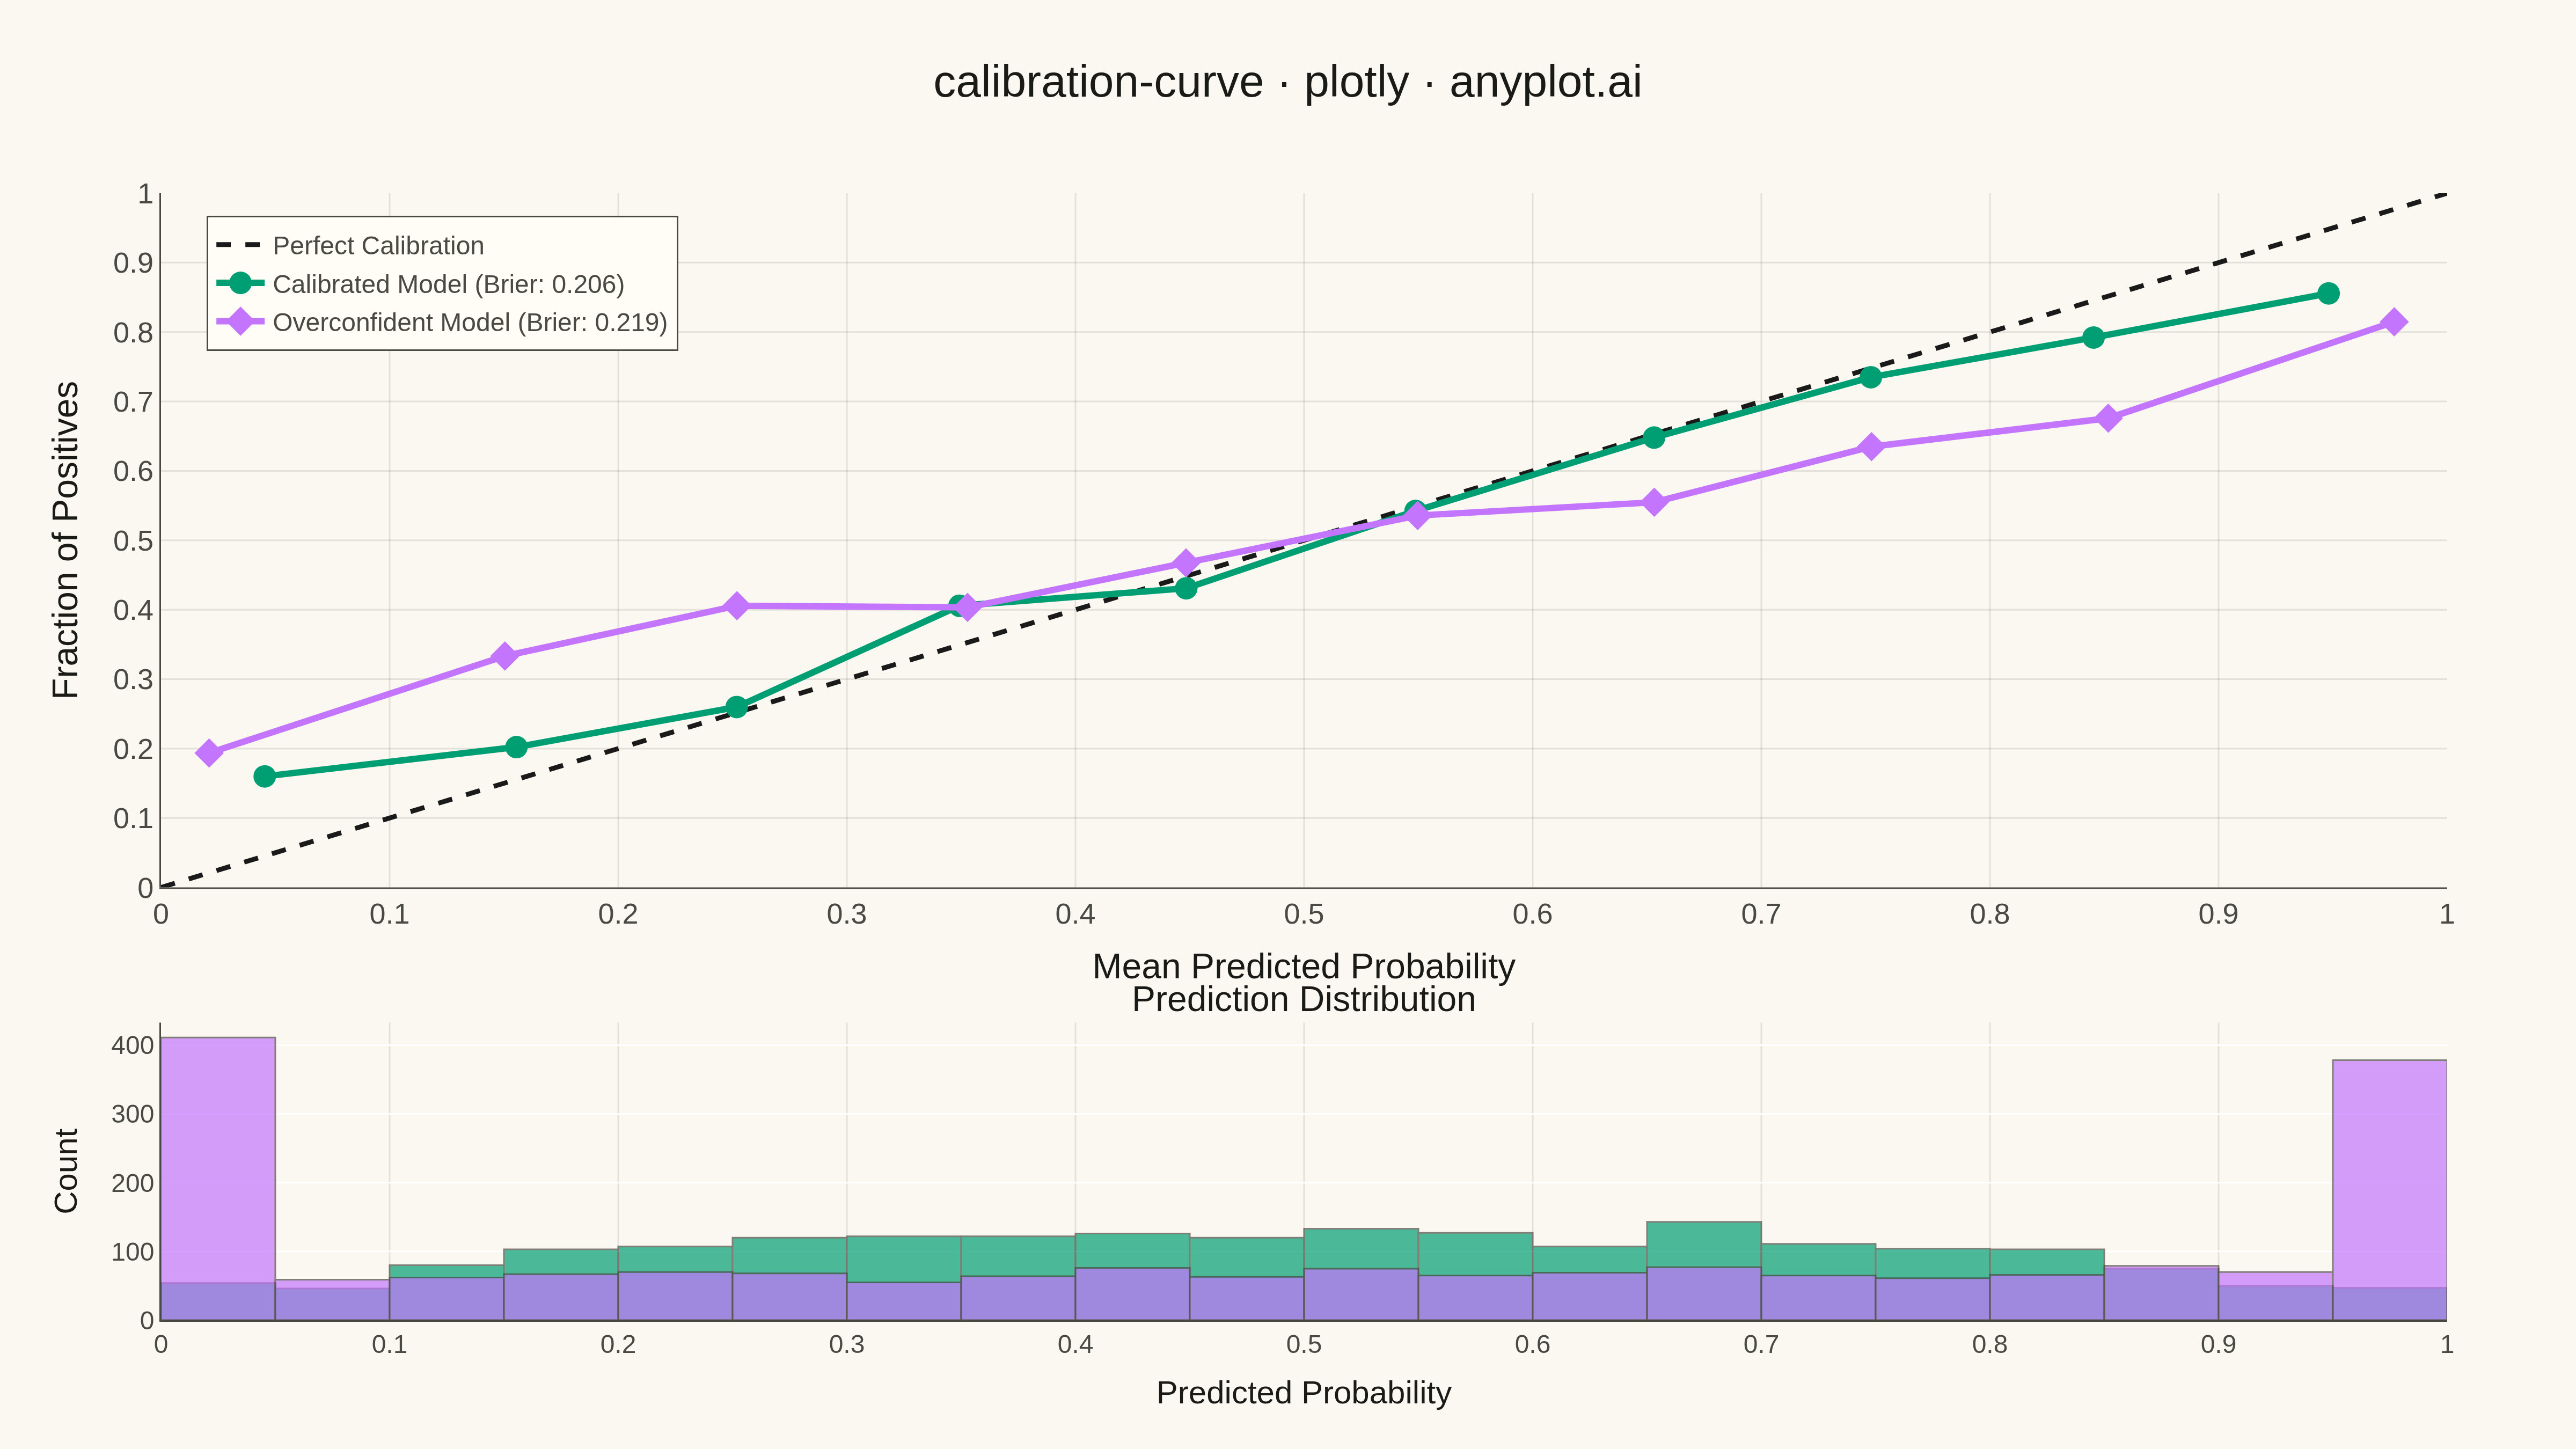
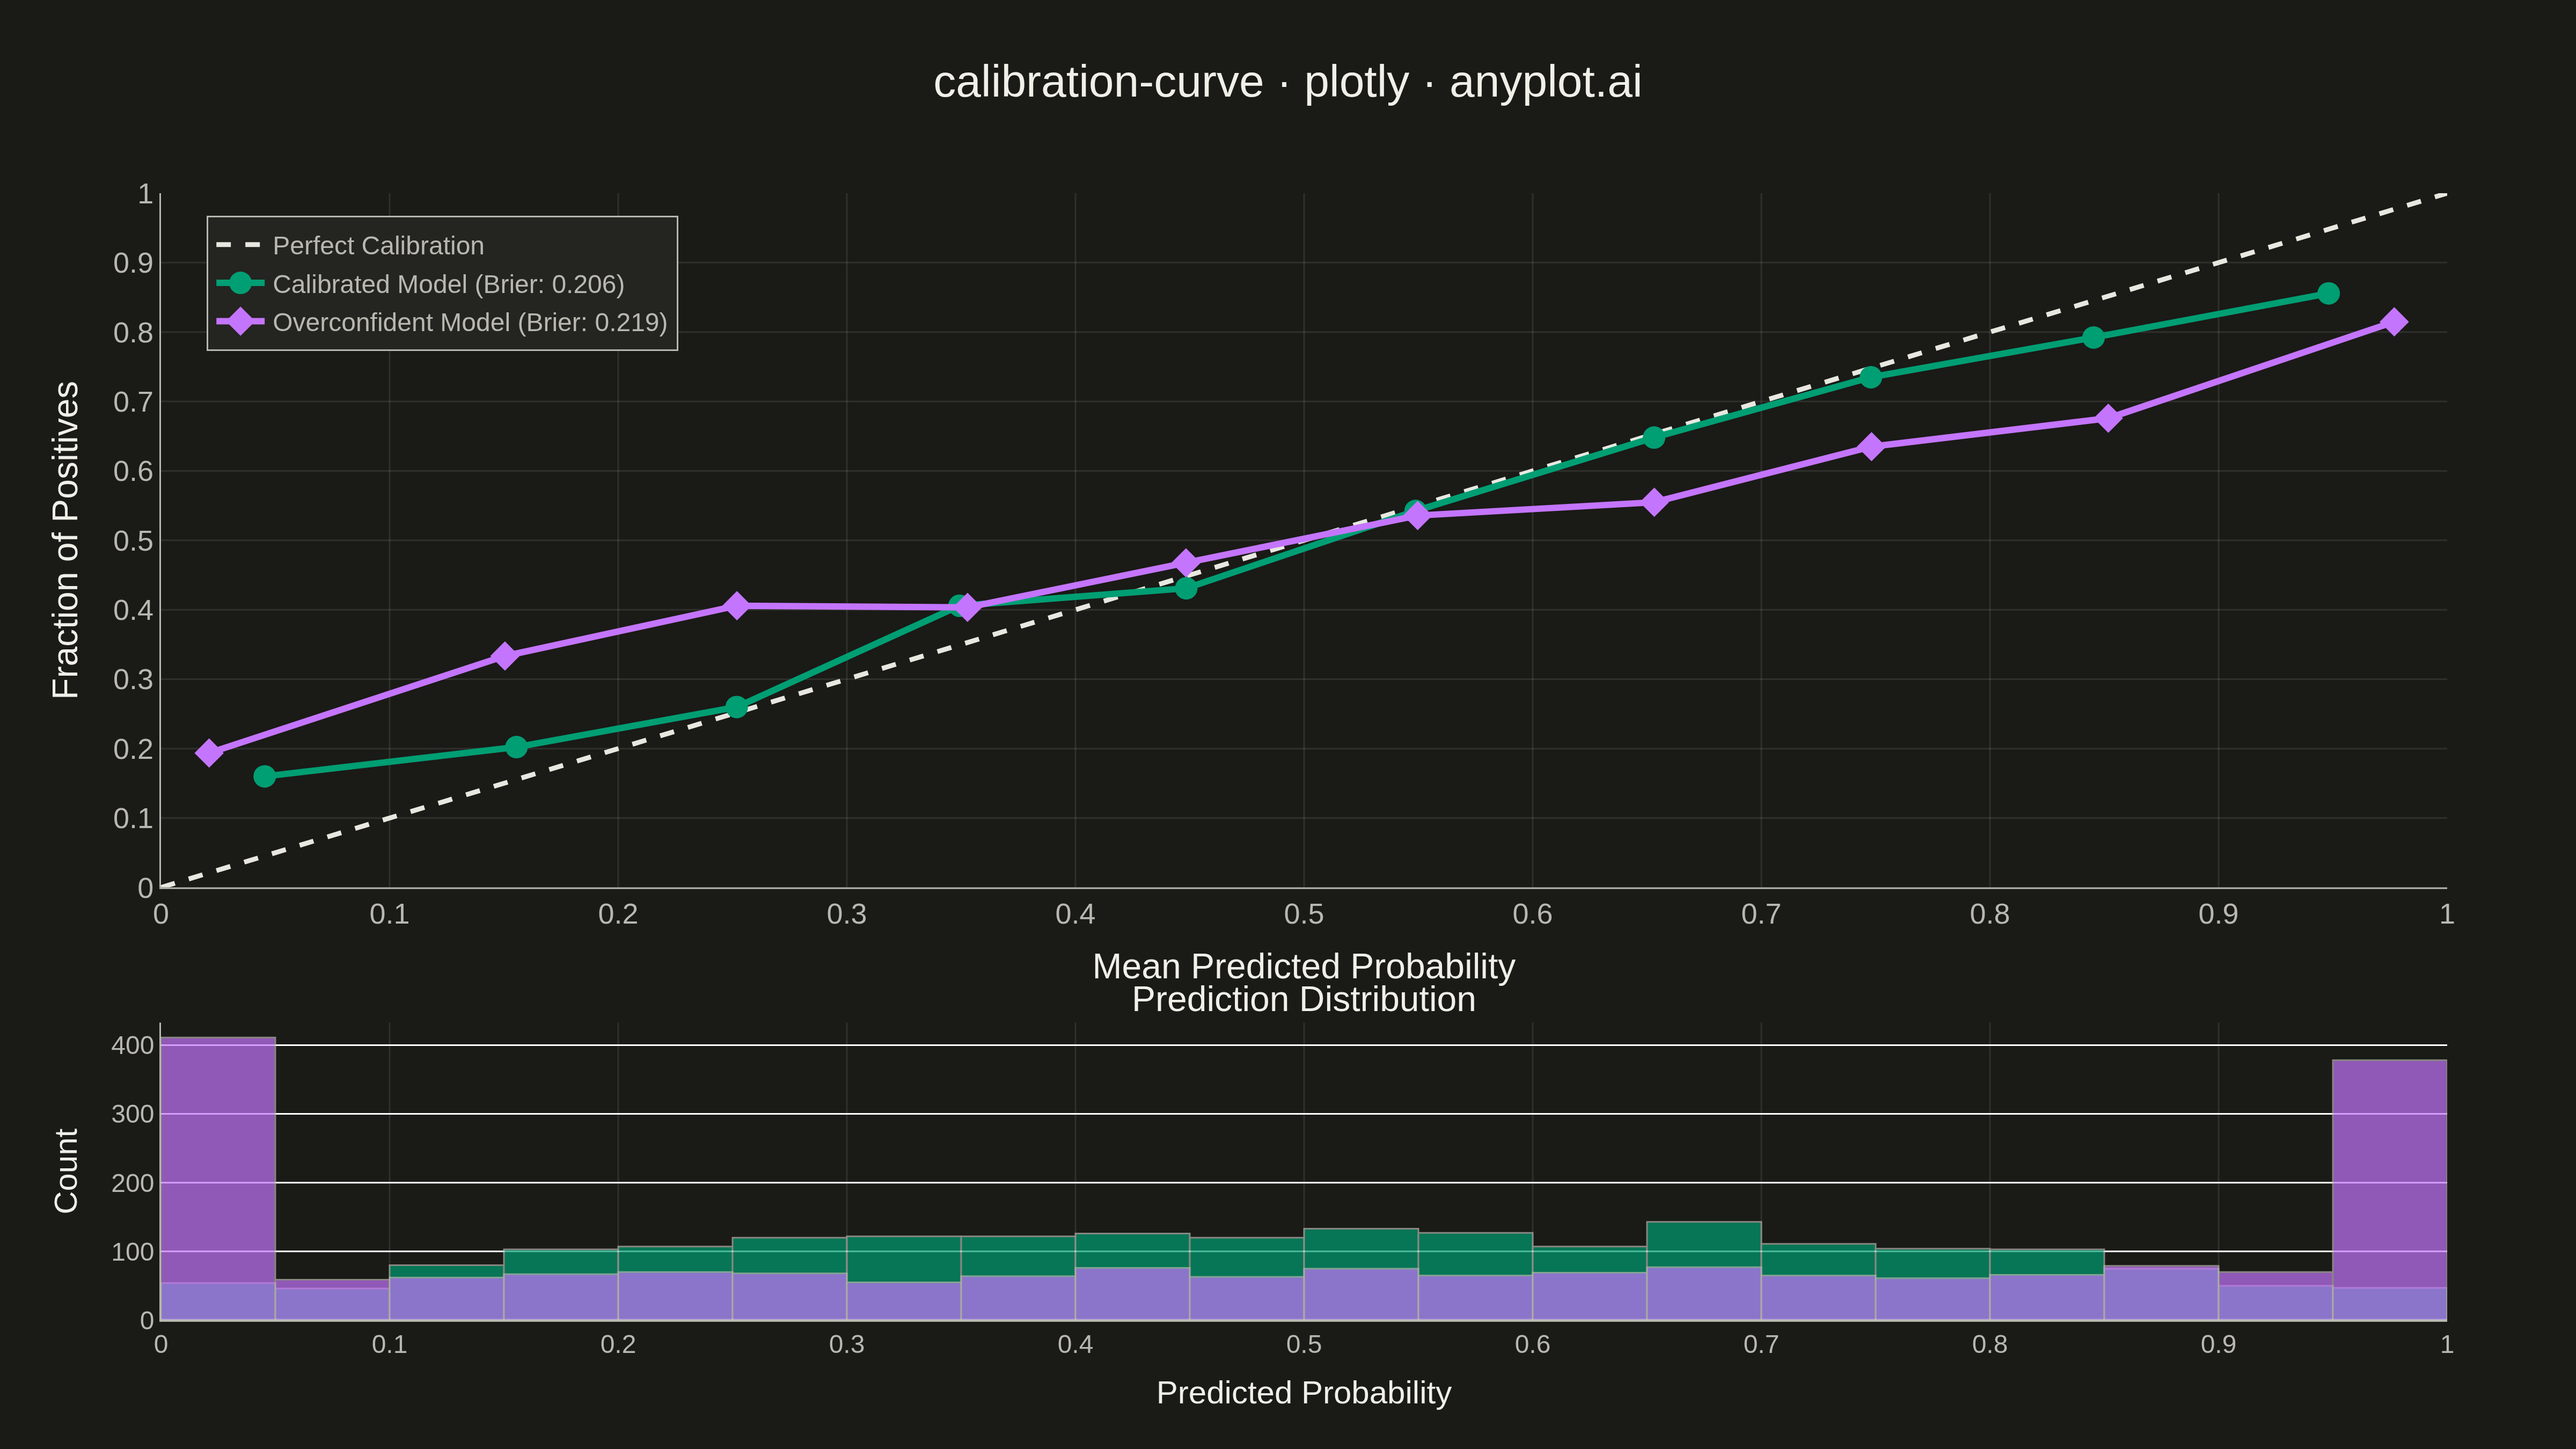
A calibration curve (reliability diagram) visualizes how well the predicted probabilities of a binary classifier match actual outcomes. By plotting the fraction of positives against mean predicted probability in binned intervals, it reveals whether a model is well-calibrated, overconfident, or underconfident. A perfectly calibrated model follows the diagonal line where predicted probability equals observed frequency.
Preview render from the Plotly implementation.