The same plot in 14 other libraries — JavaScript: Chart.js, D3.js, Apache ECharts, Highcharts; Python: Altair, Bokeh, lets-plot, Matplotlib, Plotly, plotnine, Pygal, Seaborn; R: ggplot2; Julia: Makie.jl. Compare all 15 side by side: Calibration Curve in Python, R, Julia and JavaScript.
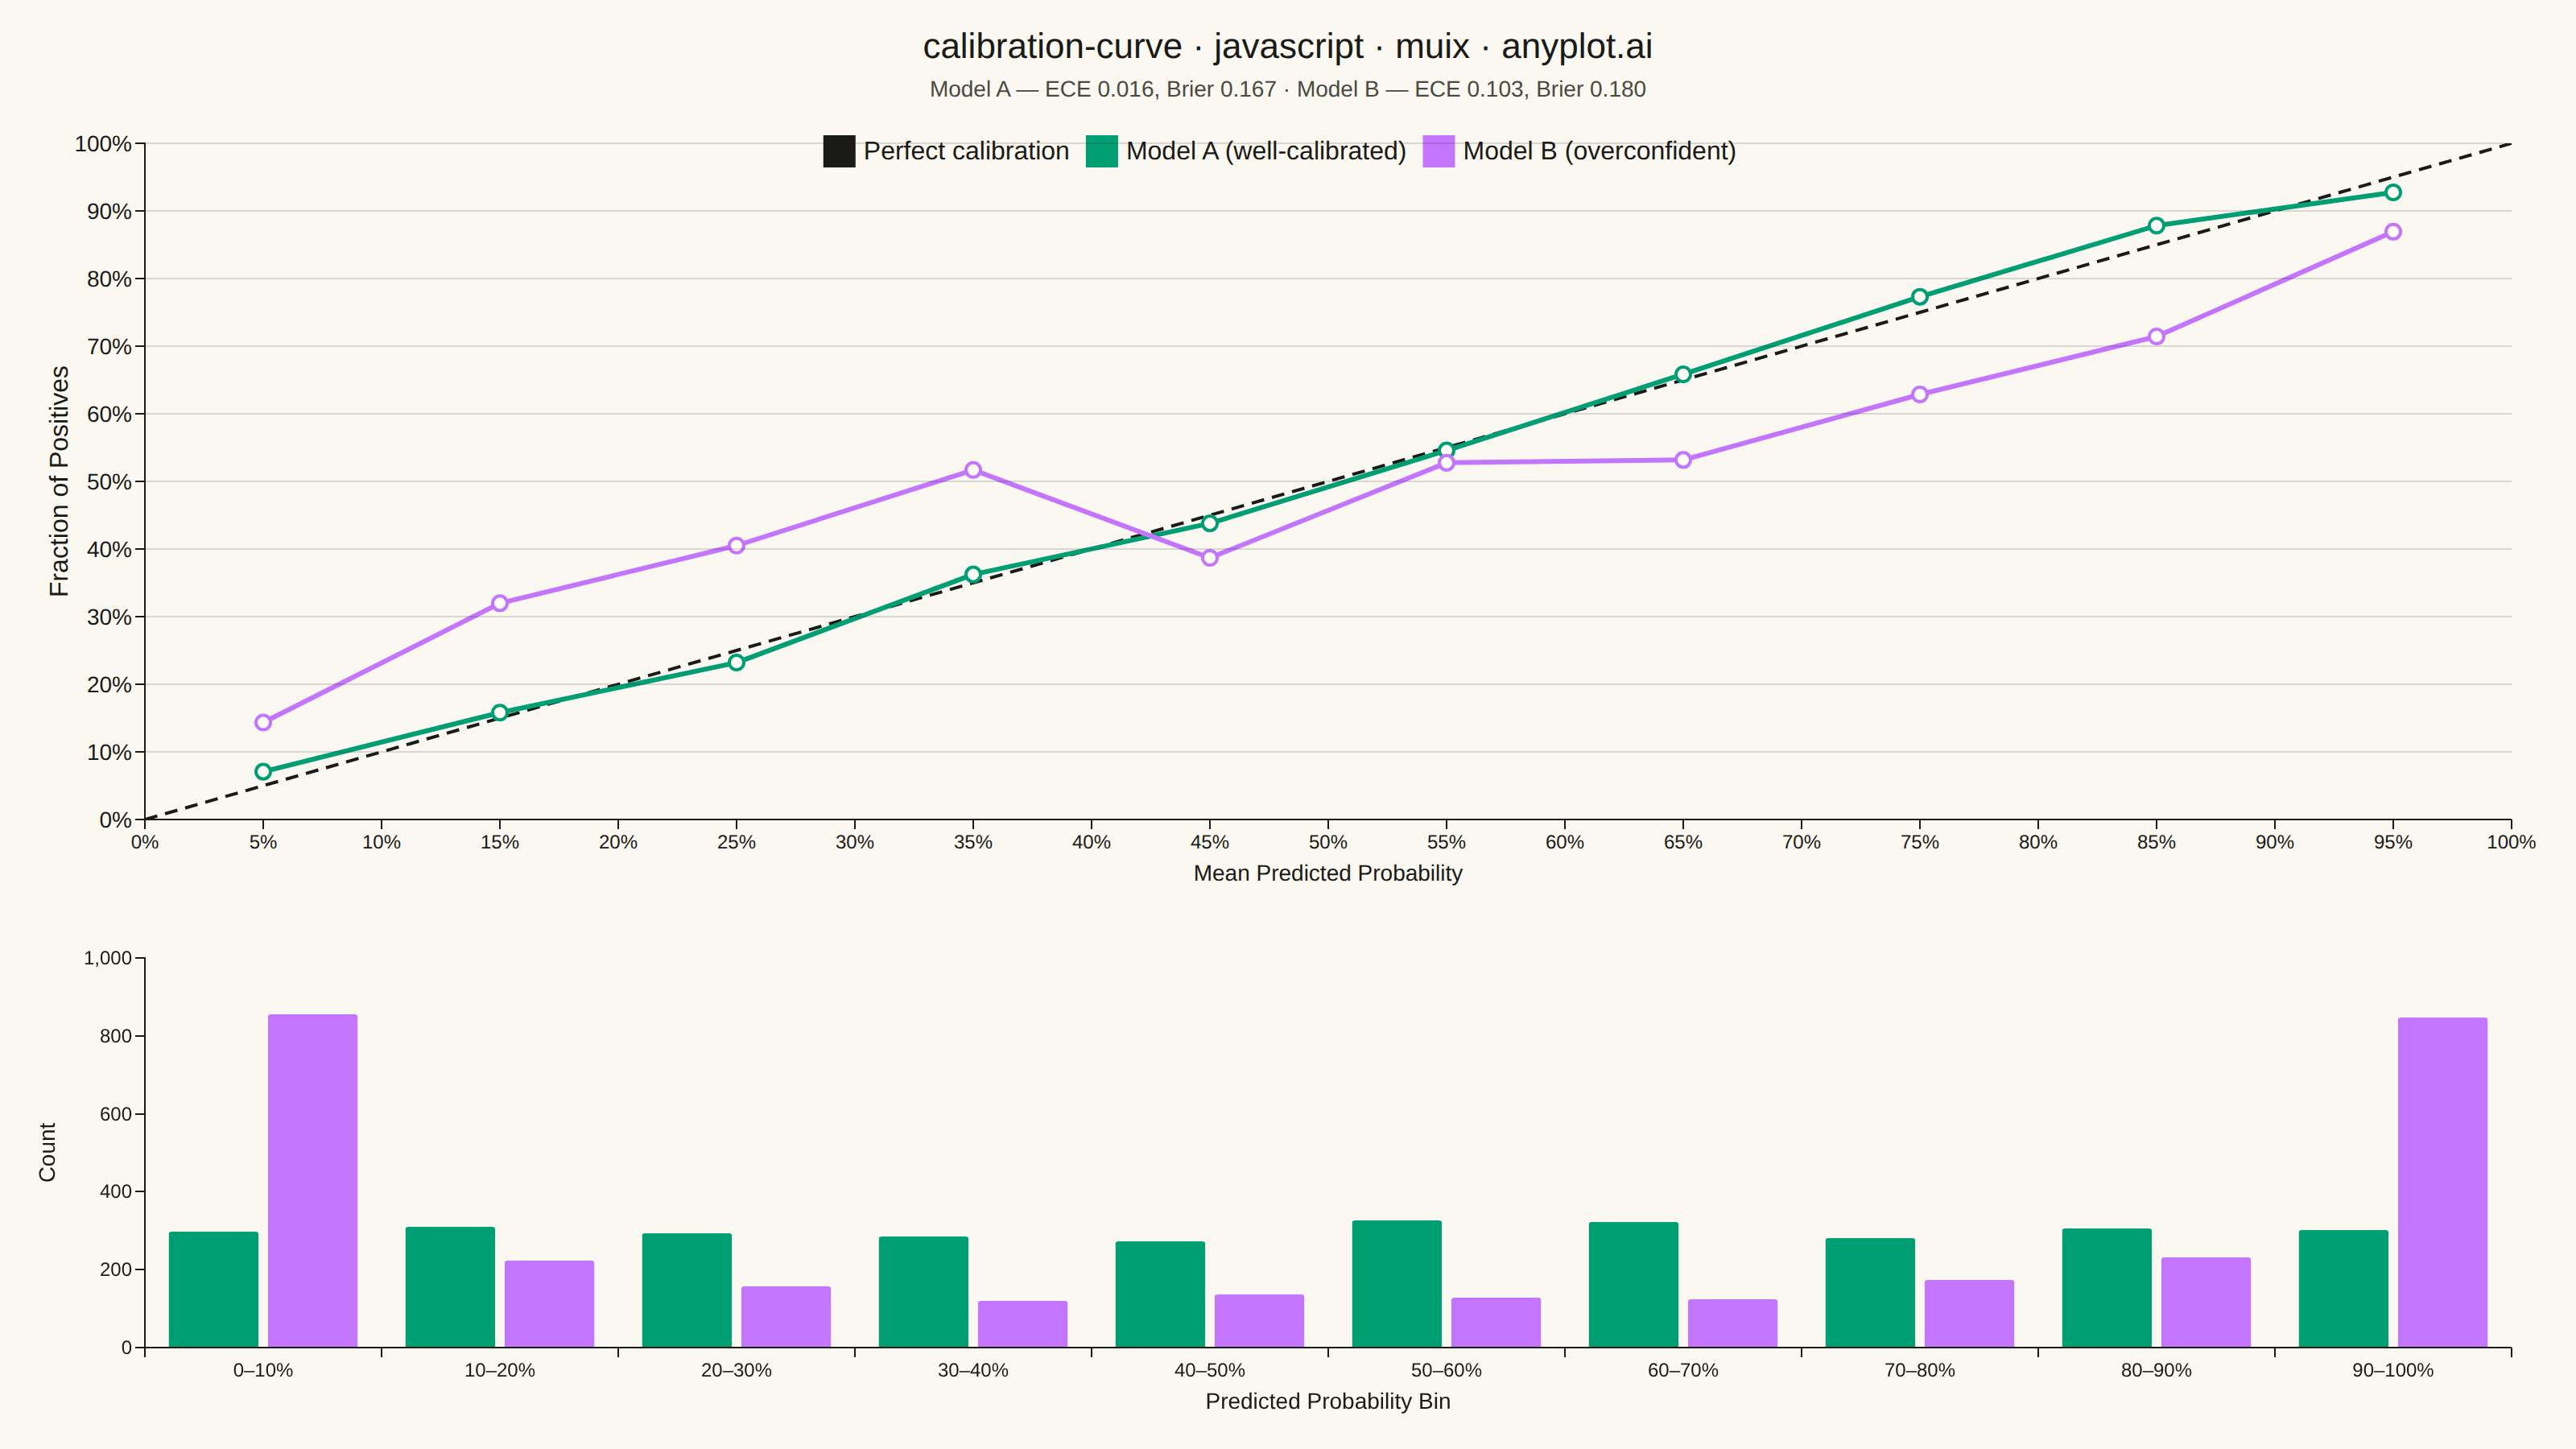
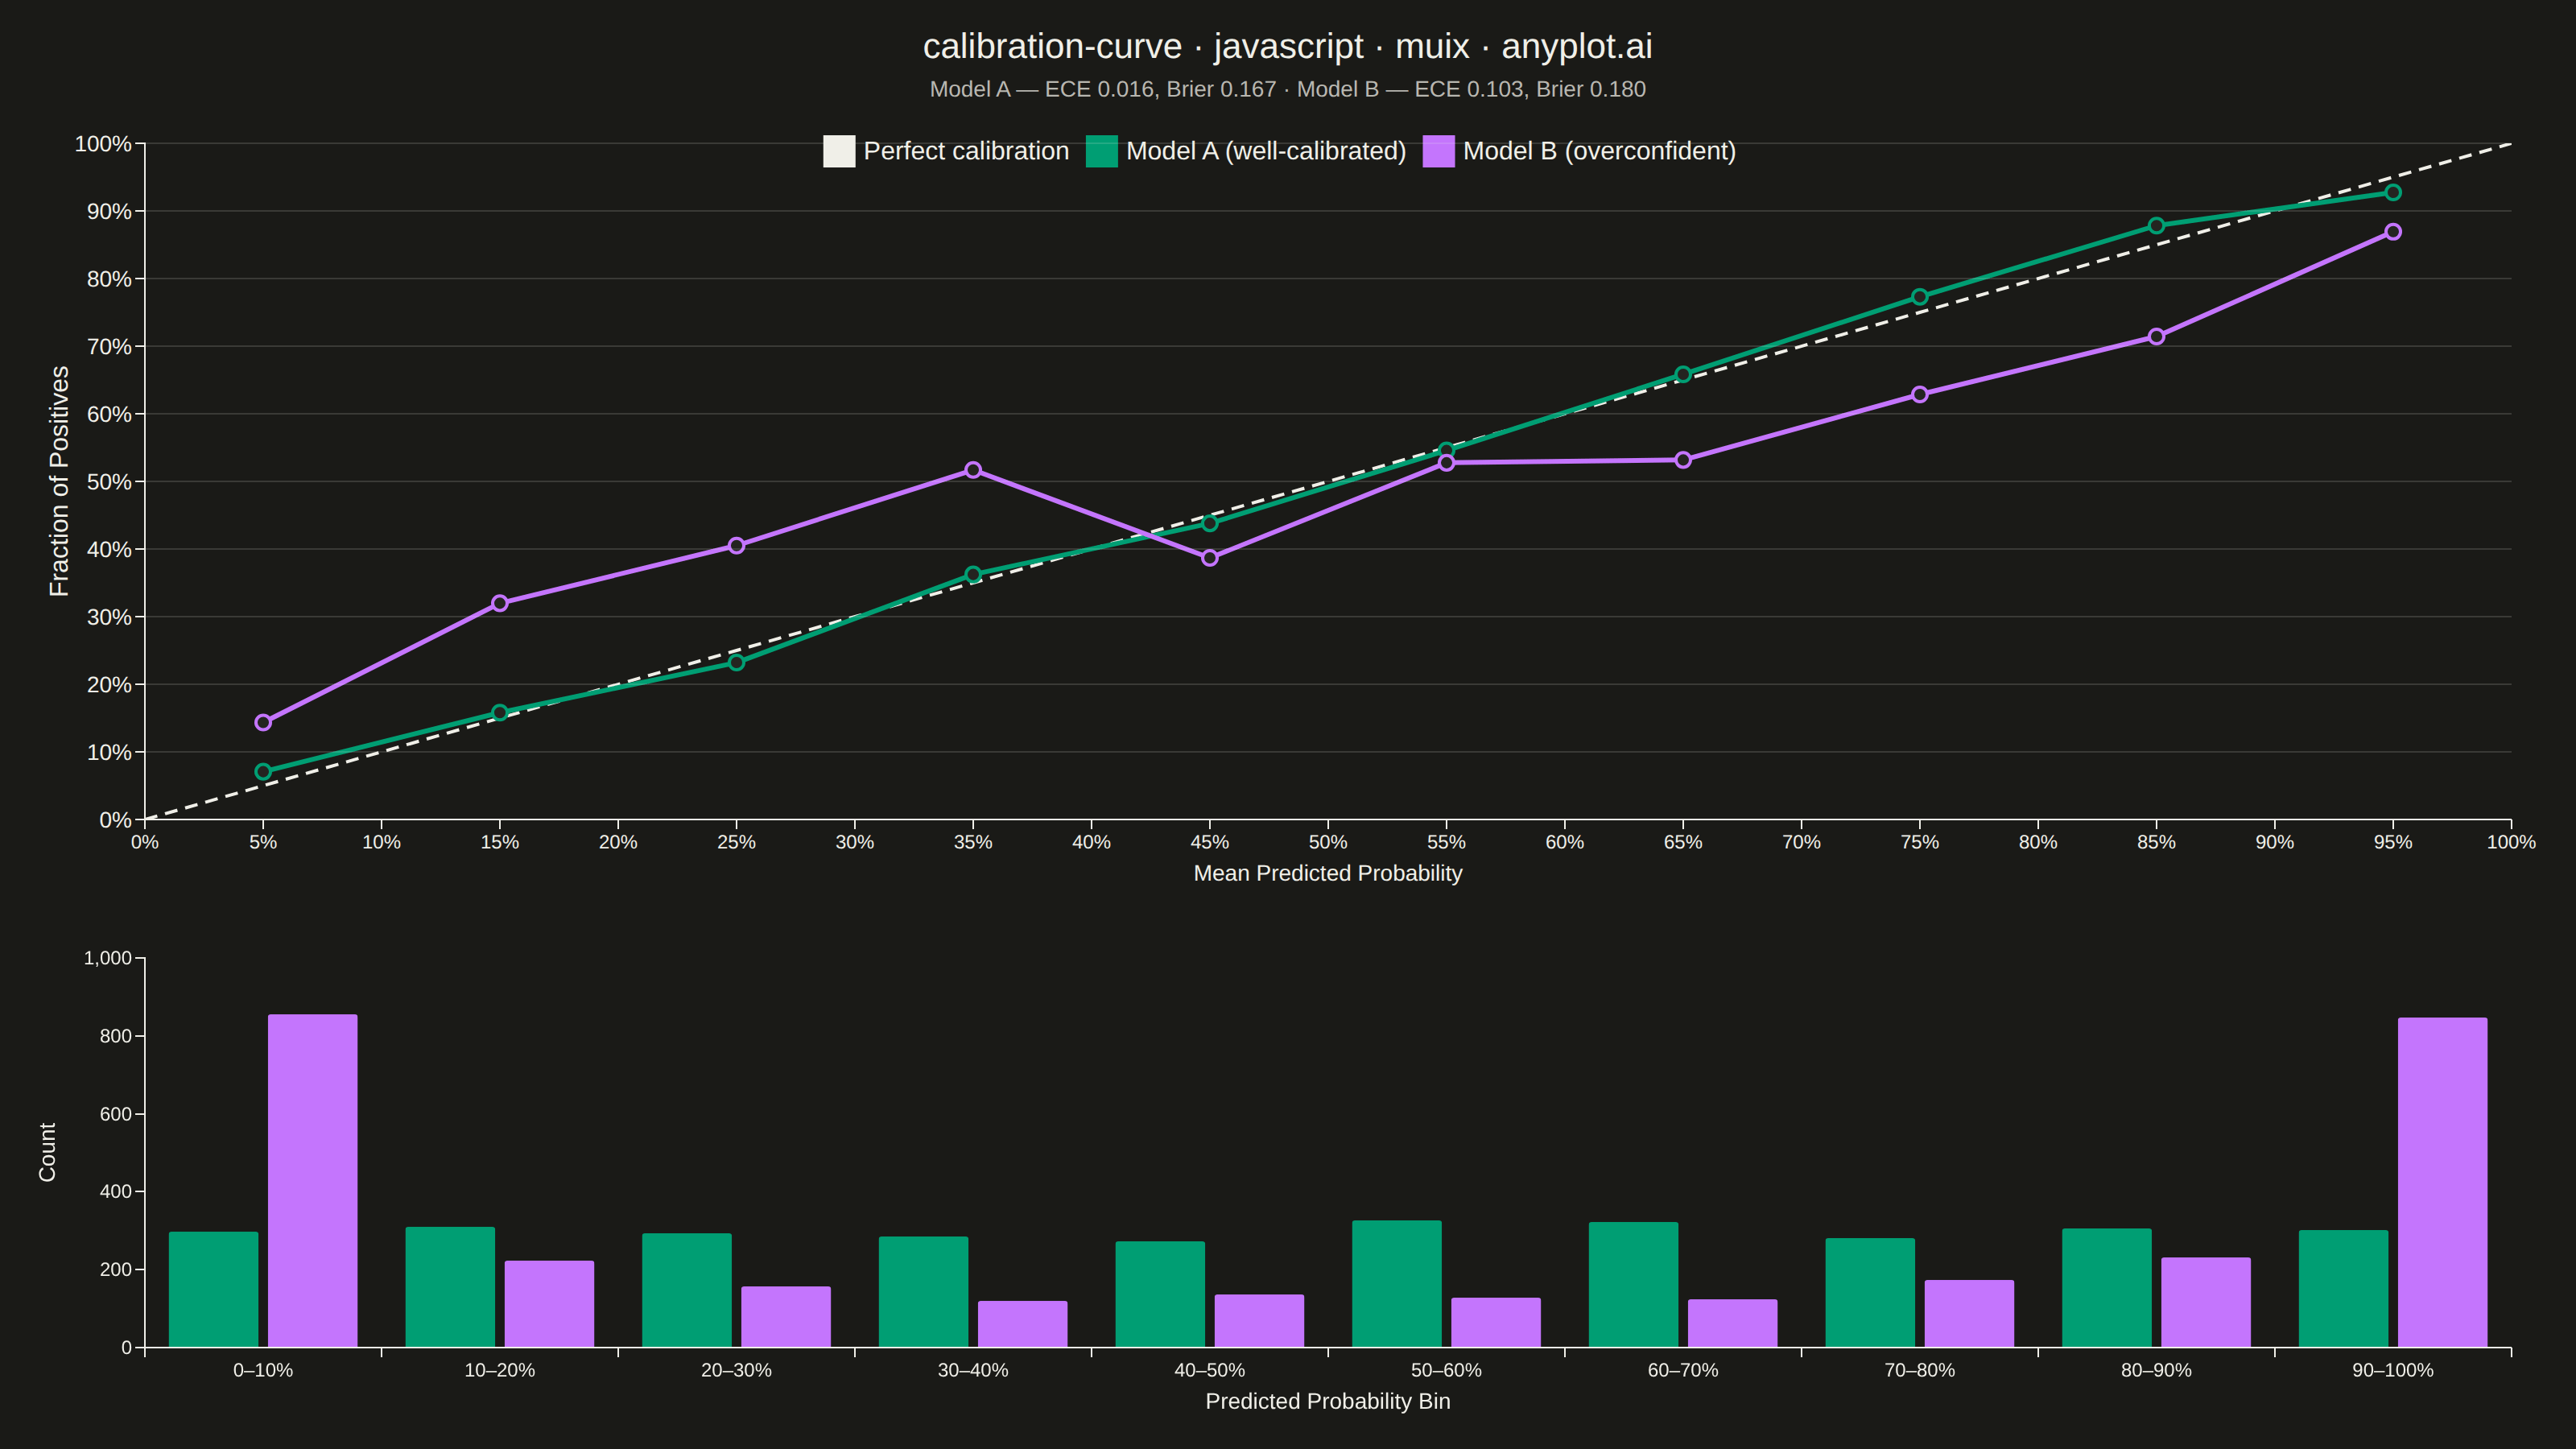
A calibration curve (reliability diagram) visualizes how well the predicted probabilities of a binary classifier match actual outcomes. By plotting the fraction of positives against mean predicted probability in binned intervals, it reveals whether a model is well-calibrated, overconfident, or underconfident. A perfectly calibrated model follows the diagonal line where predicted probability equals observed frequency.
// anyplot.ai
// calibration-curve: Calibration Curve
// Library: muix 7.29.1 | JavaScript 22.23.2
// Quality: 90/100 | Created: 2026-09-02
import { LineChart } from "@mui/x-charts/LineChart";
import { BarChart } from "@mui/x-charts/BarChart";
import { ChartsGrid } from "@mui/x-charts/ChartsGrid";
import Box from "@mui/material/Box";
import Typography from "@mui/material/Typography";

const t = window.ANYPLOT_TOKENS;

// --- Data (in-memory, deterministic) ----------------------------------------

// mulberry32 PRNG — small, fast, fixed-seed (the browser has no seeded RNG)
function mulberry32(seed: number) {
  return function random() {
    seed = (seed + 0x6d2b79f5) | 0;
    let x = Math.imul(seed ^ (seed >>> 15), 1 | seed);
    x = (x + Math.imul(x ^ (x >>> 7), 61 | x)) ^ x;
    return ((x ^ (x >>> 14)) >>> 0) / 4294967296;
  };
}

// Standard normal via Box-Muller, driven by the same PRNG stream
function gaussian(random: () => number): number {
  const u = Math.max(random(), 1e-9);
  const v = random();
  return Math.sqrt(-2 * Math.log(u)) * Math.cos(2 * Math.PI * v);
}

const clamp01 = (v: number) => Math.min(1, Math.max(0, v));
const logit = (p: number) => Math.log(p / (1 - p));
const sigmoid = (z: number) => 1 / (1 + Math.exp(-z));

const N_SAMPLES = 3000;
const NUM_BINS = 10;
const random = mulberry32(42);

// Latent true disease risk for each patient, and the observed diagnosis
// drawn from a Bernoulli trial at that risk — this is the ground truth
// both classifiers below are scored against.
const trueRisk = Array.from({ length: N_SAMPLES }, () => random());
const yTrue = trueRisk.map((risk) => (random() < risk ? 1 : 0));

// Model A: well-calibrated screening classifier — small prediction noise.
const predA = trueRisk.map((risk) => clamp01(risk + 0.05 * gaussian(random)));

// Model B: overconfident classifier — pushes predictions toward 0/1 by
// sharpening the log-odds, so mid-risk patients get extreme scores.
const OVERCONFIDENCE_SCALE = 2.4;
const predB = trueRisk.map((risk) =>
  sigmoid(logit(clamp01(risk) * 0.998 + 0.001) * OVERCONFIDENCE_SCALE),
);

type Bin = { center: number; fracPos: number | null; count: number };

function calibrationBins(yProb: number[]): Bin[] {
  const sums = Array.from({ length: NUM_BINS }, () => ({ count: 0, sumTrue: 0 }));
  yProb.forEach((p, i) => {
    const idx = Math.min(NUM_BINS - 1, Math.floor(p * NUM_BINS));
    sums[idx].count += 1;
    sums[idx].sumTrue += yTrue[i];
  });
  return sums.map((b, i) => ({
    center: (i + 0.5) / NUM_BINS,
    fracPos: b.count > 0 ? b.sumTrue / b.count : null,
    count: b.count,
  }));
}

function brierScore(yProb: number[]): number {
  const sse = yProb.reduce((acc, p, i) => acc + (p - yTrue[i]) ** 2, 0);
  return sse / yProb.length;
}

function expectedCalibrationError(bins: Bin[], total: number): number {
  return bins.reduce((acc, b) => {
    if (b.fracPos === null) return acc;
    return acc + (b.count / total) * Math.abs(b.fracPos - b.center);
  }, 0);
}

const binsA = calibrationBins(predA);
const binsB = calibrationBins(predB);
const eceA = expectedCalibrationError(binsA, N_SAMPLES);
const eceB = expectedCalibrationError(binsB, N_SAMPLES);
const brierA = brierScore(predA);
const brierB = brierScore(predB);

// Shared x-axis: bin centers bracketed by 0 and 1 so the diagonal reaches
// both corners; the bracket points are `null` on the model series (gaps),
// so only the 10 real bins draw markers.
const xValues = [0, ...binsA.map((b) => b.center), 1];
const modelASeries = [null, ...binsA.map((b) => b.fracPos), null];
const modelBSeries = [null, ...binsB.map((b) => b.fracPos), null];
const diagonalSeries = xValues;

const binLabels = binsA.map((b) => {
  const lo = Math.round((b.center - 0.05) * 100);
  const hi = Math.round((b.center + 0.05) * 100);
  return `${lo}–${hi}%`;
});

const TITLE_HEIGHT = 78;

// --- Chart (default-exported component — the harness mounts it) ------------

export default function Chart() {
  const { width, height } = window.ANYPLOT_SIZE;
  const chartAreaHeight = height - TITLE_HEIGHT;
  const mainHeight = Math.round(chartAreaHeight * 0.62);
  const histHeight = chartAreaHeight - mainHeight;

  return (
    <Box
      sx={{
        width,
        height,
        display: "flex",
        flexDirection: "column",
        paddingTop: "16px",
      }}
    >
      <Typography
        sx={{
          color: t.ink,
          fontSize: 22,
          fontWeight: 500,
          textAlign: "center",
          lineHeight: 1.2,
        }}
      >
        calibration-curve · javascript · muix · anyplot.ai
      </Typography>
      <Typography
        sx={{
          color: t.inkSoft,
          fontSize: 14,
          textAlign: "center",
          lineHeight: 1.4,
          marginTop: "4px",
        }}
      >
        {`Model A — ECE ${eceA.toFixed(3)}, Brier ${brierA.toFixed(3)}   ·   Model B — ECE ${eceB.toFixed(3)}, Brier ${brierB.toFixed(3)}`}
      </Typography>

      <LineChart
        width={width}
        height={mainHeight}
        skipAnimation
        colors={t.palette}
        xAxis={[
          {
            data: xValues,
            scaleType: "linear",
            min: 0,
            max: 1,
            label: "Mean Predicted Probability",
            valueFormatter: (v: number) => `${Math.round(v * 100)}%`,
          },
        ]}
        yAxis={[
          {
            min: 0,
            max: 1,
            label: "Fraction of Positives",
            valueFormatter: (v: number) => `${Math.round(v * 100)}%`,
            // tickFontSize drives the label's reserved offset from the tick
            // text (MUI X sizes that gap off this prop, not tickLabelStyle),
            // so it must stay wide enough for a 4-char "100%" tick.
            tickFontSize: 32,
            labelFontSize: 16,
            tickLabelStyle: { fontSize: 14 },
          },
        ]}
        series={[
          {
            id: "diagonal",
            data: diagonalSeries,
            label: "Perfect calibration",
            color: t.ink,
            showMark: false,
            curve: "linear",
          },
          {
            id: "modelA",
            data: modelASeries,
            label: "Model A (well-calibrated)",
            color: t.palette[0],
            showMark: true,
            curve: "linear",
          },
          {
            id: "modelB",
            data: modelBSeries,
            label: "Model B (overconfident)",
            color: t.palette[1],
            showMark: true,
            curve: "linear",
          },
        ]}
        margin={{ left: 90, right: 40, top: 20, bottom: 70 }}
        sx={{
          "& .MuiChartsAxis-tickLabel": { fontSize: "14px" },
          "& .MuiChartsAxis-label": { fontSize: "16px" },
          "& .MuiChartsLegend-label": { fontSize: "14px" },
          "& .MuiLineElement-series-modelA": { strokeWidth: 3 },
          "& .MuiLineElement-series-modelB": { strokeWidth: 3 },
          "& .MuiLineElement-series-diagonal": { strokeWidth: 2, strokeDasharray: "8 5" },
          "& .MuiChartsGrid-line": { stroke: t.grid },
        }}
      >
        <ChartsGrid horizontal />
      </LineChart>

      <BarChart
        width={width}
        height={histHeight}
        skipAnimation
        borderRadius={2}
        xAxis={[
          {
            scaleType: "band",
            data: binLabels,
            label: "Predicted Probability Bin",
          },
        ]}
        yAxis={[
          {
            label: "Count",
            tickFontSize: 40,
            labelFontSize: 14,
            tickLabelStyle: { fontSize: 12 },
          },
        ]}
        series={[
          { data: binsA.map((b) => b.count), label: "Model A", color: t.palette[0] },
          { data: binsB.map((b) => b.count), label: "Model B", color: t.palette[1] },
        ]}
        margin={{ left: 90, right: 40, top: 10, bottom: 60 }}
        slotProps={{ legend: { hidden: true } }}
        sx={{
          "& .MuiChartsAxis-tickLabel": { fontSize: "12px" },
          "& .MuiChartsAxis-label": { fontSize: "14px" },
        }}
      />
    </Box>
  );
}
Runnable source as JSON, for any HTTP client: https://api.anyplot.ai/specs/calibration-curve/muix/code. Any spec id and library id listed in llms-full.txt fit the same URL shape; every URL below is complete and callable.
{
  "spec_id": "calibration-curve",
  "language": "javascript",
  "library": "muix",
  "page": "https://anyplot.ai/calibration-curve/javascript/muix",
  "hub": "https://anyplot.ai/calibration-curve",
  "code_json": "https://api.anyplot.ai/specs/calibration-curve/muix/code",
  "spec_json": "https://api.anyplot.ai/specs/calibration-curve",
  "render_light_png": "https://storage.googleapis.com/anyplot-images/plots/calibration-curve/javascript/muix/plot-light.png",
  "render_dark_png": "https://storage.googleapis.com/anyplot-images/plots/calibration-curve/javascript/muix/plot-dark.png",
  "interactive_light_html": "https://storage.googleapis.com/anyplot-images/plots/calibration-curve/javascript/muix/plot-light.html",
  "interactive_dark_html": "https://storage.googleapis.com/anyplot-images/plots/calibration-curve/javascript/muix/plot-dark.html",
  "quality_score": 90.0,
  "license": "MIT",
  "guide": "https://anyplot.ai/llms.txt"
}
Part of Calibration Curve on anyplot.ai.