The same plot in 14 other libraries — JavaScript: Chart.js, D3.js, Highcharts, MUI X Charts; Python: Altair, Bokeh, lets-plot, Matplotlib, Plotly, plotnine, Pygal, Seaborn; R: ggplot2; Julia: Makie.jl. Compare all 15 side by side: Calibration Curve in Python, R, Julia and JavaScript.
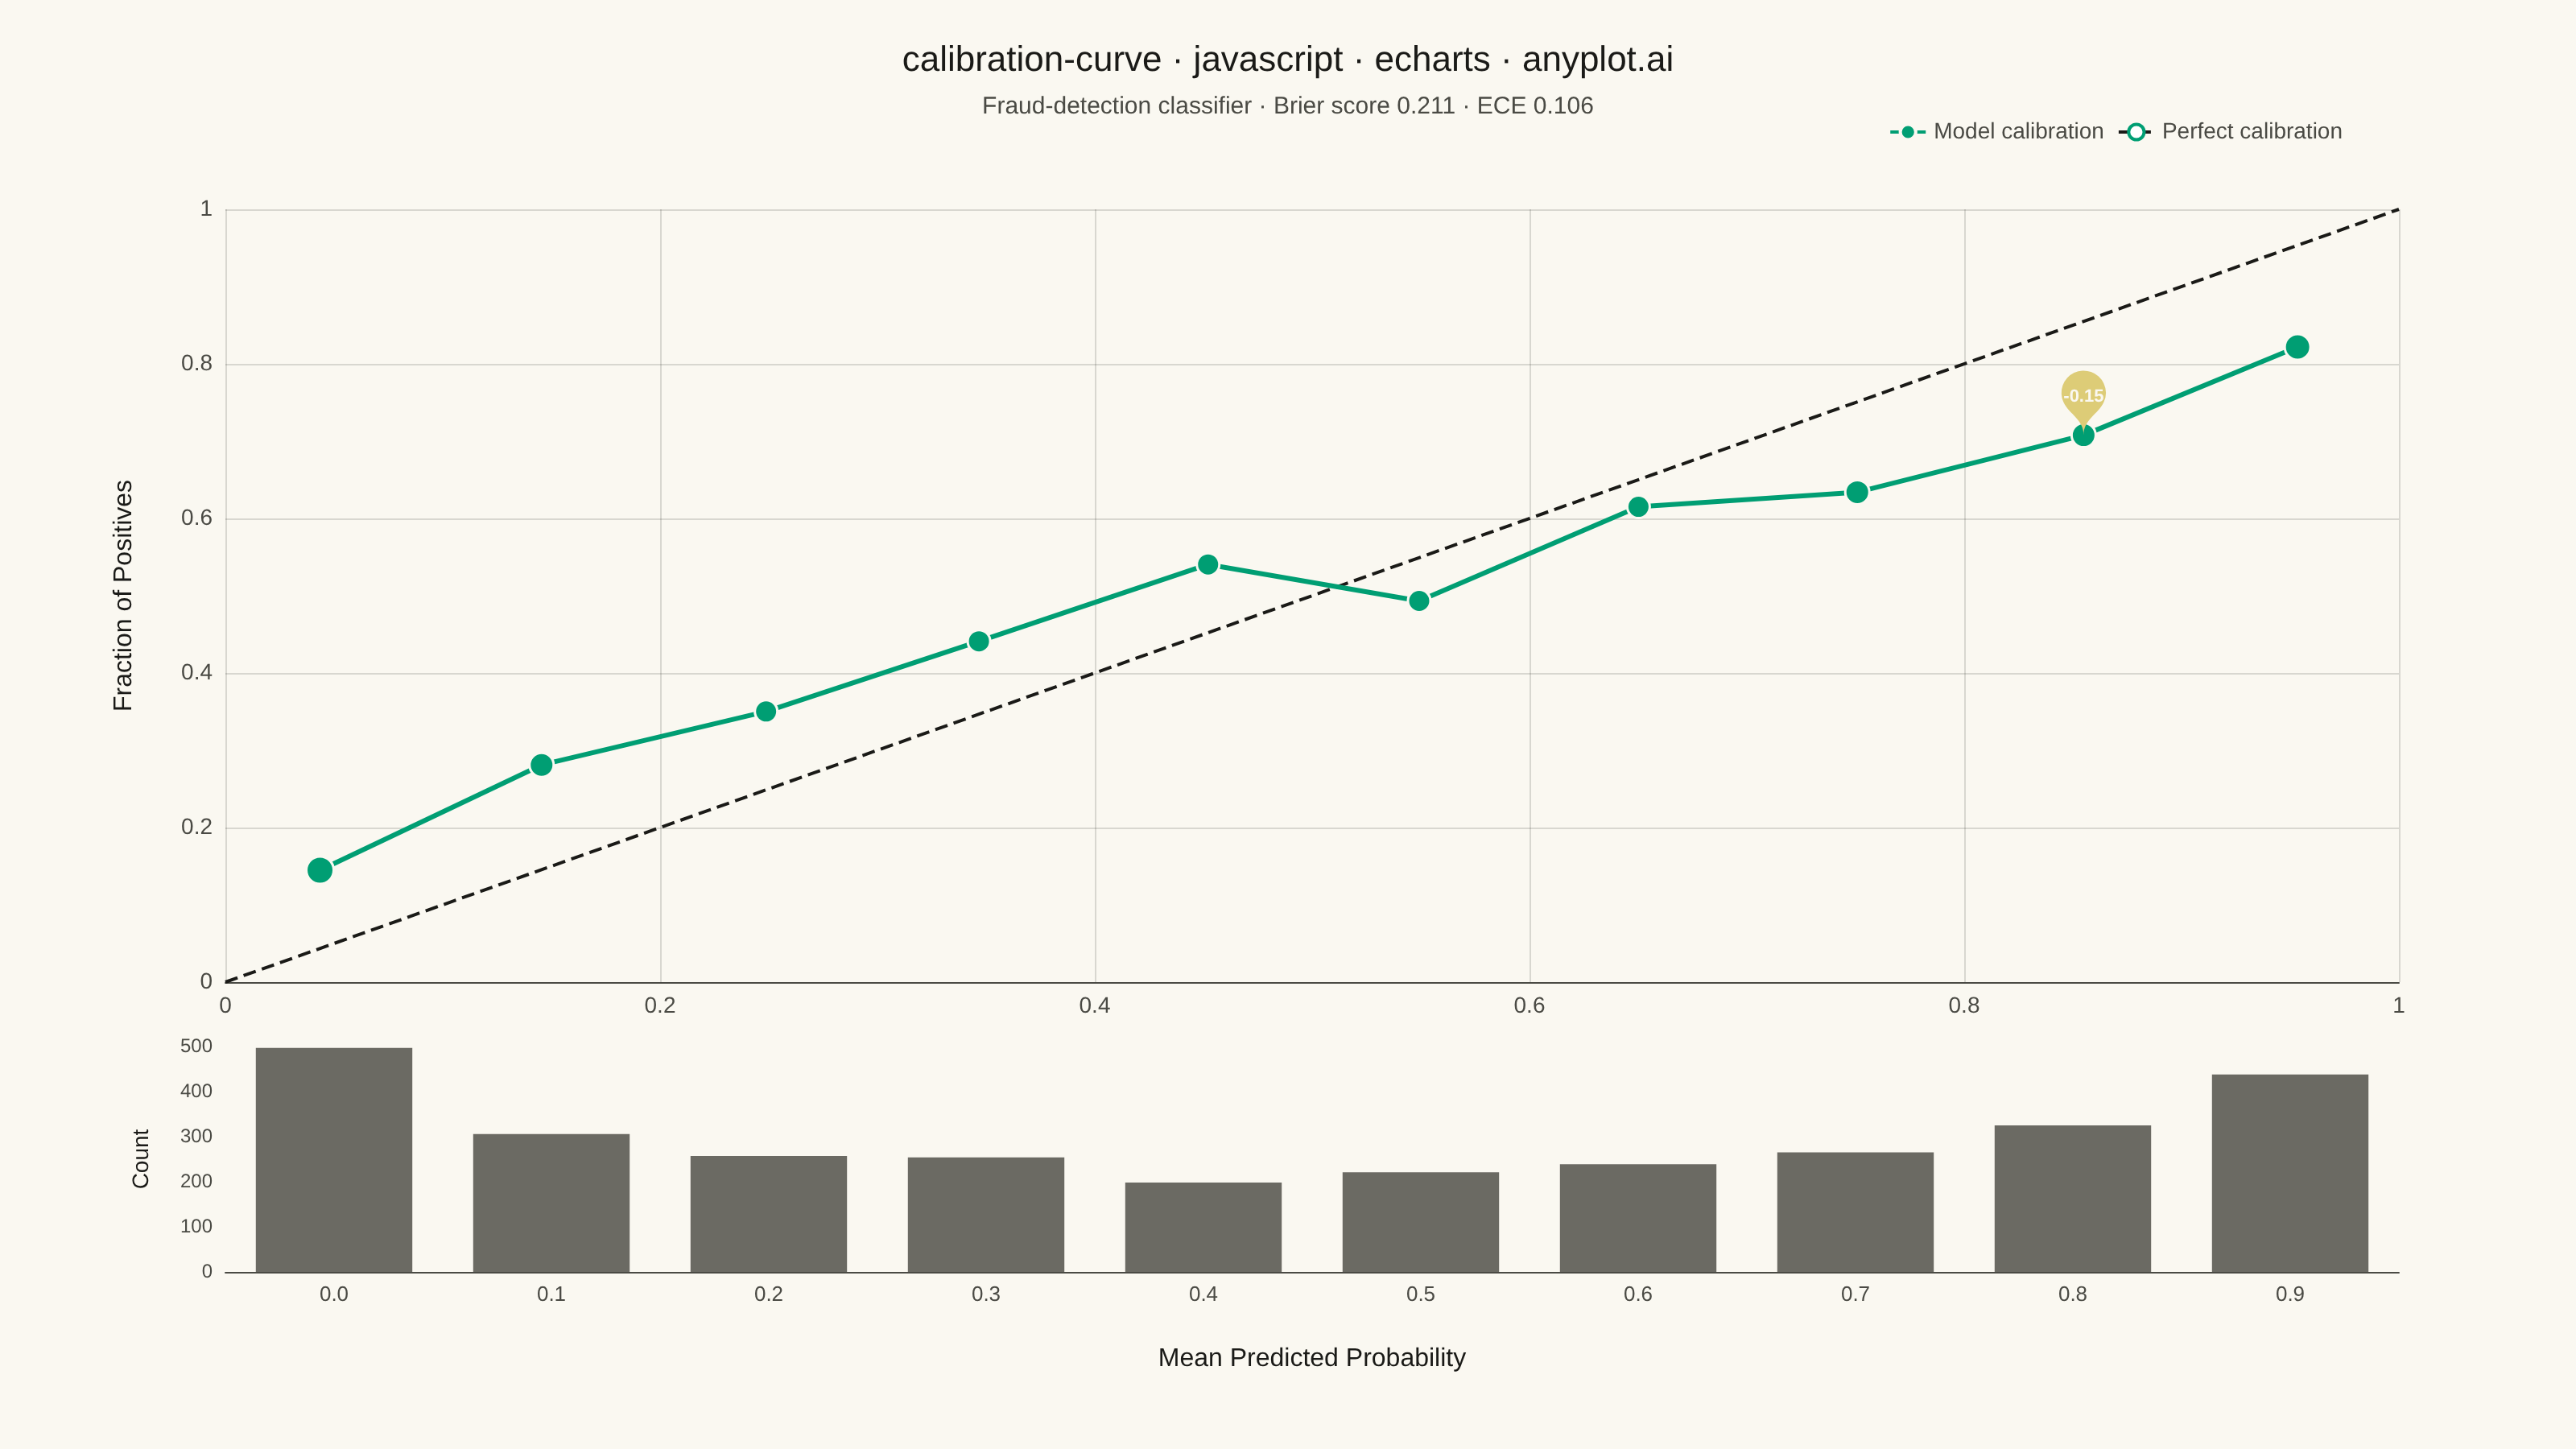
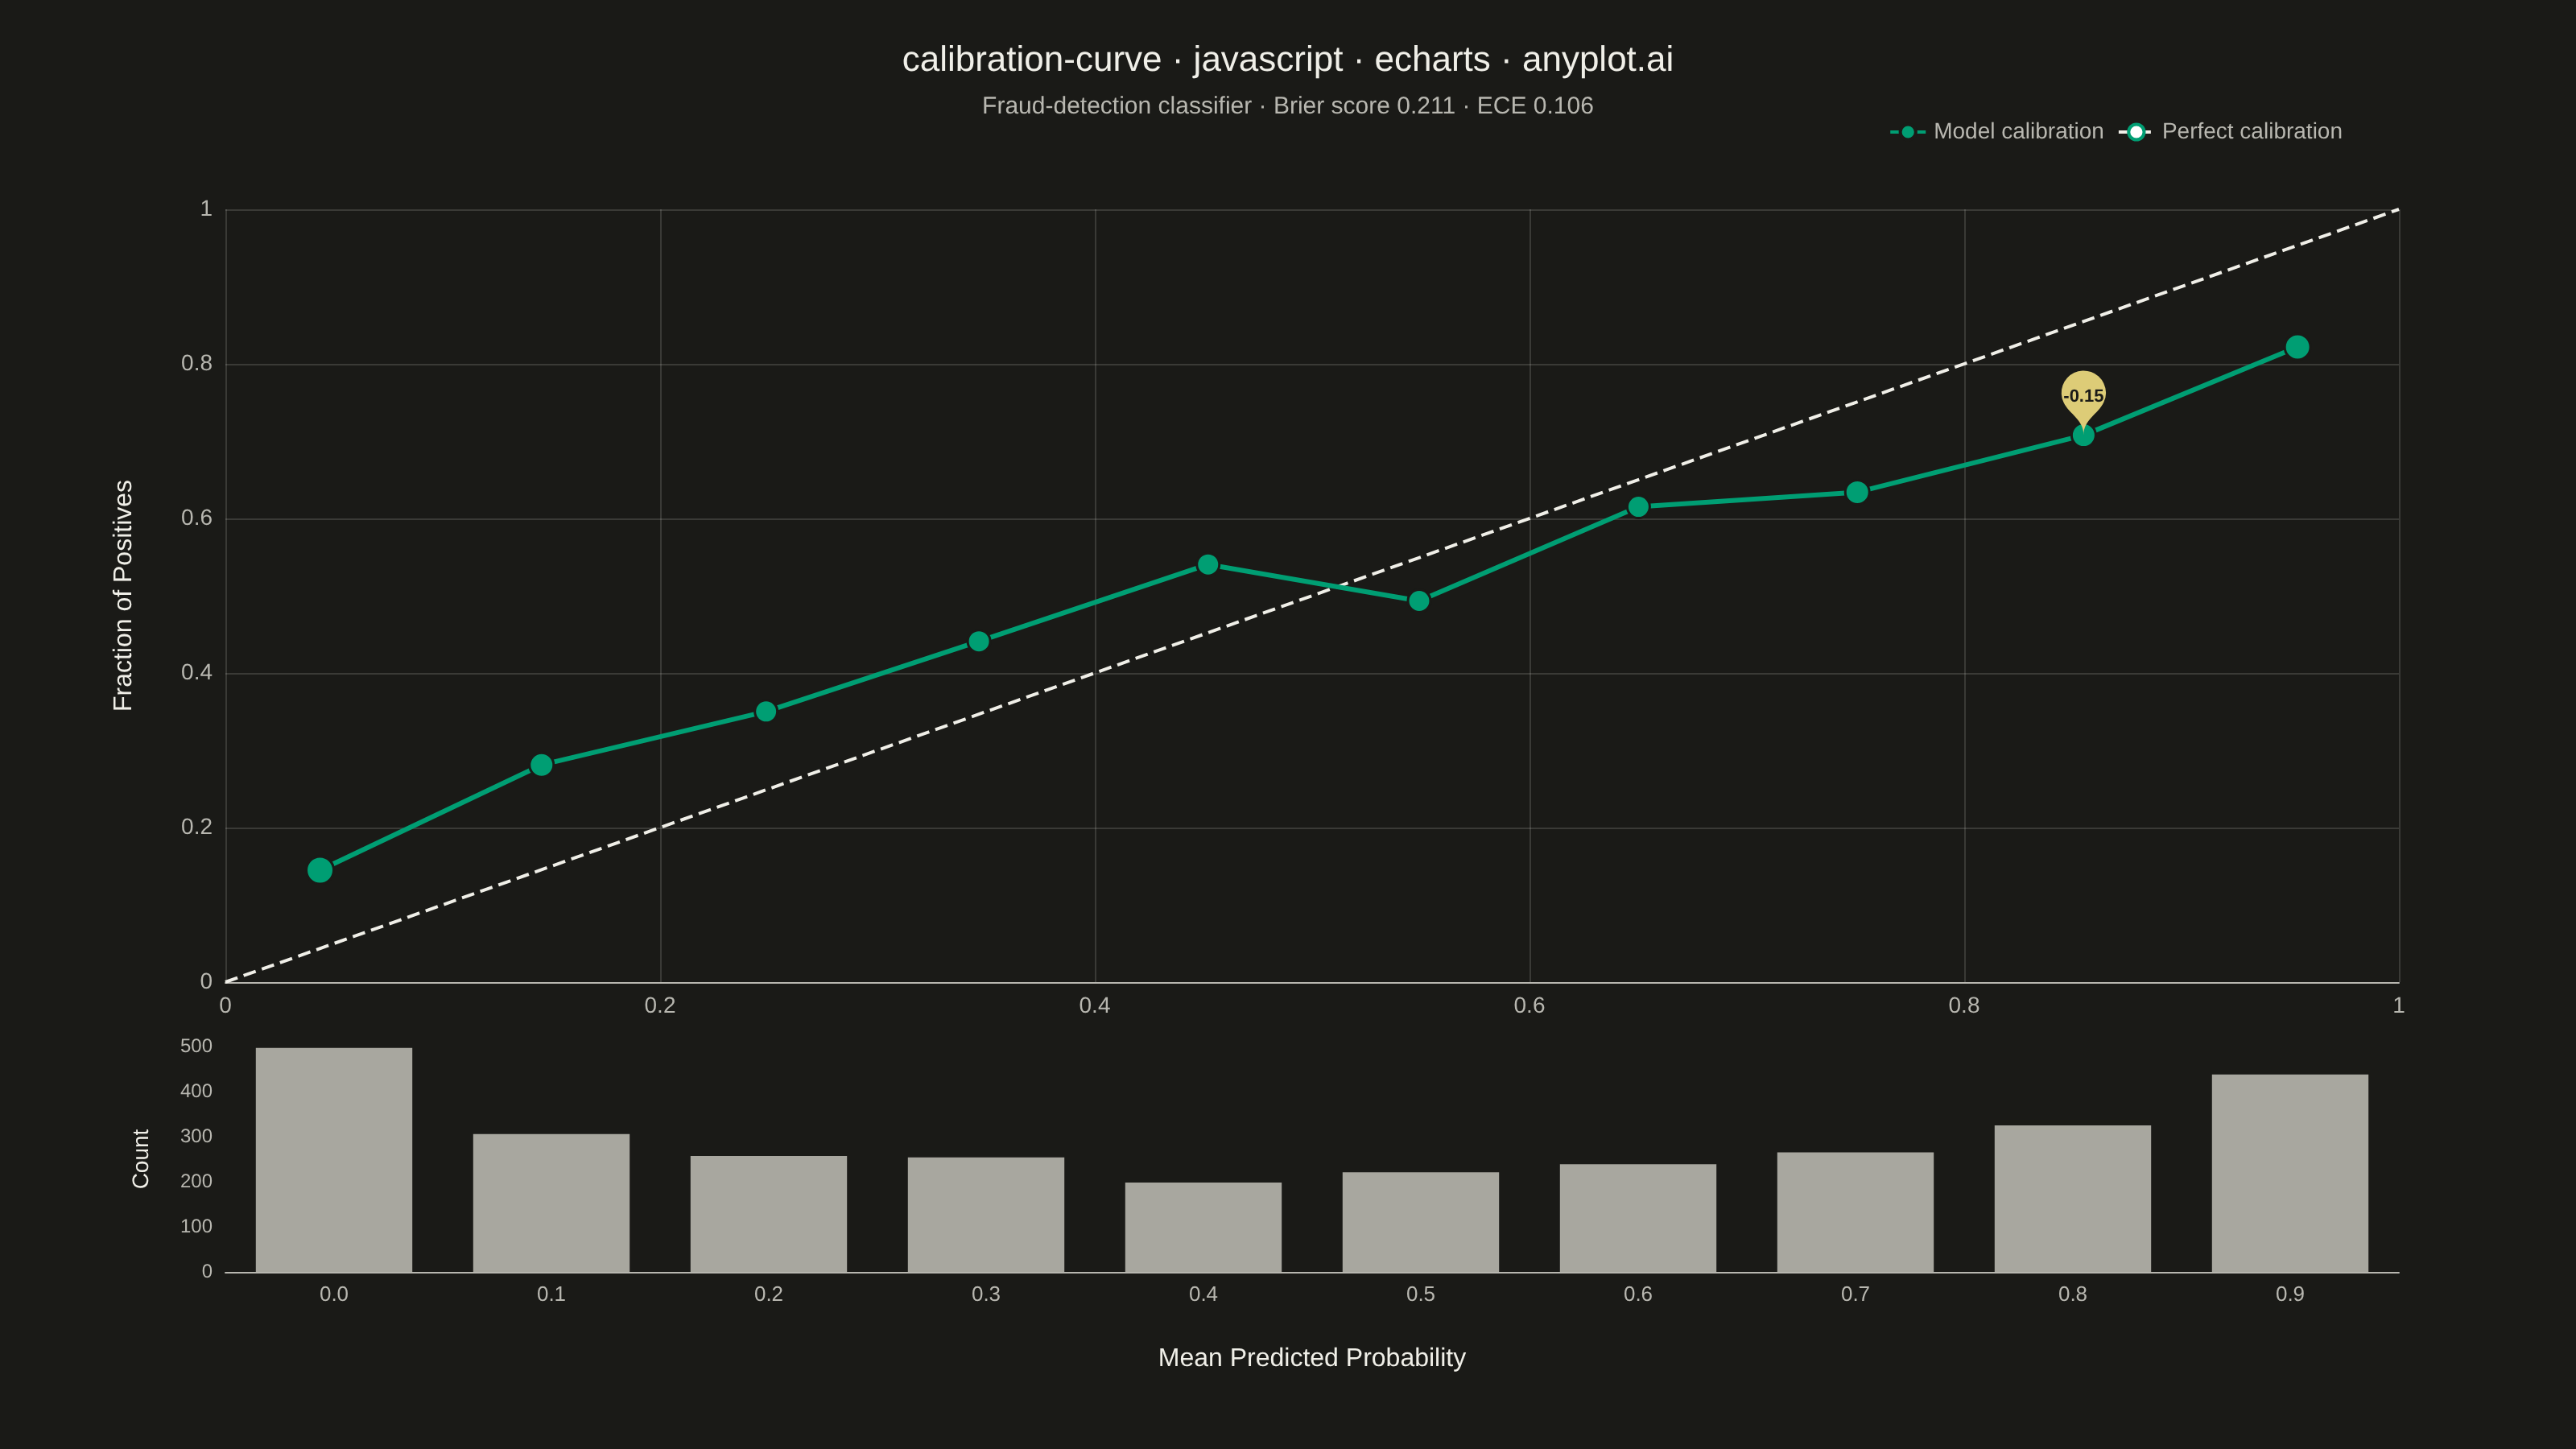
A calibration curve (reliability diagram) visualizes how well the predicted probabilities of a binary classifier match actual outcomes. By plotting the fraction of positives against mean predicted probability in binned intervals, it reveals whether a model is well-calibrated, overconfident, or underconfident. A perfectly calibrated model follows the diagonal line where predicted probability equals observed frequency.
// anyplot.ai
// calibration-curve: Calibration Curve
// Library: echarts 6.1.0 | JavaScript 22.23.2
// Quality: 93/100 | Created: 2026-09-02
//# anyplot-orientation: landscape

const t = window.ANYPLOT_TOKENS;
const MUTED = t.theme === "light" ? "#6B6A63" : "#A8A79F";

// --- Data (in-memory, deterministic) ----------------------------------------
// A deliberately overconfident fraud-detection classifier: the latent risk
// score z sets the true positive rate via a mild sigmoid, but the model
// reports a steeper sigmoid, pushing predicted probabilities toward 0/1
// further than reality warrants.
let seed = 42;
function rand() {
  seed = (seed * 1103515245 + 12345) & 0x7fffffff;
  return seed / 0x7fffffff;
}
function randNormal() {
  const u1 = Math.max(rand(), 1e-9);
  const u2 = rand();
  return Math.sqrt(-2 * Math.log(u1)) * Math.cos(2 * Math.PI * u2);
}
function sigmoid(x) {
  return 1 / (1 + Math.exp(-x));
}

const sampleCount = 3000;
const yTrue = [];
const yProb = [];
for (let i = 0; i < sampleCount; i++) {
  const z = randNormal() * 1.2;
  const trueProb = sigmoid(z);
  yTrue.push(rand() < trueProb ? 1 : 0);
  yProb.push(sigmoid(1.8 * z)); // overconfident: steeper than the true relationship
}

// Bin into 10 equal-width probability intervals.
const binCount = 10;
const binSumProb = new Array(binCount).fill(0);
const binSumPos = new Array(binCount).fill(0);
const binN = new Array(binCount).fill(0);
for (let i = 0; i < sampleCount; i++) {
  const bin = Math.min(binCount - 1, Math.floor(yProb[i] * binCount));
  binSumProb[bin] += yProb[i];
  binSumPos[bin] += yTrue[i];
  binN[bin] += 1;
}

const calibrationPoints = [];
const bubbleSizes = [];
const histCounts = [];
const binLabels = [];
let worstGapIndex = -1;
let worstGap = 0;
for (let b = 0; b < binCount; b++) {
  binLabels.push((b / binCount).toFixed(1));
  histCounts.push(binN[b]);
  if (binN[b] > 0) {
    const meanPred = binSumProb[b] / binN[b];
    const fracPos = binSumPos[b] / binN[b];
    calibrationPoints.push([meanPred, fracPos]);
    bubbleSizes.push(Math.round(8 + 22 * Math.sqrt(binN[b] / sampleCount)));
    const gap = fracPos - meanPred;
    if (Math.abs(gap) > Math.abs(worstGap)) {
      worstGap = gap;
      worstGapIndex = calibrationPoints.length - 1;
    }
  }
}

// Summary metrics.
let brierSum = 0;
for (let i = 0; i < sampleCount; i++) {
  brierSum += (yProb[i] - yTrue[i]) ** 2;
}
const brierScore = brierSum / sampleCount;

let ece = 0;
for (let b = 0; b < binCount; b++) {
  if (binN[b] > 0) {
    const meanPred = binSumProb[b] / binN[b];
    const fracPos = binSumPos[b] / binN[b];
    ece += (binN[b] / sampleCount) * Math.abs(fracPos - meanPred);
  }
}

// --- Init ---------------------------------------------------------------
const chart = echarts.init(document.getElementById("container"));

// --- Option ---------------------------------------------------------------
chart.setOption({
  animation: false,
  color: t.palette,
  backgroundColor: "transparent",
  title: {
    text: "calibration-curve · javascript · echarts · anyplot.ai",
    subtext: `Fraud-detection classifier · Brier score ${brierScore.toFixed(3)} · ECE ${ece.toFixed(3)}`,
    left: "center",
    top: 22,
    textStyle: { color: t.ink, fontSize: 22, fontWeight: 500 },
    subtextStyle: { color: t.inkSoft, fontSize: 15 },
  },
  legend: {
    data: ["Model calibration", "Perfect calibration"],
    top: 70,
    right: 140,
    itemWidth: 22,
    itemHeight: 12,
    textStyle: { color: t.inkSoft, fontSize: 14 },
  },
  grid: [
    { left: 140, right: 110, top: 130, height: 480 },
    { left: 140, right: 110, top: 650, height: 140 },
  ],
  xAxis: [
    {
      gridIndex: 0,
      type: "value",
      min: 0,
      max: 1,
      axisLabel: { color: t.inkSoft, fontSize: 14 },
      axisLine: { lineStyle: { color: t.inkSoft } },
      axisTick: { show: false },
      splitLine: { show: true, lineStyle: { color: t.grid } },
    },
    {
      gridIndex: 1,
      type: "category",
      data: binLabels,
      name: "Mean Predicted Probability",
      nameLocation: "middle",
      nameGap: 46,
      nameTextStyle: { color: t.ink, fontSize: 16 },
      axisLabel: { color: t.inkSoft, fontSize: 13 },
      axisLine: { lineStyle: { color: t.inkSoft } },
      axisTick: { show: false },
      splitLine: { show: false },
    },
  ],
  yAxis: [
    {
      gridIndex: 0,
      type: "value",
      min: 0,
      max: 1,
      name: "Fraction of Positives",
      nameLocation: "middle",
      nameGap: 55,
      nameTextStyle: { color: t.ink, fontSize: 16 },
      axisLabel: { color: t.inkSoft, fontSize: 14 },
      axisLine: { show: false },
      axisTick: { show: false },
      splitLine: { show: true, lineStyle: { color: t.grid } },
    },
    {
      gridIndex: 1,
      type: "value",
      name: "Count",
      nameLocation: "middle",
      nameGap: 45,
      nameTextStyle: { color: t.ink, fontSize: 14 },
      axisLabel: { color: t.inkSoft, fontSize: 12 },
      axisLine: { show: false },
      axisTick: { show: false },
      splitLine: { show: false },
    },
  ],
  series: [
    {
      name: "Perfect calibration",
      type: "line",
      xAxisIndex: 0,
      yAxisIndex: 0,
      data: [
        [0, 0],
        [1, 1],
      ],
      showSymbol: false,
      lineStyle: { color: t.ink, width: 2, type: "dashed" },
      z: 1,
    },
    {
      name: "Model calibration",
      type: "line",
      xAxisIndex: 0,
      yAxisIndex: 0,
      data: calibrationPoints,
      symbol: "circle",
      symbolSize: (val, params) => bubbleSizes[params.dataIndex],
      lineStyle: { color: t.palette[0], width: 3 },
      itemStyle: { color: t.palette[0], borderColor: t.pageBg, borderWidth: 1.5 },
      markPoint: {
        symbol: "pin",
        symbolSize: 46,
        itemStyle: { color: t.amber },
        label: {
          color: t.pageBg,
          fontSize: 11,
          fontWeight: 600,
          formatter: () => (worstGap >= 0 ? "+" : "") + worstGap.toFixed(2),
        },
        data:
          worstGapIndex >= 0
            ? [{ name: "Largest gap", coord: calibrationPoints[worstGapIndex], value: worstGap }]
            : [],
      },
      z: 2,
    },
    {
      name: "Predicted probability distribution",
      type: "bar",
      xAxisIndex: 1,
      yAxisIndex: 1,
      data: histCounts,
      barWidth: "72%",
      itemStyle: { color: MUTED },
    },
  ],
});
Runnable source as JSON, for any HTTP client: https://api.anyplot.ai/specs/calibration-curve/echarts/code. Any spec id and library id listed in llms-full.txt fit the same URL shape; every URL below is complete and callable.
{
  "spec_id": "calibration-curve",
  "language": "javascript",
  "library": "echarts",
  "page": "https://anyplot.ai/calibration-curve/javascript/echarts",
  "hub": "https://anyplot.ai/calibration-curve",
  "code_json": "https://api.anyplot.ai/specs/calibration-curve/echarts/code",
  "spec_json": "https://api.anyplot.ai/specs/calibration-curve",
  "render_light_png": "https://storage.googleapis.com/anyplot-images/plots/calibration-curve/javascript/echarts/plot-light.png",
  "render_dark_png": "https://storage.googleapis.com/anyplot-images/plots/calibration-curve/javascript/echarts/plot-dark.png",
  "interactive_light_html": "https://storage.googleapis.com/anyplot-images/plots/calibration-curve/javascript/echarts/plot-light.html",
  "interactive_dark_html": "https://storage.googleapis.com/anyplot-images/plots/calibration-curve/javascript/echarts/plot-dark.html",
  "quality_score": 93.0,
  "license": "MIT",
  "guide": "https://anyplot.ai/llms.txt"
}
Part of Calibration Curve on anyplot.ai.