The same plot in 14 other libraries — JavaScript: D3.js, Apache ECharts, Highcharts, MUI X Charts; Python: Altair, Bokeh, lets-plot, Matplotlib, Plotly, plotnine, Pygal, Seaborn; R: ggplot2; Julia: Makie.jl. Compare all 15 side by side: Calibration Curve in Python, R, Julia and JavaScript.
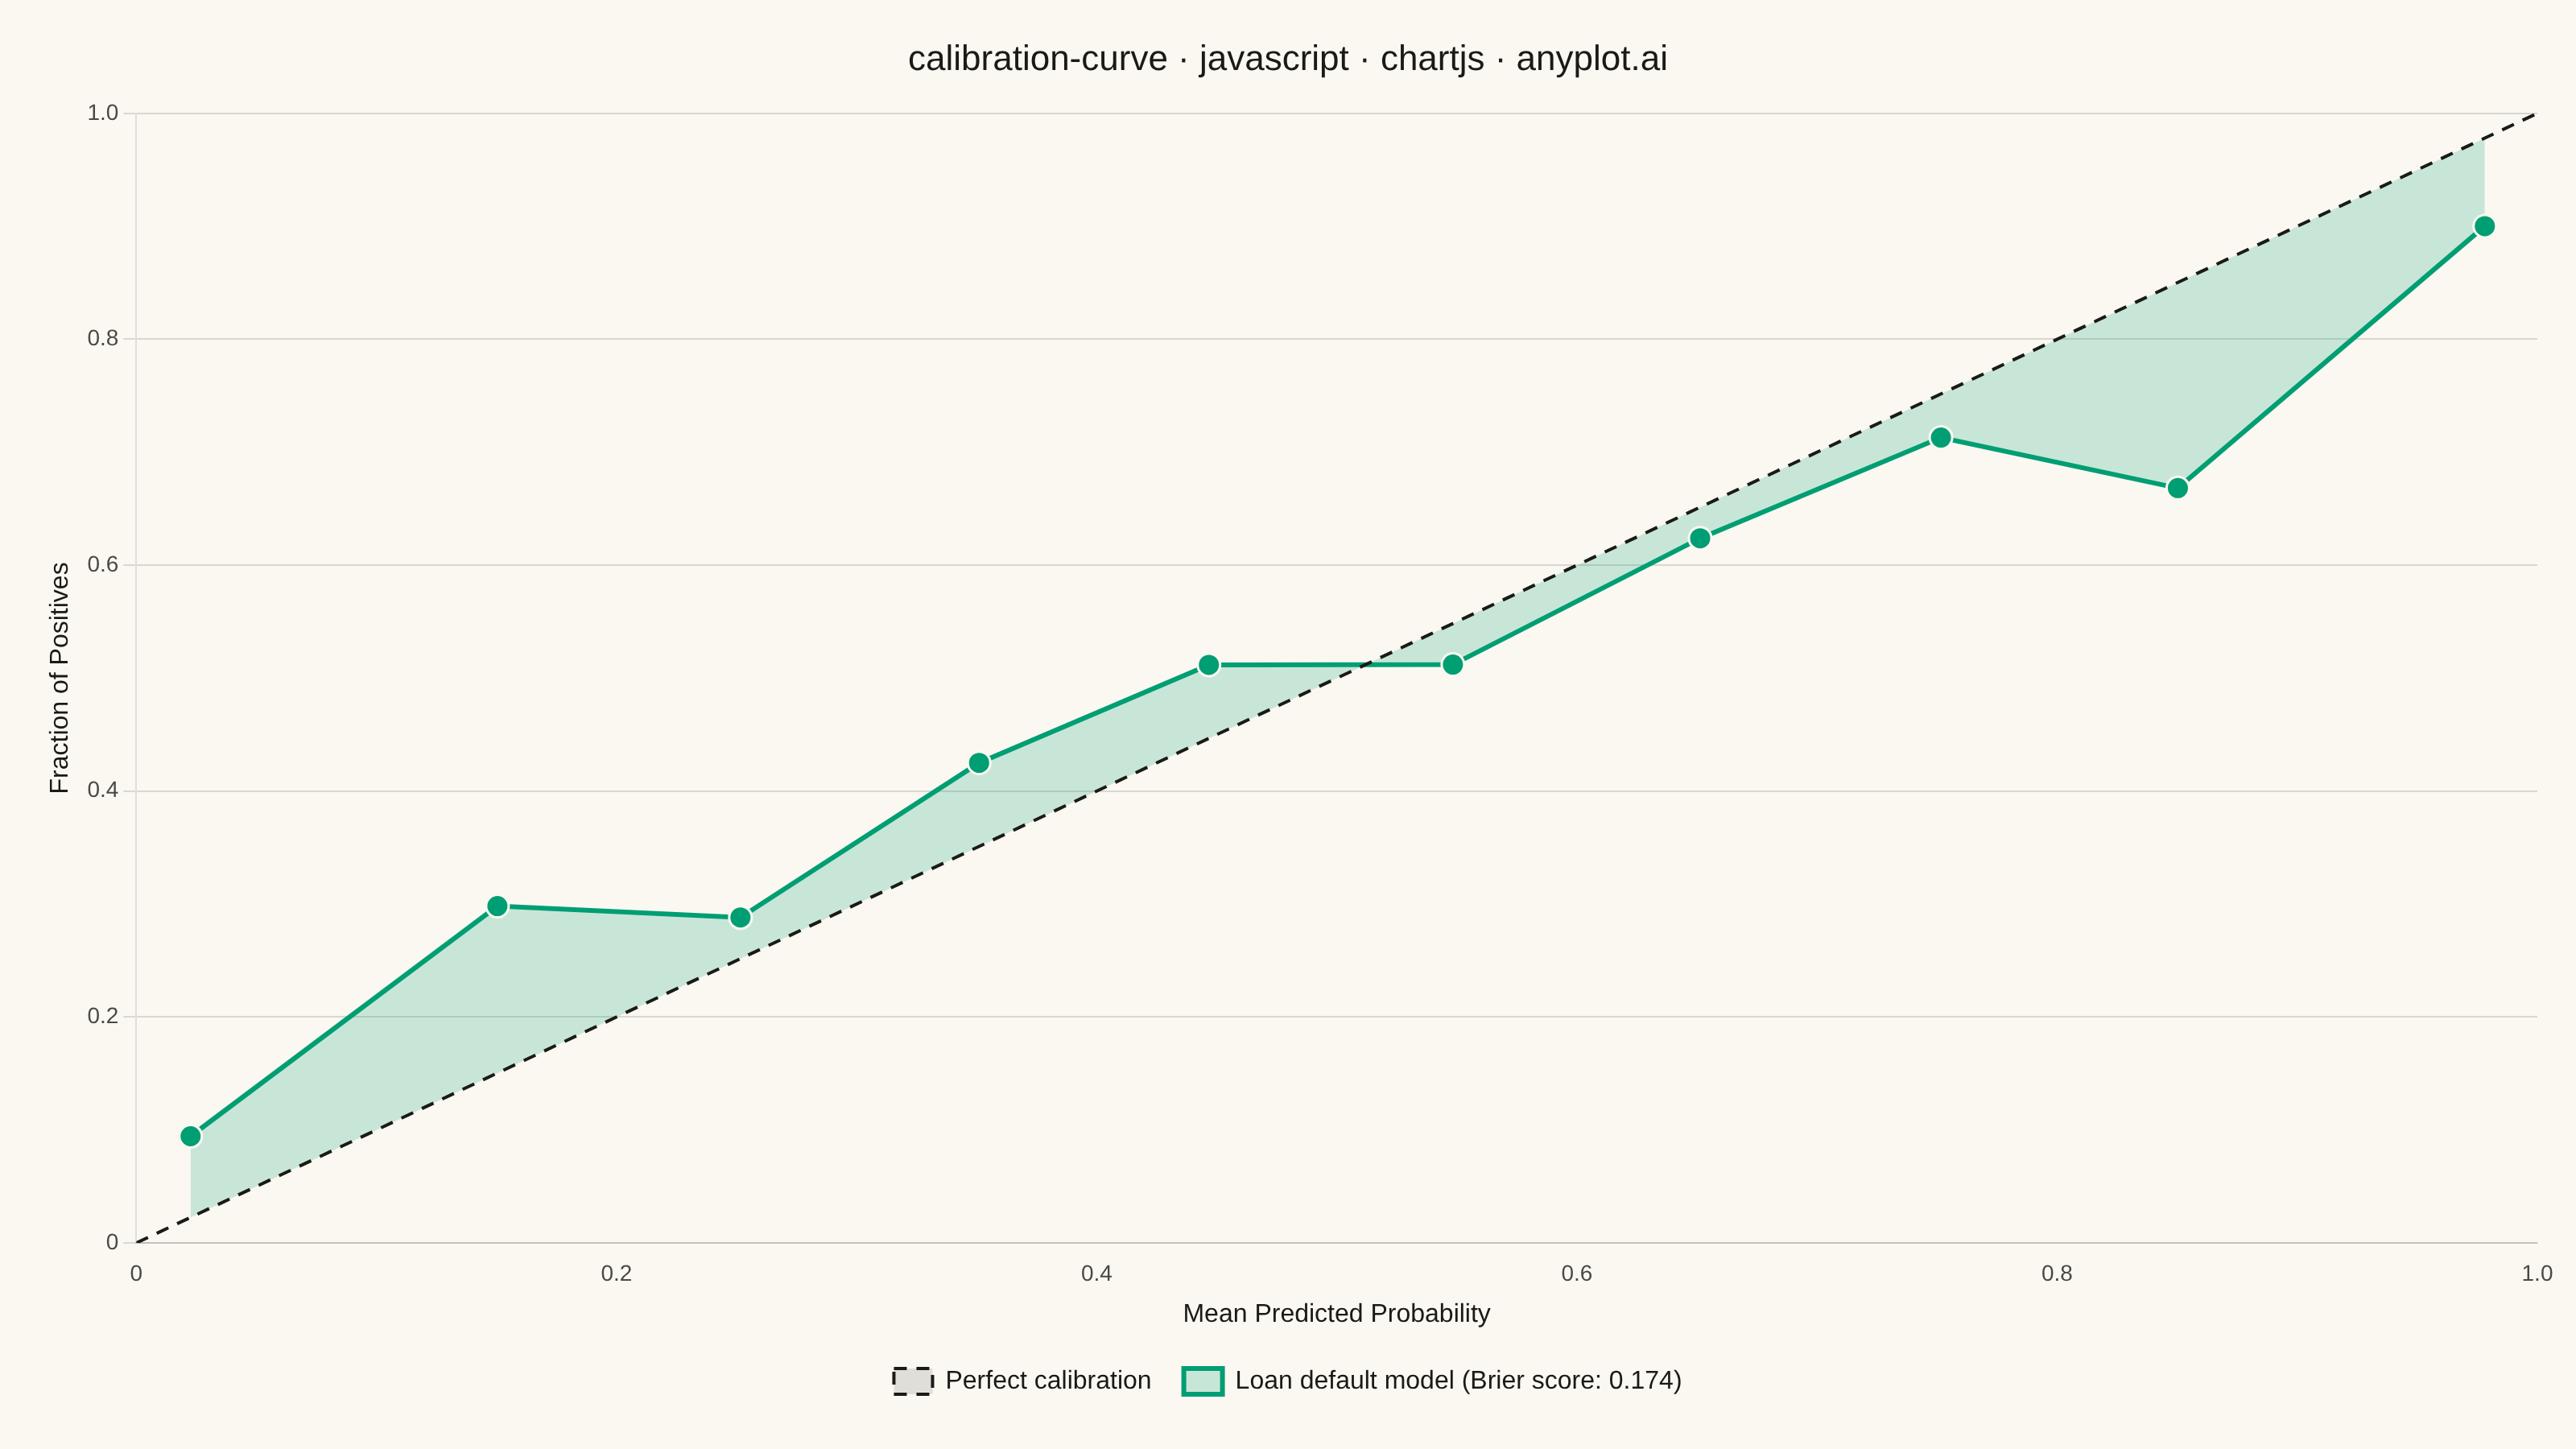
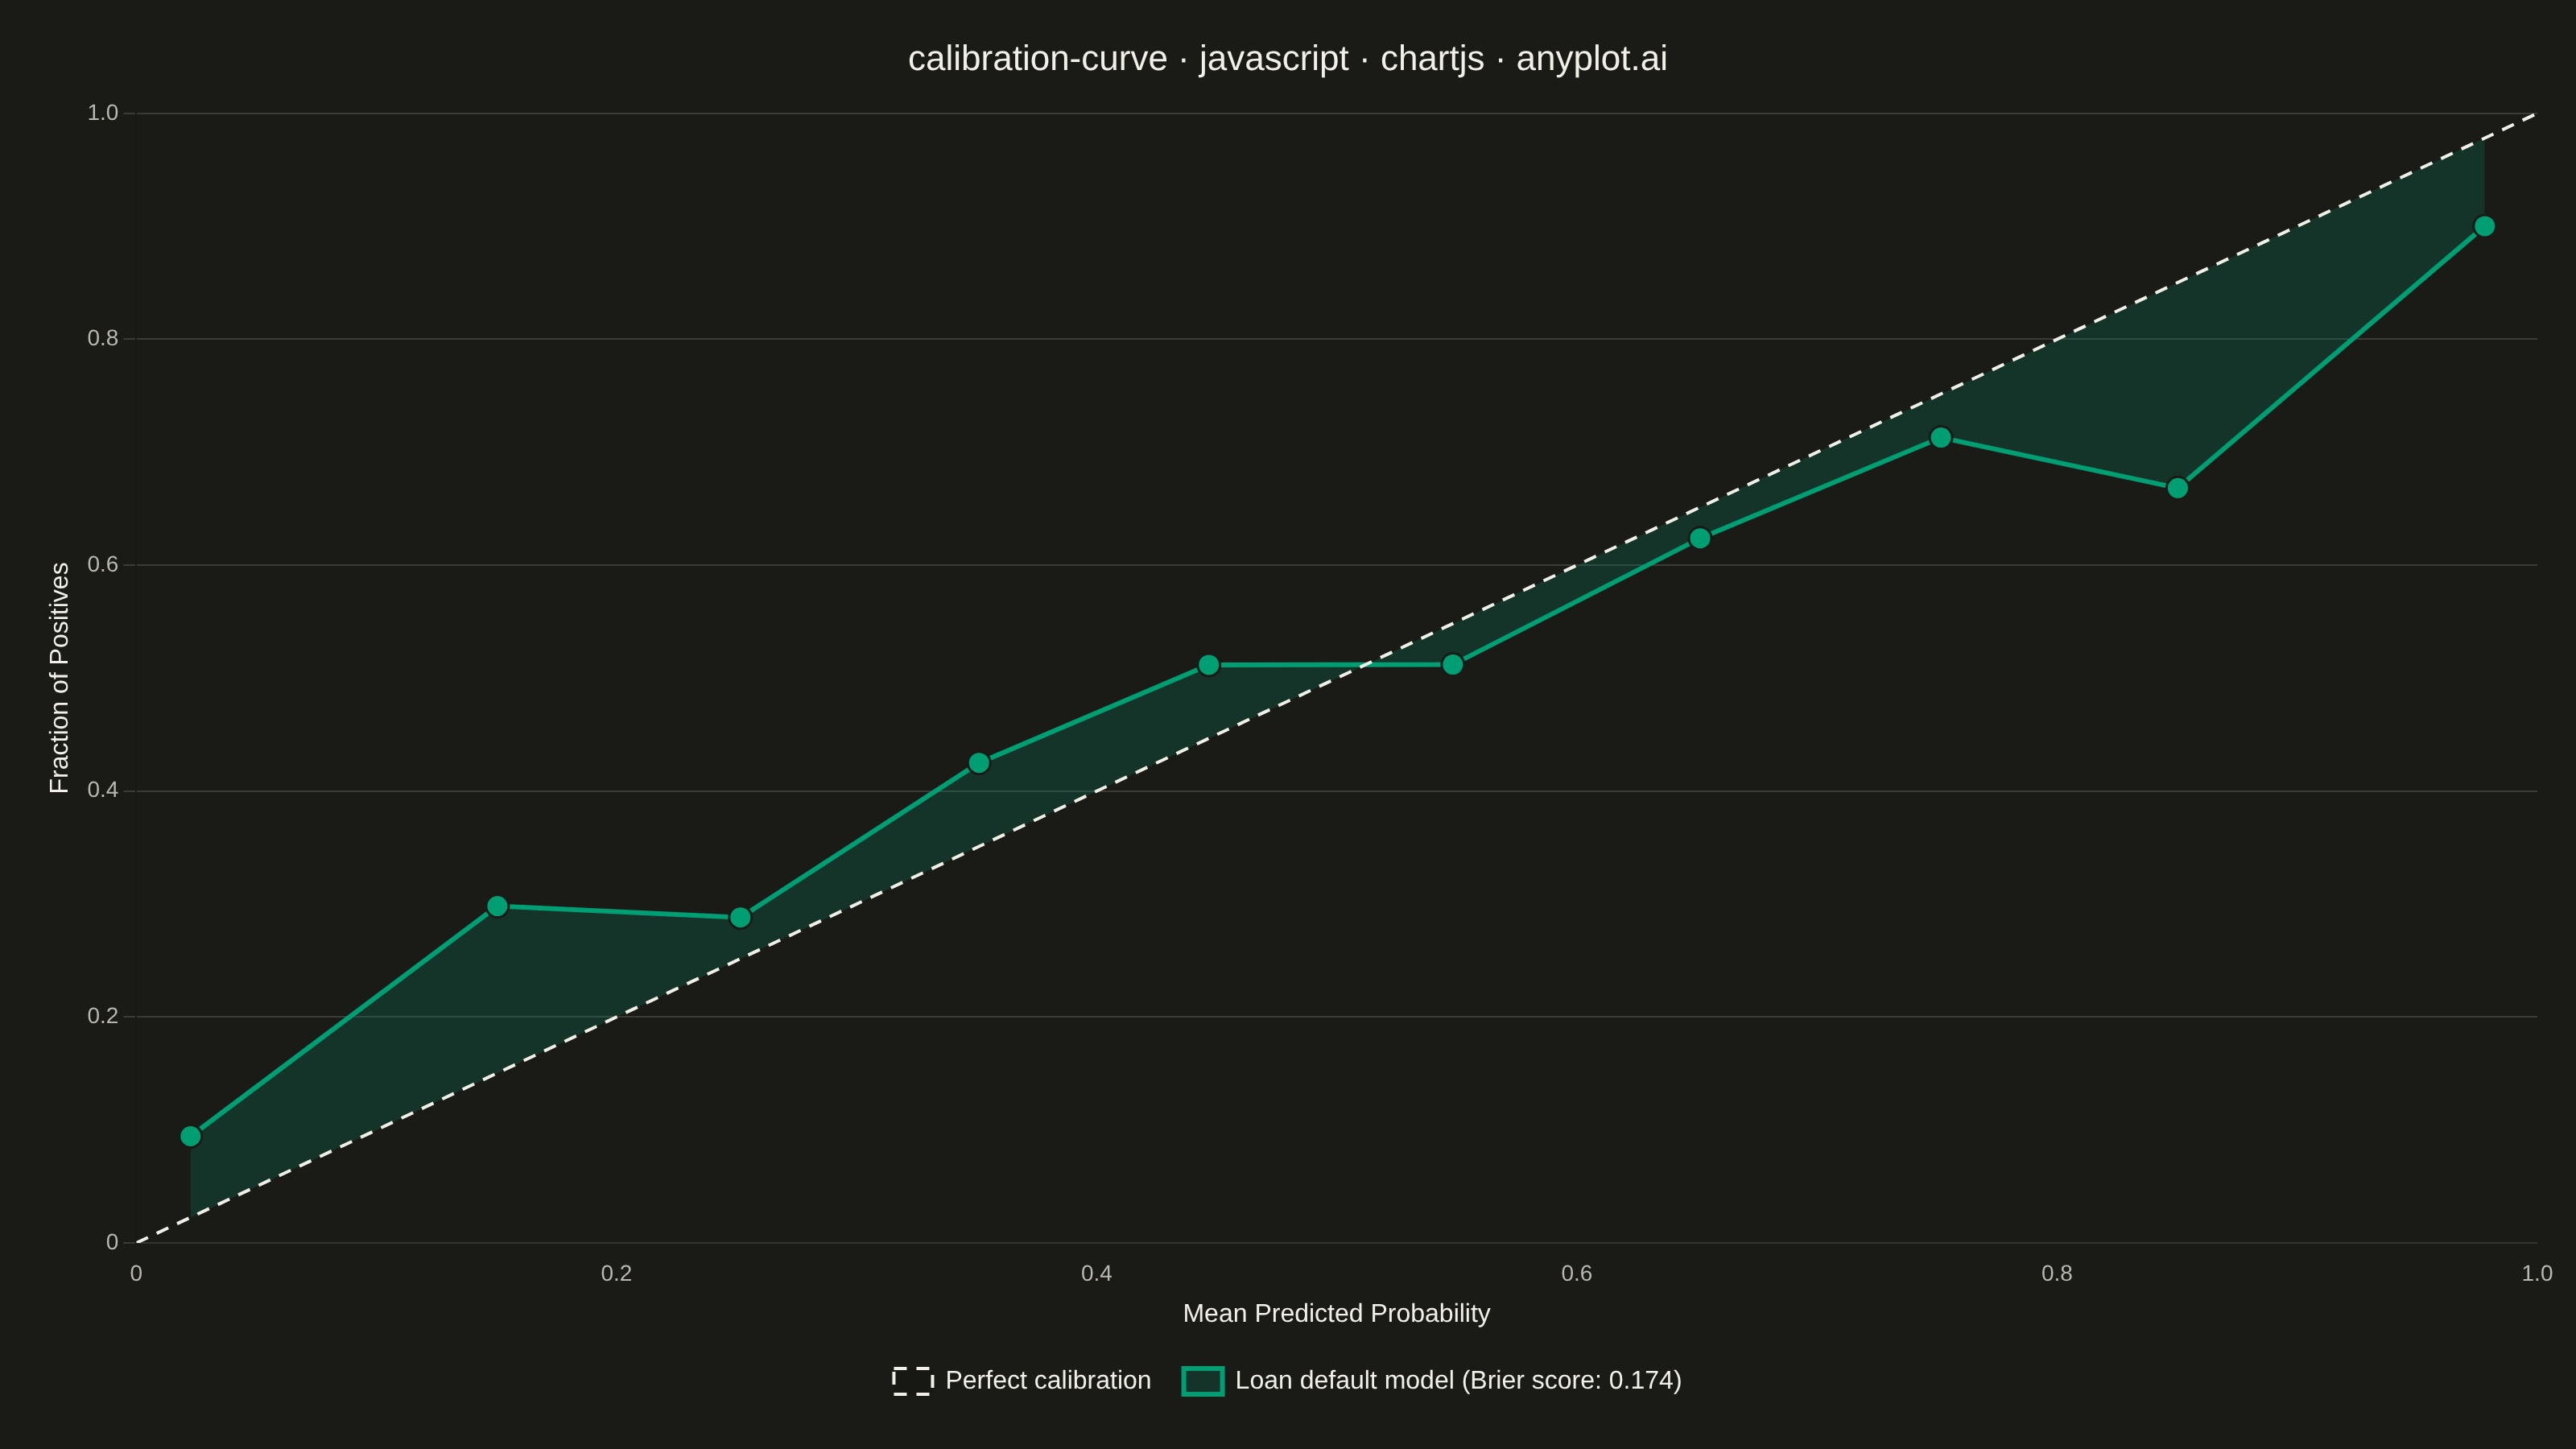
A calibration curve (reliability diagram) visualizes how well the predicted probabilities of a binary classifier match actual outcomes. By plotting the fraction of positives against mean predicted probability in binned intervals, it reveals whether a model is well-calibrated, overconfident, or underconfident. A perfectly calibrated model follows the diagonal line where predicted probability equals observed frequency.
// anyplot.ai
// calibration-curve: Calibration Curve
// Library: chartjs 4.4.7 | JavaScript 22.23.2
// Quality: 90/100 | Created: 2026-09-02

const t = window.ANYPLOT_TOKENS;

// --- Data (in-memory, deterministic) ----------------------------------------
// Loan default risk model: y_true = actual default (0/1), y_prob = predicted
// default probability from a mildly overconfident classifier. Small LCG for
// reproducible pseudo-randomness (the browser has no seeded RNG).
let seed = 42;
const rand = () => {
  seed = (1103515245 * seed + 12345) % 2147483648;
  return seed / 2147483648;
};

const sampleCount = 3000;
const yTrue = [];
const yProb = [];
for (let i = 0; i < sampleCount; i++) {
  const trueRisk = rand();
  const defaulted = rand() < trueRisk ? 1 : 0;
  // Overconfident model: pushes predictions away from 0.5 toward the extremes.
  const predictedRisk = Math.min(0.99, Math.max(0.01, 0.5 + (trueRisk - 0.5) * 1.4));
  yTrue.push(defaulted);
  yProb.push(predictedRisk);
}

// Brier score: mean squared error between predicted probability and outcome
const brierScore = yProb.reduce((sum, p, i) => sum + (p - yTrue[i]) ** 2, 0) / sampleCount;

// Bin predictions into 10 equal-width intervals, then compute per-bin means
const binCount = 10;
const bins = Array.from({ length: binCount }, () => ({ probSum: 0, positives: 0, count: 0 }));
for (let i = 0; i < sampleCount; i++) {
  const binIndex = Math.min(binCount - 1, Math.floor(yProb[i] * binCount));
  bins[binIndex].probSum += yProb[i];
  bins[binIndex].positives += yTrue[i];
  bins[binIndex].count += 1;
}
const calibrationPoints = bins
  .filter((bin) => bin.count > 0)
  .map((bin) => ({ x: bin.probSum / bin.count, y: bin.positives / bin.count }));

// --- Mount -------------------------------------------------------------------
const canvas = document.createElement("canvas");
document.getElementById("container").appendChild(canvas);

// --- Chart -------------------------------------------------------------------
new Chart(canvas, {
  type: "line",
  data: {
    datasets: [
      {
        label: "Perfect calibration",
        data: [
          { x: 0, y: 0 },
          { x: 1, y: 1 },
        ],
        borderColor: t.ink,
        borderDash: [8, 6],
        borderWidth: 2,
        pointRadius: 0,
        fill: false,
        tension: 0,
      },
      {
        label: `Loan default model (Brier score: ${brierScore.toFixed(3)})`,
        data: calibrationPoints,
        borderColor: t.palette[0],
        backgroundColor: `${t.palette[0]}33`,
        borderWidth: 3,
        pointRadius: 7,
        pointHoverRadius: 7,
        pointBackgroundColor: t.palette[0],
        pointBorderColor: t.pageBg,
        pointBorderWidth: 1.5,
        fill: "-1",
        tension: 0,
      },
    ],
  },
  options: {
    responsive: true,
    maintainAspectRatio: false,
    animation: false,
    layout: { padding: 24 },
    plugins: {
      title: {
        display: true,
        text: "calibration-curve · javascript · chartjs · anyplot.ai",
        color: t.ink,
        font: { size: 22, weight: "500" },
        padding: { bottom: 20 },
      },
      legend: {
        position: "bottom",
        labels: { color: t.ink, font: { size: 16 }, boxWidth: 24, padding: 20 },
      },
    },
    scales: {
      x: {
        type: "linear",
        min: 0,
        max: 1,
        ticks: { color: t.inkSoft, font: { size: 14 }, stepSize: 0.2 },
        grid: { display: false },
        title: { display: true, text: "Mean Predicted Probability", color: t.ink, font: { size: 16 } },
      },
      y: {
        type: "linear",
        min: 0,
        max: 1,
        ticks: { color: t.inkSoft, font: { size: 14 }, stepSize: 0.2 },
        grid: { color: t.grid },
        title: { display: true, text: "Fraction of Positives", color: t.ink, font: { size: 16 } },
      },
    },
  },
});
Runnable source as JSON, for any HTTP client: https://api.anyplot.ai/specs/calibration-curve/chartjs/code. Any spec id and library id listed in llms-full.txt fit the same URL shape; every URL below is complete and callable.
{
  "spec_id": "calibration-curve",
  "language": "javascript",
  "library": "chartjs",
  "page": "https://anyplot.ai/calibration-curve/javascript/chartjs",
  "hub": "https://anyplot.ai/calibration-curve",
  "code_json": "https://api.anyplot.ai/specs/calibration-curve/chartjs/code",
  "spec_json": "https://api.anyplot.ai/specs/calibration-curve",
  "render_light_png": "https://storage.googleapis.com/anyplot-images/plots/calibration-curve/javascript/chartjs/plot-light.png",
  "render_dark_png": "https://storage.googleapis.com/anyplot-images/plots/calibration-curve/javascript/chartjs/plot-dark.png",
  "interactive_light_html": "https://storage.googleapis.com/anyplot-images/plots/calibration-curve/javascript/chartjs/plot-light.html",
  "interactive_dark_html": "https://storage.googleapis.com/anyplot-images/plots/calibration-curve/javascript/chartjs/plot-dark.html",
  "quality_score": 90.0,
  "license": "MIT",
  "guide": "https://anyplot.ai/llms.txt"
}
Part of Calibration Curve on anyplot.ai.