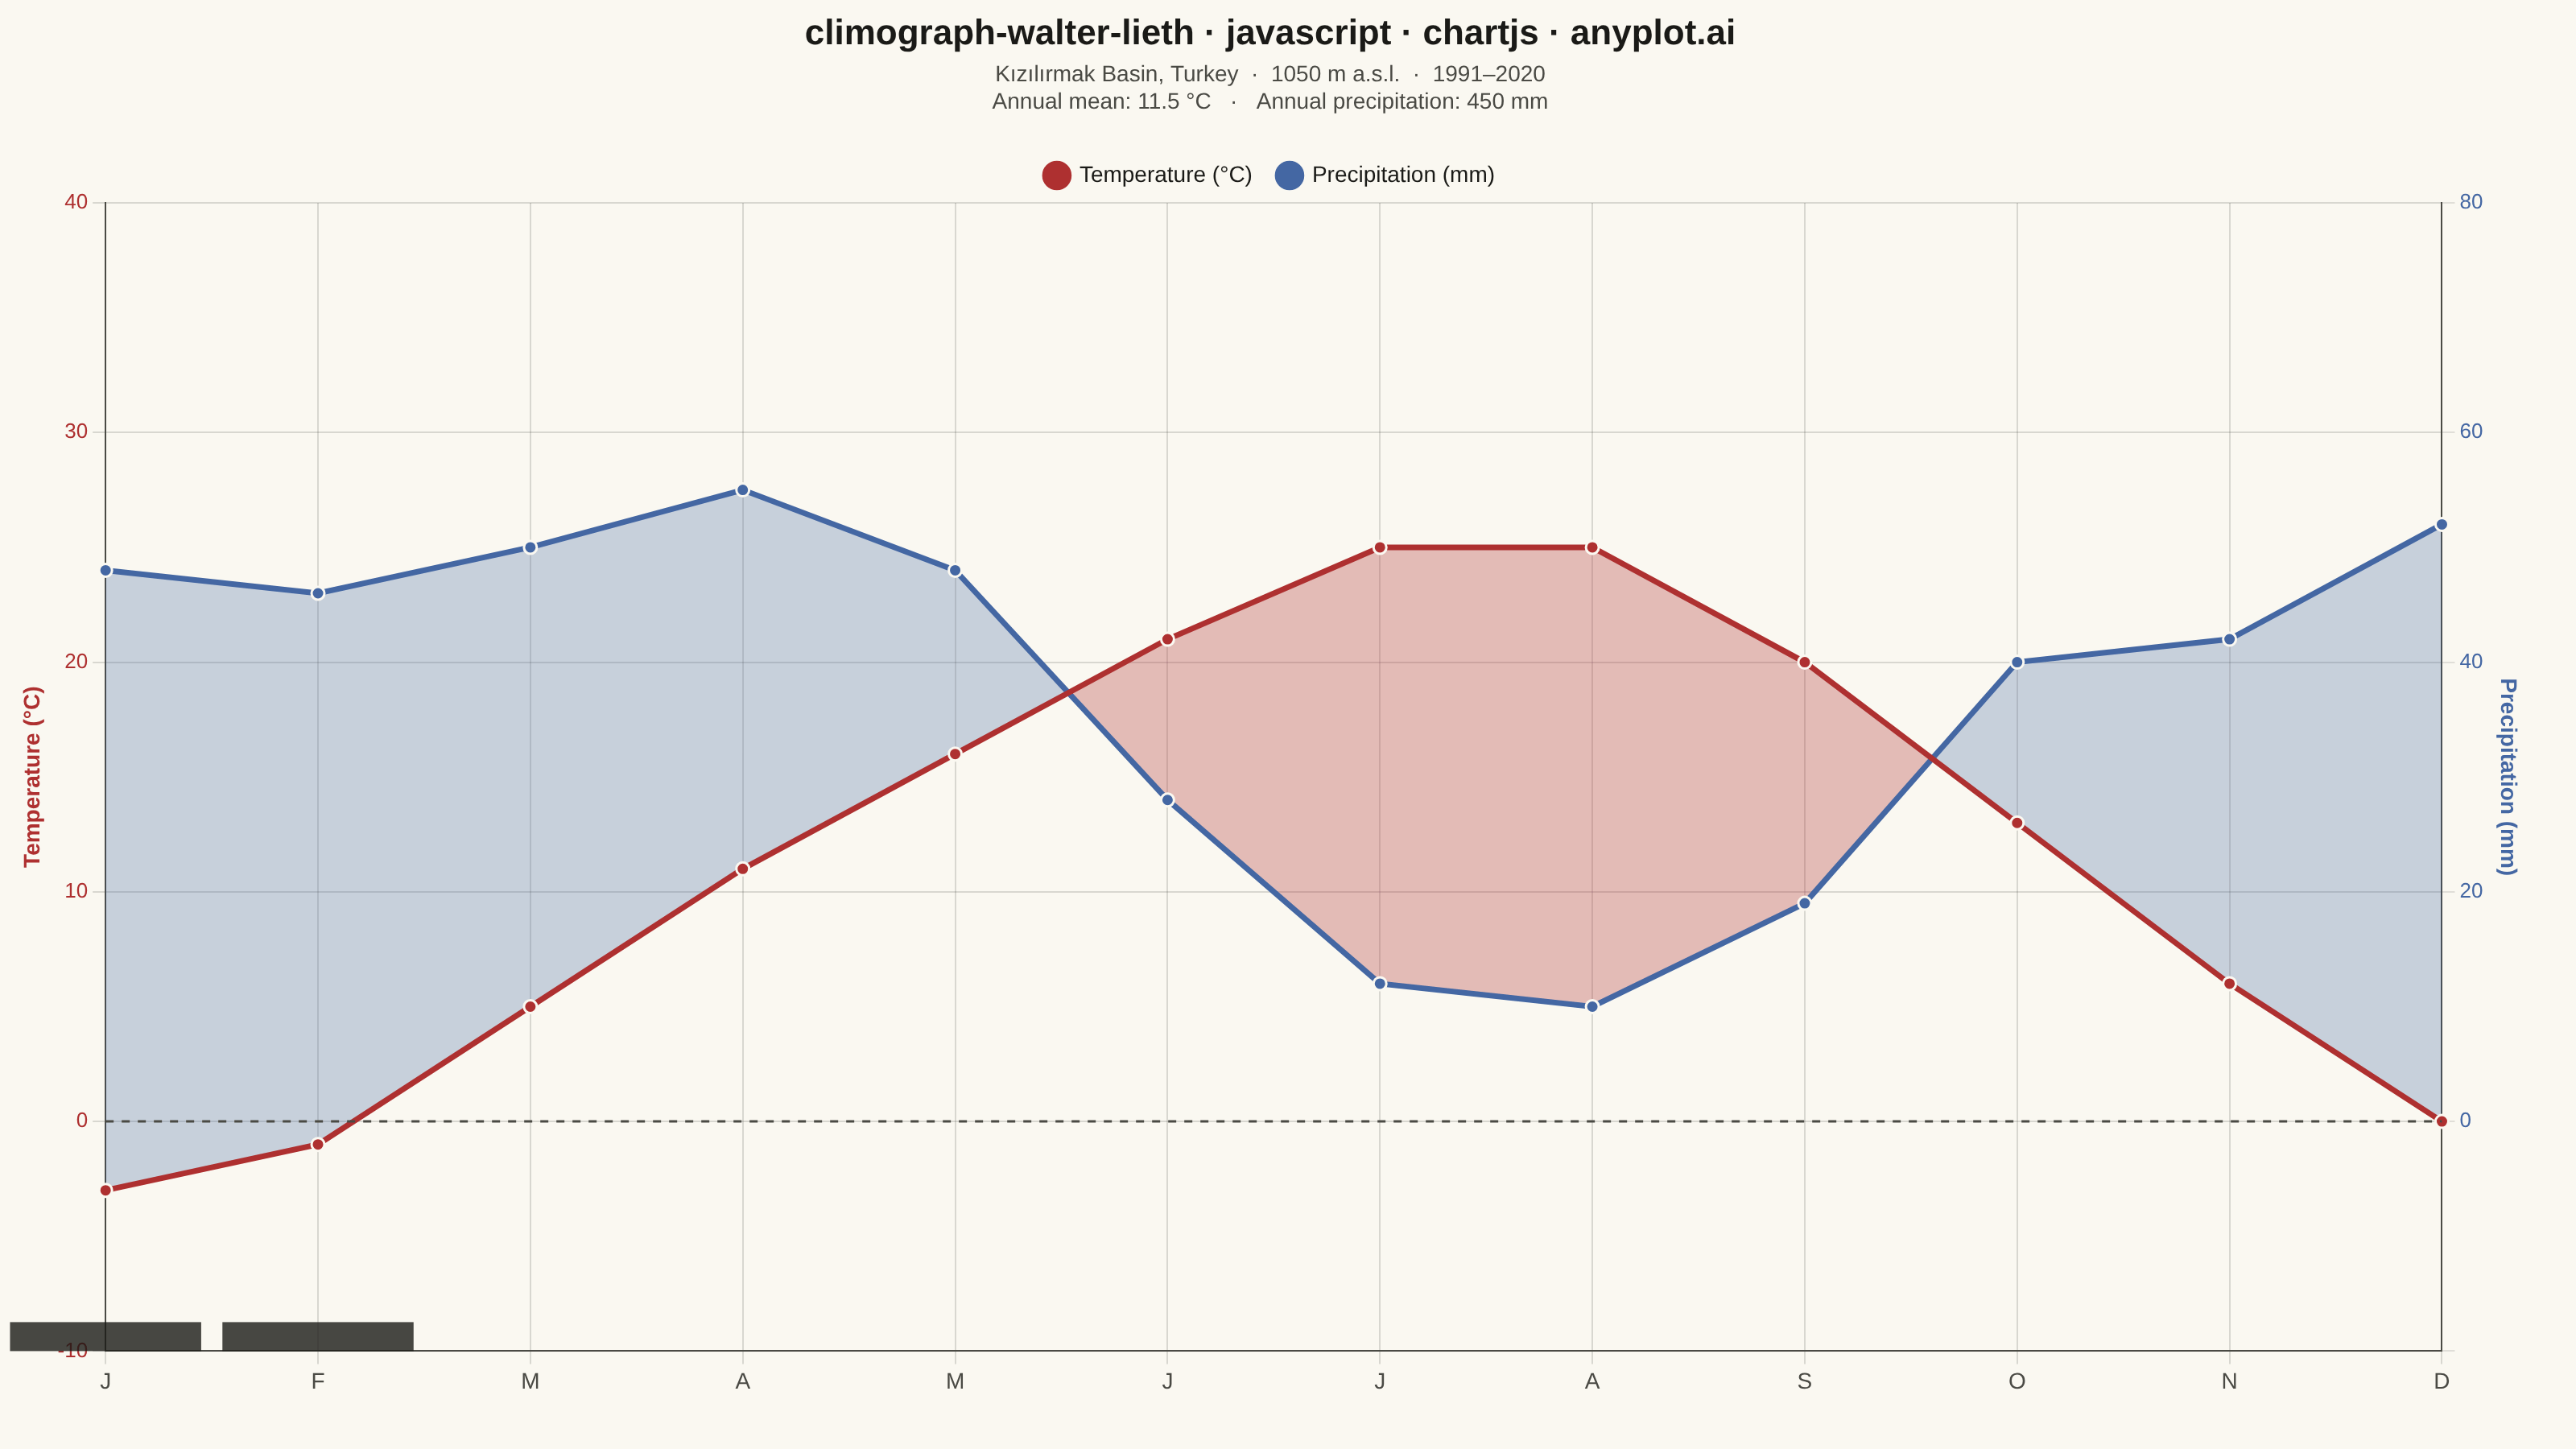
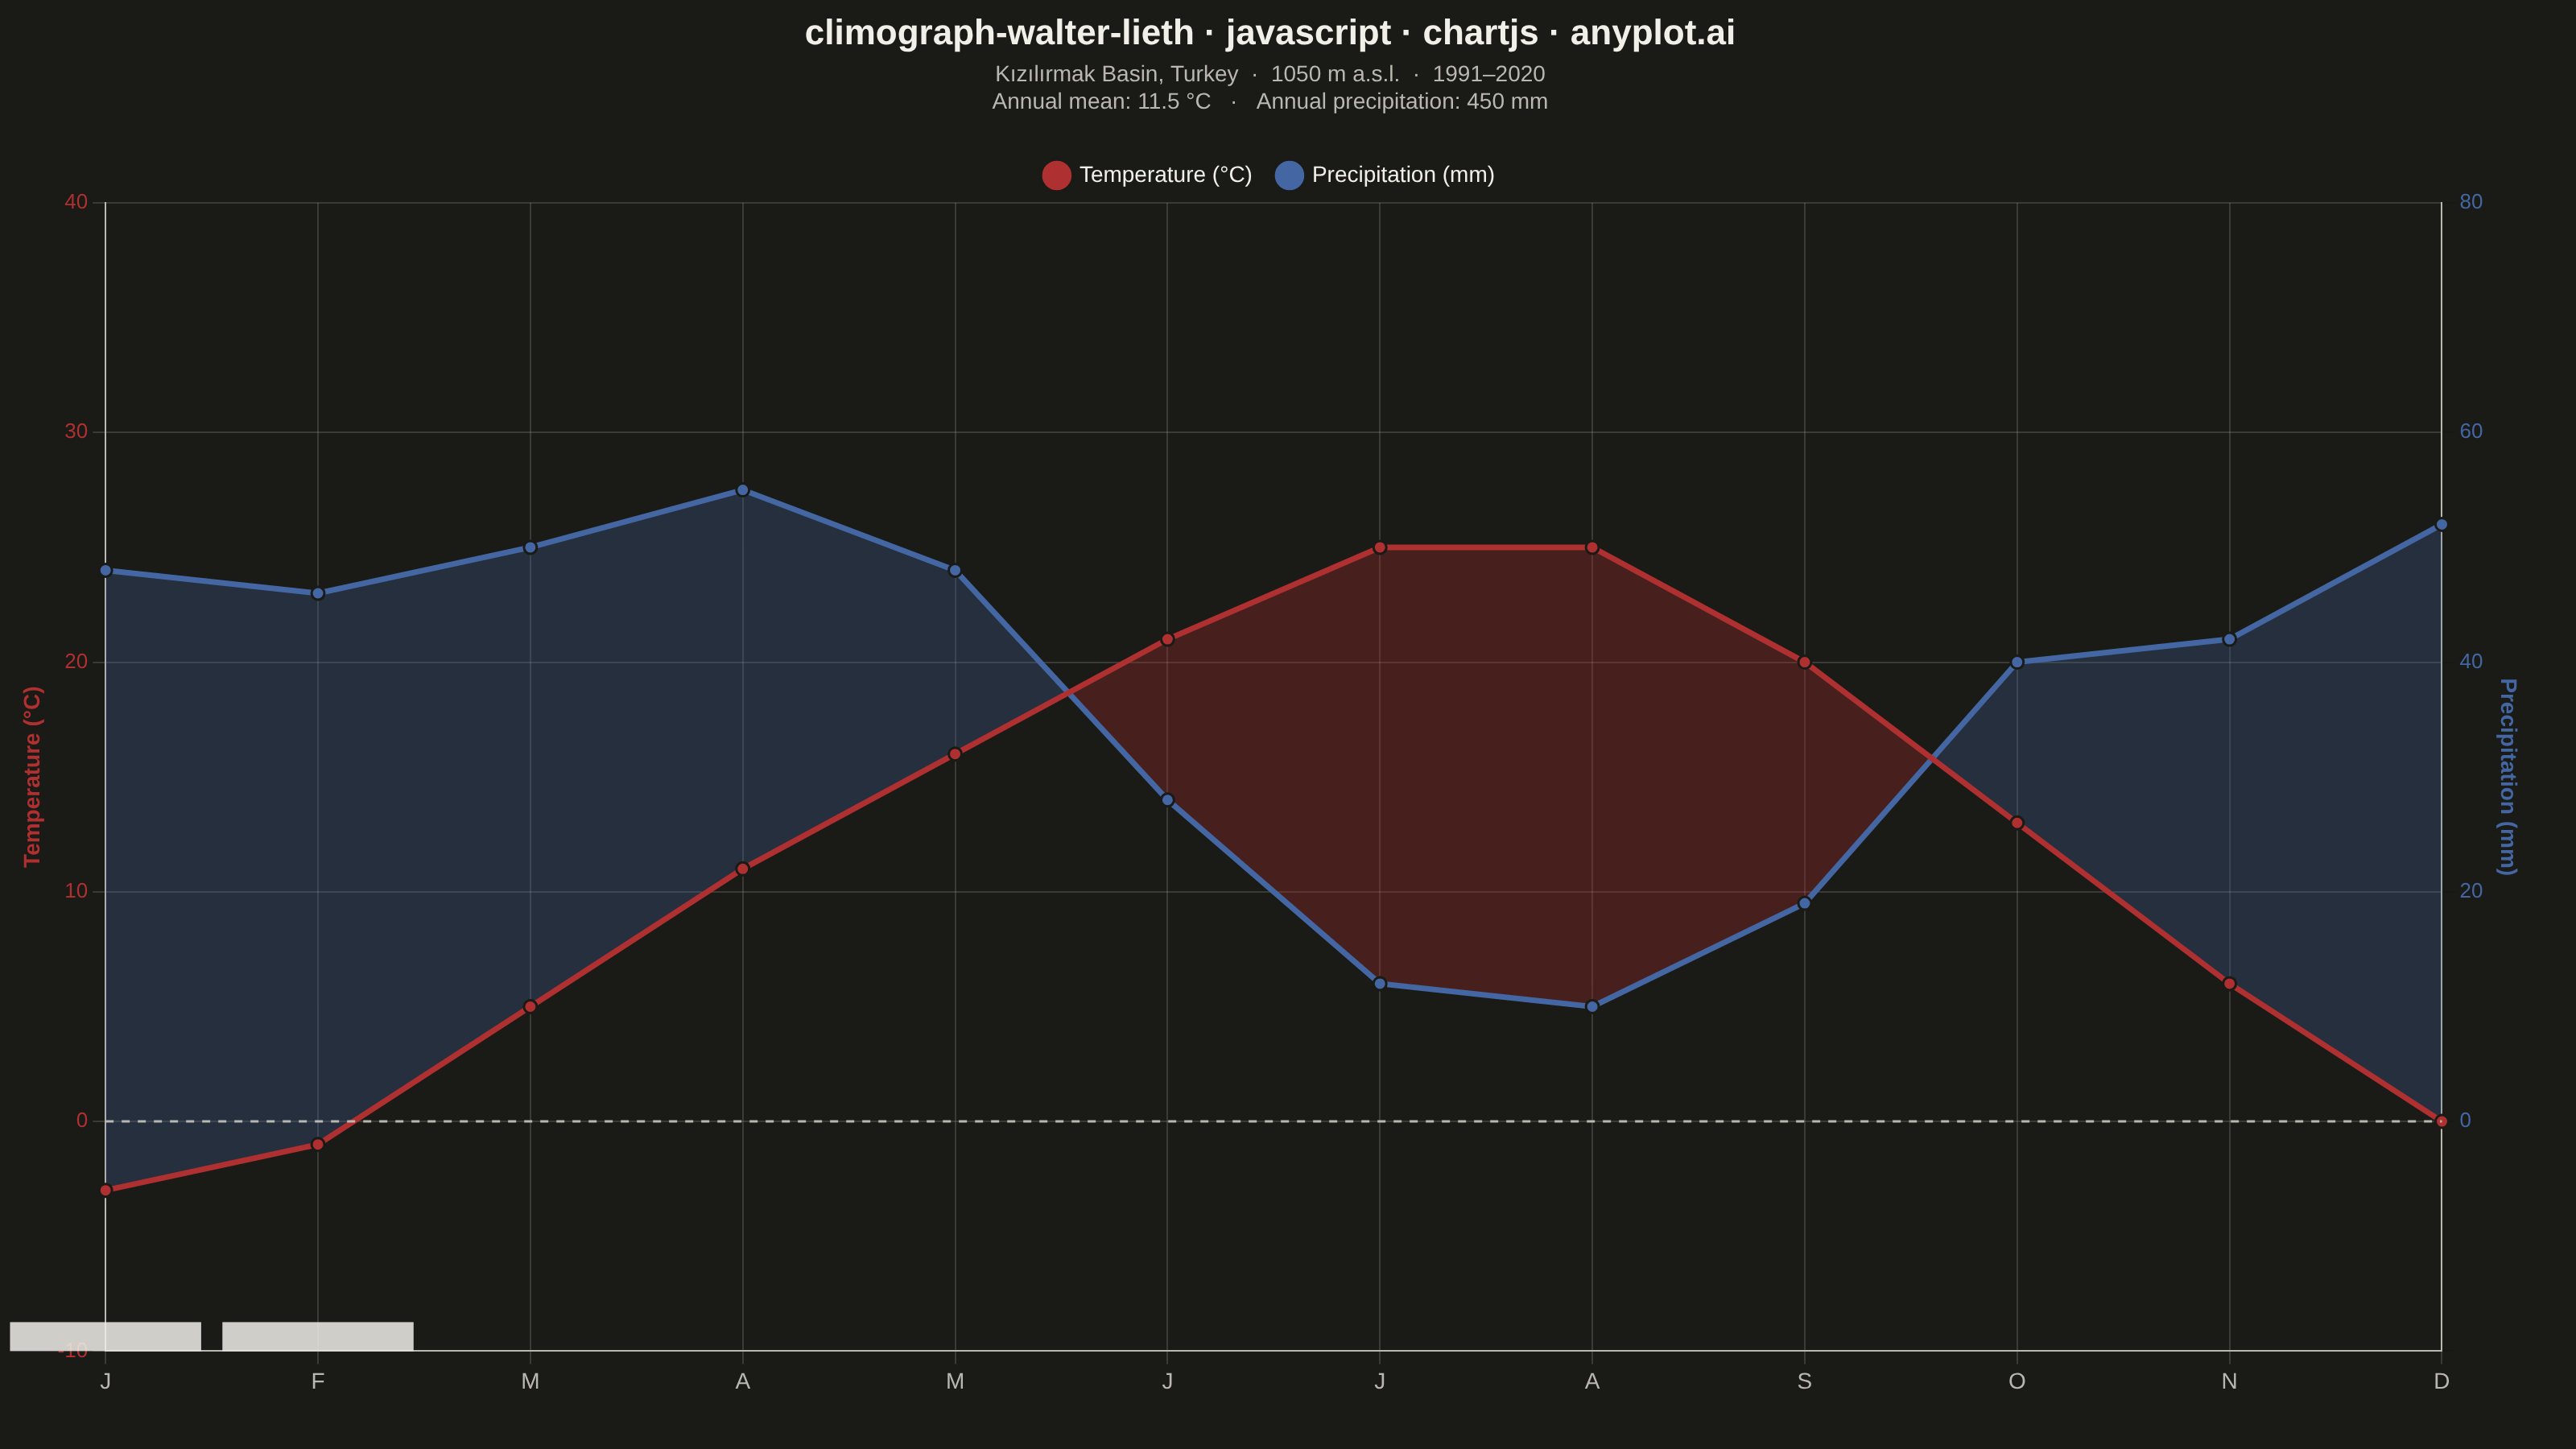
A Walter-Lieth climate diagram (climograph) is the canonical visualization of a location's annual climate, plotting monthly mean temperature and monthly precipitation over the twelve months on a single panel. It uses the classic 1:2 axis-scaling convention where 10 °C on the temperature axis aligns with 20 mm on the precipitation axis, so the relationship between the two curves directly reveals water availability: where precipitation exceeds the temperature curve the period is humid (filled blue/hatched), and where the temperature curve rises above precipitation the period is arid (filled red/dotted). A header carries station metadata and annual means, while frost indicators along the baseline mark cold months.
// anyplot.ai
// climograph-walter-lieth: Walter-Lieth Climate Diagram
// Library: chartjs 4.4.7 | JavaScript 22.22.3
// Quality: 92/100 | Created: 2026-06-15

const t = window.ANYPLOT_TOKENS;
const THEME = window.ANYPLOT_THEME || 'light';

// Station: Kızılırmak Basin, Turkey — continental Anatolia, 1991–2020 normals
const STATION  = "Kızılırmak Basin, Turkey";
const ELEVATION = 1050;
const PERIOD    = "1991–2020";

const months = ["J","F","M","A","M","J","J","A","S","O","N","D"];

// Monthly mean temperature (°C) and total precipitation (mm)
const temperature  = [-3, -1, 5, 11, 16, 21, 25, 25, 20, 13, 6, 0];
const precipitation = [48, 46, 50, 55, 48, 28, 12, 10, 19, 40, 42, 52];

// Annual statistics
const tempMean    = (temperature.reduce((a, b) => a + b, 0) / 12).toFixed(1);
const precipTotal = precipitation.reduce((a, b) => a + b, 0);

// Walter-Lieth axis bounds: precipitation scale = 2× temperature (10°C ↔ 20mm)
const TEMP_MIN = -10, TEMP_MAX = 40;
const PRCP_MIN = TEMP_MIN * 2, PRCP_MAX = TEMP_MAX * 2;  // -20, 80

// Colors — semantic: temperature = red (#AE3030), precipitation = blue (#4467A3)
const TEMP_COL  = t.palette[4]; // #AE3030 matte red
const PRCP_COL  = t.palette[2]; // #4467A3 blue
const HUMID_CLR = 'rgba(68,103,163,0.28)';  // blue fill — humid period (precip > temp)
const ARID_CLR  = 'rgba(174,48,48,0.30)';   // red fill  — arid period (temp > precip)
const FROST_CLR = THEME === 'dark' ? 'rgba(240,239,232,0.85)' : 'rgba(26,26,23,0.80)';

// --- Helper: fill quadrilateral between two curve segments ------------------
function fillQuad(ctx, x0, ty0, py0, x1, ty1, py1, fill) {
  ctx.save();
  ctx.beginPath();
  ctx.moveTo(x0, ty0);
  ctx.lineTo(x1, ty1);
  ctx.lineTo(x1, py1);
  ctx.lineTo(x0, py0);
  ctx.closePath();
  ctx.fillStyle = fill;
  ctx.fill();
  ctx.restore();
}

// --- Plugin: Walter-Lieth fills (humid / arid zones between the two curves) -
const wlFillPlugin = {
  id: 'wlFill',
  beforeDatasetsDraw(chart) {
    const { ctx } = chart;
    const d0 = chart.getDatasetMeta(0).data;  // temperature pixel points
    const d1 = chart.getDatasetMeta(1).data;  // precipitation pixel points
    if (!d0.length || !d1.length) return;

    for (let i = 0; i < d0.length - 1; i++) {
      const x0 = d0[i].x,    x1 = d0[i + 1].x;
      const ty0 = d0[i].y,   ty1 = d0[i + 1].y;
      const py0 = d1[i].y,   py1 = d1[i + 1].y;

      // Lower pixel-y = higher value; temp > precip means ty < py (arid)
      const arid0 = ty0 < py0;
      const arid1 = ty1 < py1;

      if (arid0 === arid1) {
        fillQuad(ctx, x0, ty0, py0, x1, ty1, py1, arid0 ? ARID_CLR : HUMID_CLR);
      } else {
        // Crossover — find intersection in pixel space
        // ty0 + f*(ty1-ty0) = py0 + f*(py1-py0)  →  f = (py0-ty0) / [(ty1-ty0)-(py1-py0)]
        const denom = (ty1 - ty0) - (py1 - py0);
        const f = Math.abs(denom) < 0.01 ? 0.5 : (py0 - ty0) / denom;
        const cx = x0 + f * (x1 - x0);
        const cy = ty0 + f * (ty1 - ty0);
        fillQuad(ctx, x0, ty0, py0, cx, cy,  cy,  arid0 ? ARID_CLR : HUMID_CLR);
        fillQuad(ctx, cx, cy,  cy,  x1, ty1, py1, arid1 ? ARID_CLR : HUMID_CLR);
      }
    }
  },
};

// --- Plugin: frost bands at chart bottom for months with mean T < 0°C ------
const frostPlugin = {
  id: 'frost',
  afterDatasetsDraw(chart) {
    const { ctx, chartArea } = chart;
    const d0 = chart.getDatasetMeta(0).data;
    const n  = temperature.length;
    const bandH = Math.max(8, Math.round(chartArea.height * 0.025));

    for (let i = 0; i < n; i++) {
      if (temperature[i] < 0) {
        const cx = d0[i].x;
        const dx = i < n - 1 ? d0[i + 1].x - cx : cx - d0[i - 1].x;
        ctx.fillStyle = FROST_CLR;
        ctx.fillRect(cx - dx * 0.45, chartArea.bottom - bandH, dx * 0.9, bandH);
      }
    }
  },
};

// --- Plugin: dashed 0°C reference line -------------------------------------
const zeroLinePlugin = {
  id: 'zeroLine',
  afterDatasetsDraw(chart) {
    const { ctx, chartArea, scales } = chart;
    const zeroY = scales.yTemp.getPixelForValue(0);
    ctx.save();
    ctx.beginPath();
    ctx.moveTo(chartArea.left, zeroY);
    ctx.lineTo(chartArea.right, zeroY);
    ctx.strokeStyle = t.inkSoft;
    ctx.lineWidth = 1.5;
    ctx.setLineDash([5, 5]);
    ctx.stroke();
    ctx.restore();
  },
};

// --- Mount -----------------------------------------------------------------
const canvas = document.createElement("canvas");
document.getElementById("container").appendChild(canvas);

// --- Chart -----------------------------------------------------------------
new Chart(canvas, {
  type: 'line',
  plugins: [wlFillPlugin, frostPlugin, zeroLinePlugin],
  data: {
    labels: months,
    datasets: [
      {
        label: 'Temperature (°C)',
        data: temperature,
        yAxisID: 'yTemp',
        borderColor: TEMP_COL,
        backgroundColor: TEMP_COL,
        borderWidth: 3.5,
        pointRadius: 4,
        pointBackgroundColor: TEMP_COL,
        pointBorderColor: t.pageBg,
        pointBorderWidth: 1.5,
        fill: false,
        tension: 0,
      },
      {
        label: 'Precipitation (mm)',
        data: precipitation,
        yAxisID: 'yPrec',
        borderColor: PRCP_COL,
        backgroundColor: PRCP_COL,
        borderWidth: 3.5,
        pointRadius: 4,
        pointBackgroundColor: PRCP_COL,
        pointBorderColor: t.pageBg,
        pointBorderWidth: 1.5,
        fill: false,
        tension: 0,
      },
    ],
  },
  options: {
    responsive: true,
    maintainAspectRatio: false,
    animation: false,
    layout: { padding: { top: 8, right: 30, bottom: 30, left: 8 } },
    plugins: {
      title: {
        display: true,
        text: 'climograph-walter-lieth · javascript · chartjs · anyplot.ai',
        color: t.ink,
        font: { size: 22, weight: 'bold' },
        padding: { bottom: 4 },
      },
      subtitle: {
        display: true,
        text: [
          STATION + '  ·  ' + ELEVATION + ' m a.s.l.  ·  ' + PERIOD,
          'Annual mean: ' + tempMean + ' °C   ·   Annual precipitation: ' + precipTotal + ' mm',
        ],
        color: t.inkSoft,
        font: { size: 14 },
        padding: { bottom: 14 },
      },
      legend: {
        display: true,
        labels: {
          color: t.ink,
          font: { size: 14 },
          usePointStyle: true,
          boxWidth: 20,
          padding: 16,
        },
      },
    },
    scales: {
      x: {
        ticks:  { color: t.inkSoft, font: { size: 14 } },
        grid:   { color: t.grid },
        border: { color: t.inkSoft },
      },
      yTemp: {
        type: 'linear',
        position: 'left',
        min: TEMP_MIN,
        max: TEMP_MAX,
        title: {
          display: true,
          text: 'Temperature (°C)',
          color: TEMP_COL,
          font: { size: 14, weight: 'bold' },
        },
        ticks: {
          color: TEMP_COL,
          font: { size: 13 },
          stepSize: 10,
        },
        grid:   { color: t.grid },
        border: { color: t.inkSoft },
      },
      yPrec: {
        type: 'linear',
        position: 'right',
        min: PRCP_MIN,
        max: PRCP_MAX,
        title: {
          display: true,
          text: 'Precipitation (mm)',
          color: PRCP_COL,
          font: { size: 14, weight: 'bold' },
        },
        ticks: {
          color: PRCP_COL,
          font: { size: 13 },
          stepSize: 20,
          callback: (v) => v < 0 ? '' : v,
        },
        grid:   { drawOnChartArea: false },
        border: { color: t.inkSoft },
      },
    },
  },
});
Runnable source as JSON, for any HTTP client: https://api.anyplot.ai/specs/climograph-walter-lieth/chartjs/code. Any spec id and library id listed in llms-full.txt fit the same URL shape; every URL below is complete and callable.
{
  "spec_id": "climograph-walter-lieth",
  "language": "javascript",
  "library": "chartjs",
  "page": "https://anyplot.ai/climograph-walter-lieth/javascript/chartjs",
  "hub": "https://anyplot.ai/climograph-walter-lieth",
  "code_json": "https://api.anyplot.ai/specs/climograph-walter-lieth/chartjs/code",
  "spec_json": "https://api.anyplot.ai/specs/climograph-walter-lieth",
  "render_light_png": "https://storage.googleapis.com/anyplot-images/plots/climograph-walter-lieth/javascript/chartjs/plot-light.png",
  "render_dark_png": "https://storage.googleapis.com/anyplot-images/plots/climograph-walter-lieth/javascript/chartjs/plot-dark.png",
  "interactive_light_html": "https://storage.googleapis.com/anyplot-images/plots/climograph-walter-lieth/javascript/chartjs/plot-light.html",
  "interactive_dark_html": "https://storage.googleapis.com/anyplot-images/plots/climograph-walter-lieth/javascript/chartjs/plot-dark.html",
  "quality_score": 92.0,
  "license": "MIT",
  "guide": "https://anyplot.ai/llms.txt"
}
Part of Walter-Lieth Climate Diagram on anyplot.ai.