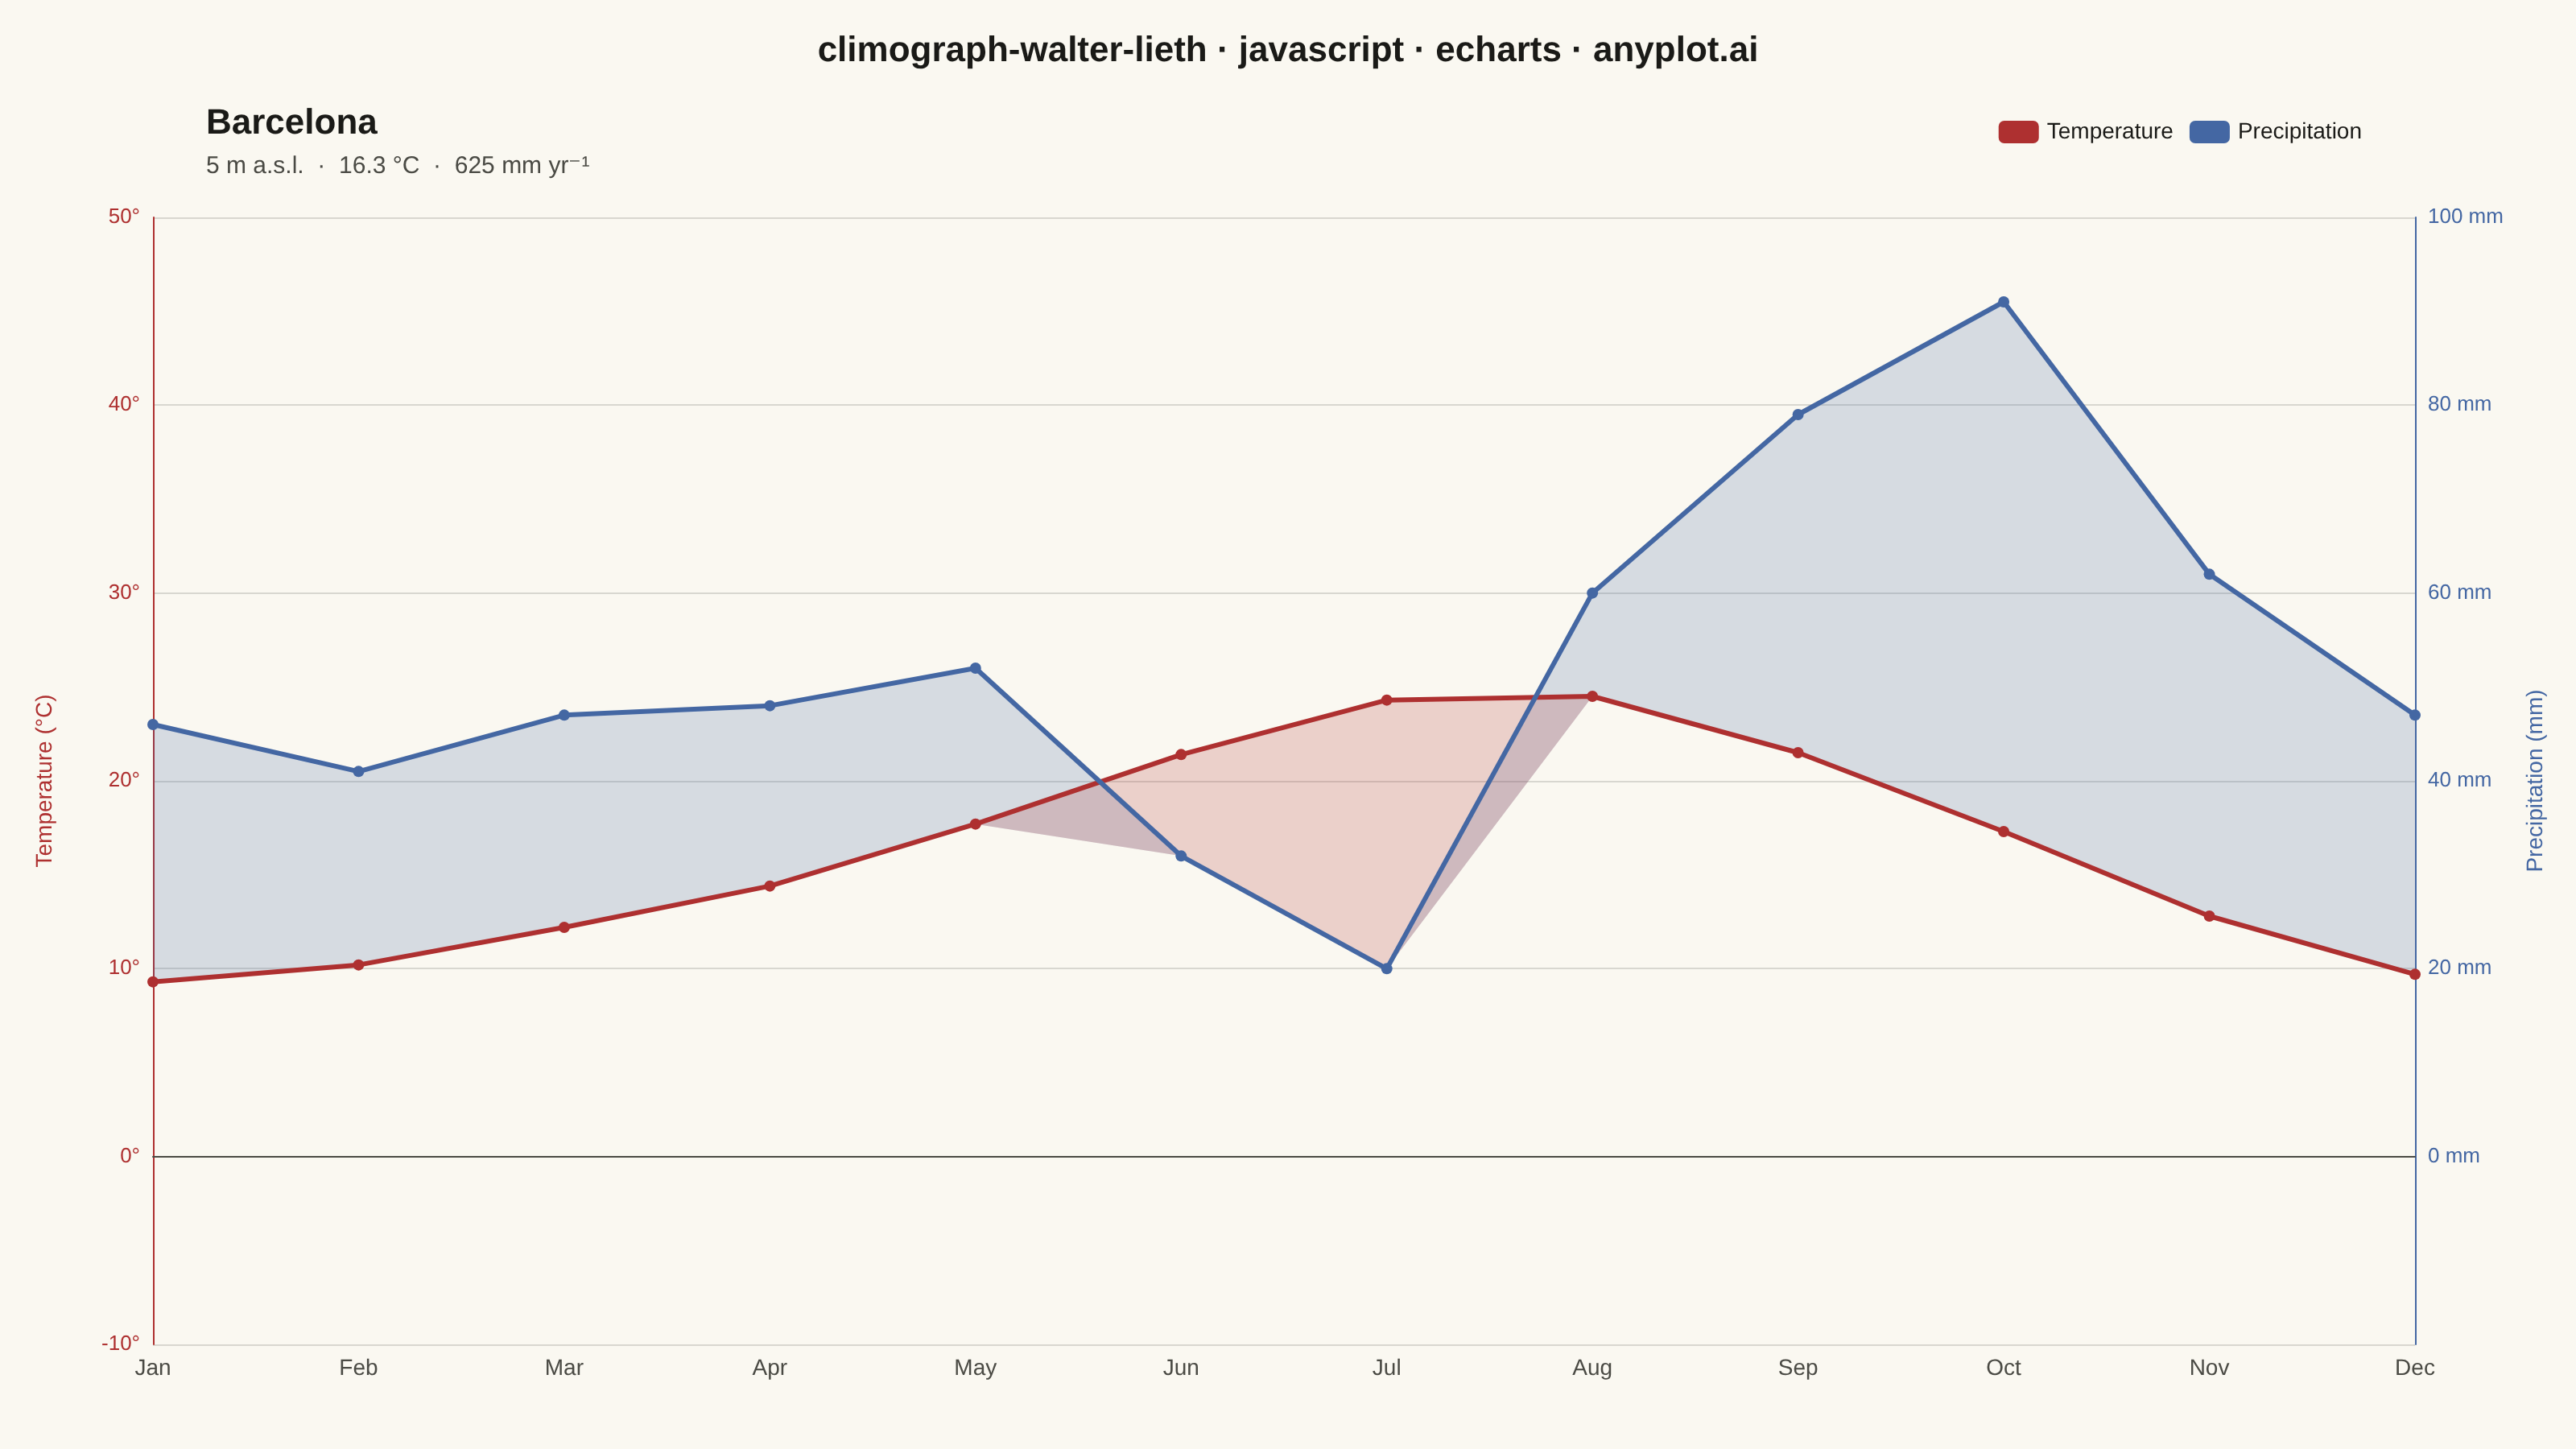
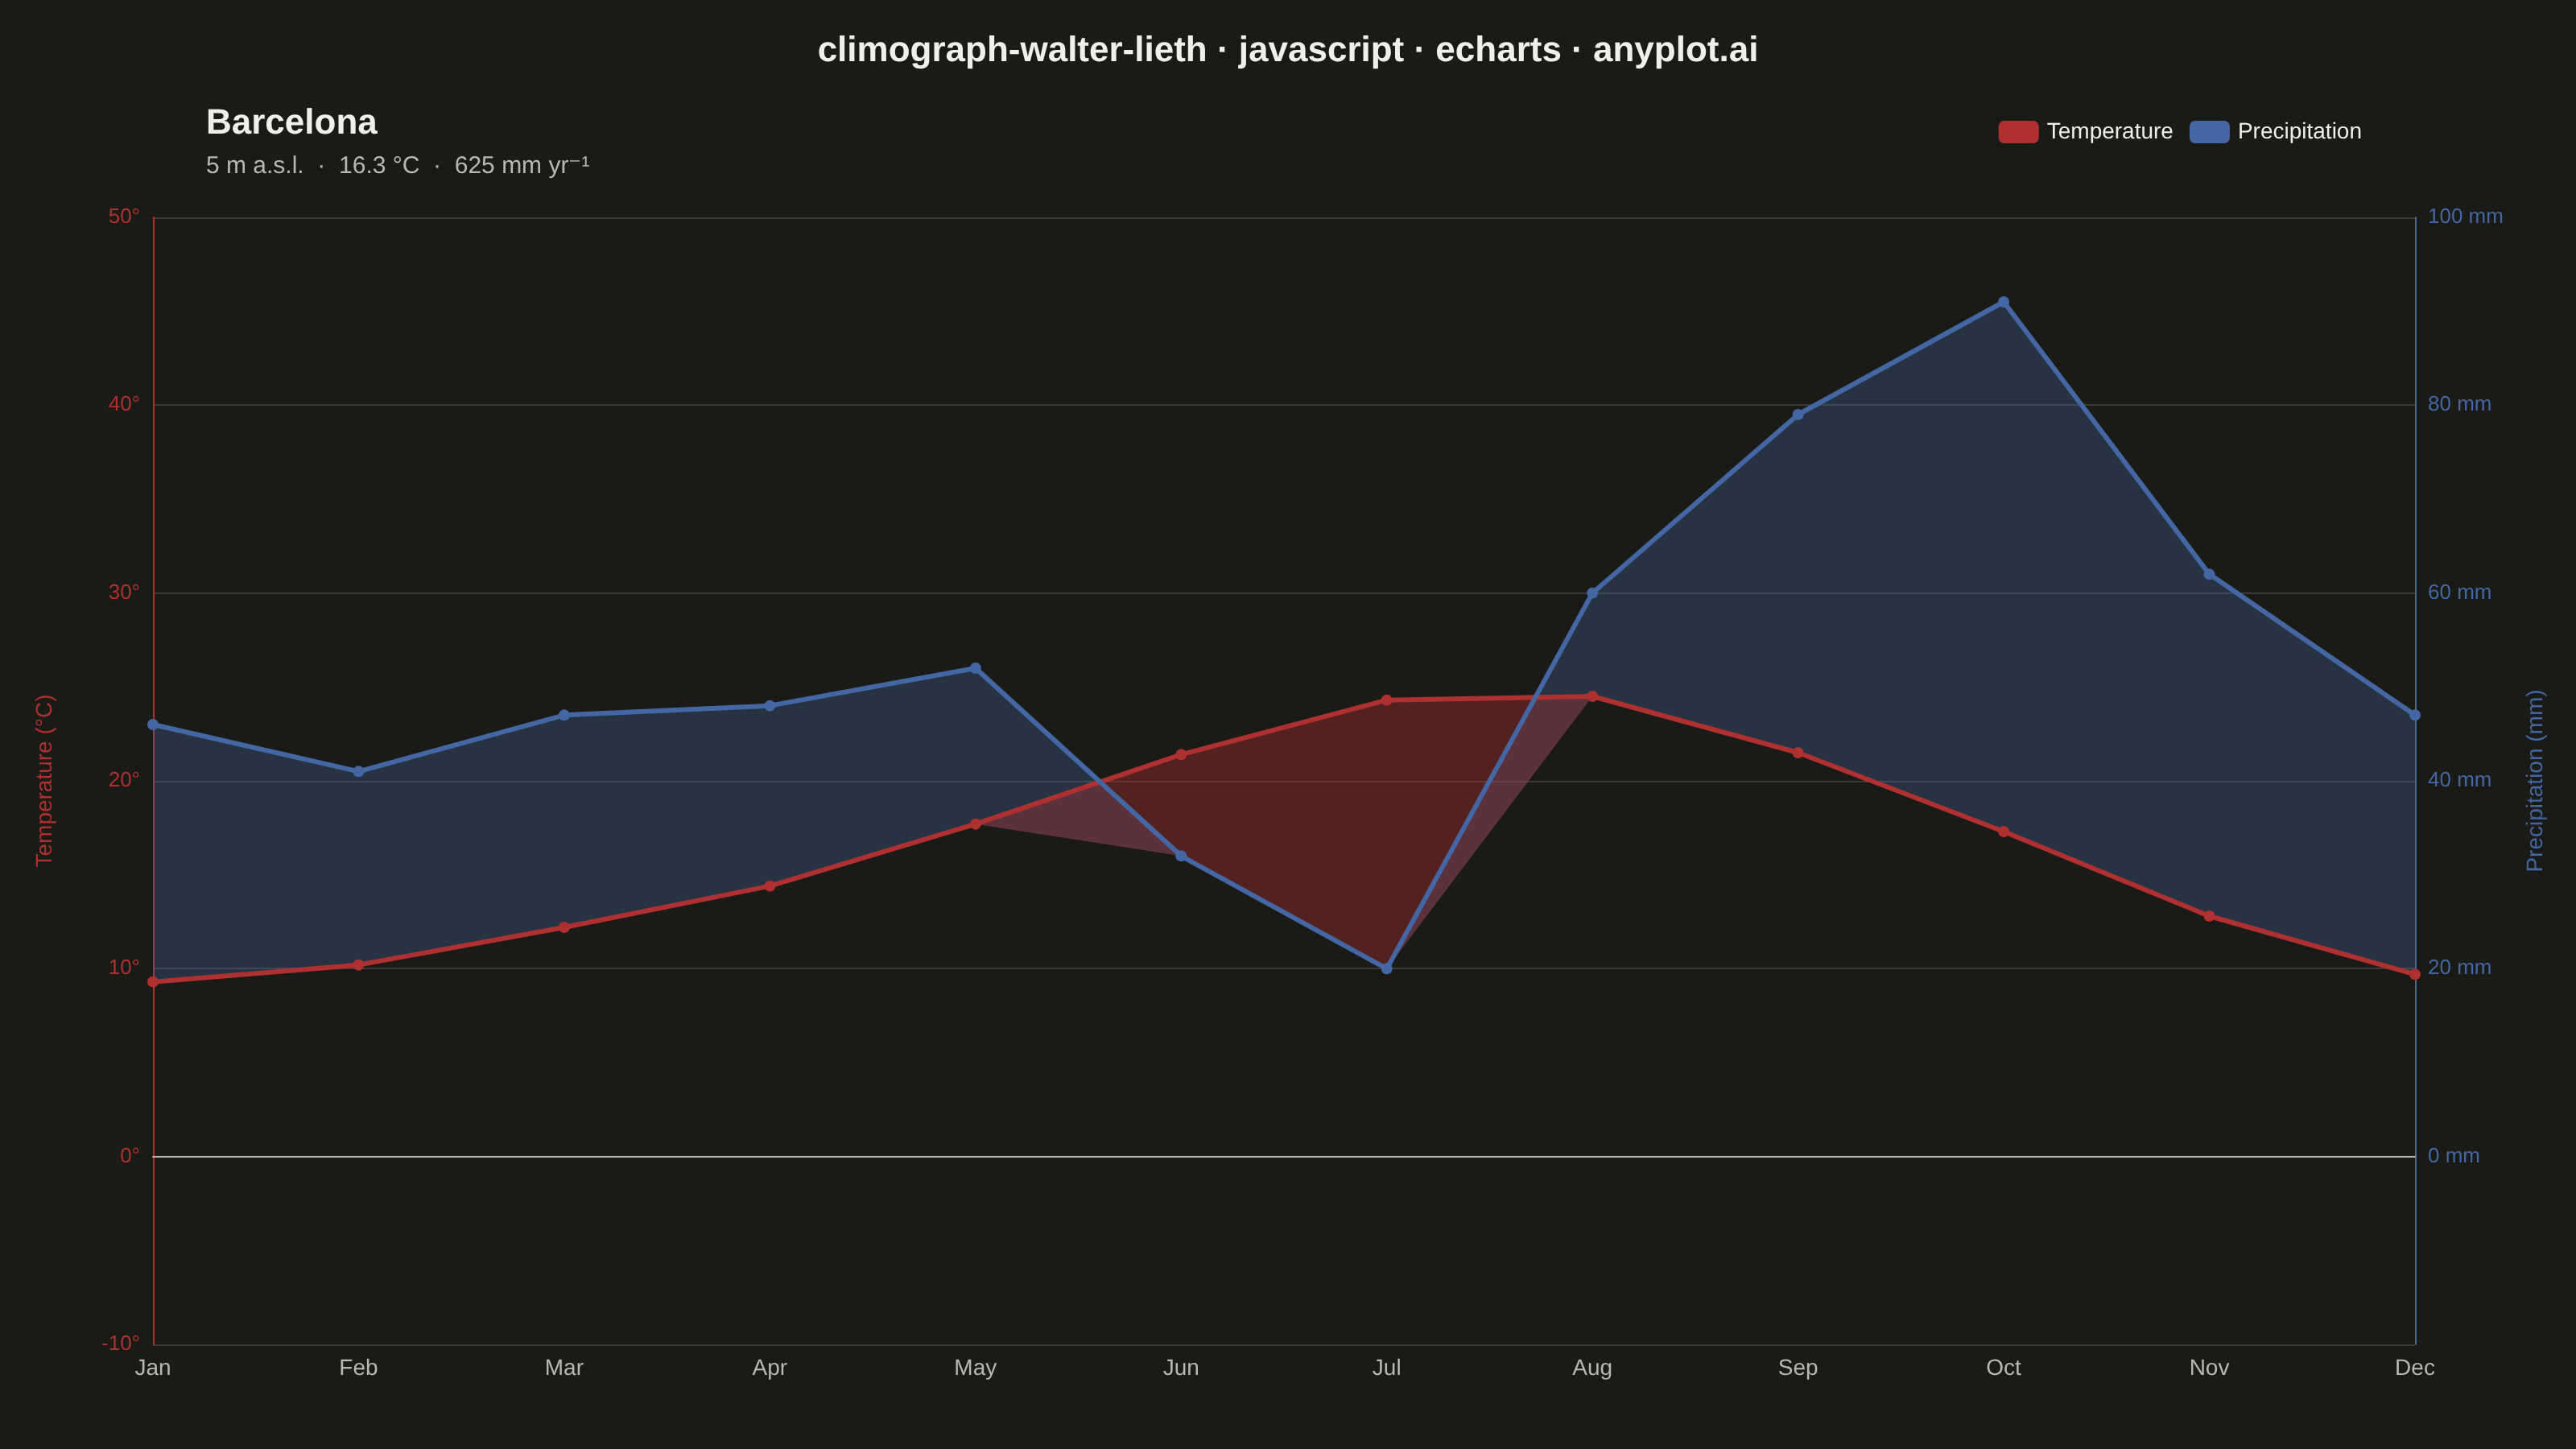
A Walter-Lieth climate diagram (climograph) is the canonical visualization of a location's annual climate, plotting monthly mean temperature and monthly precipitation over the twelve months on a single panel. It uses the classic 1:2 axis-scaling convention where 10 °C on the temperature axis aligns with 20 mm on the precipitation axis, so the relationship between the two curves directly reveals water availability: where precipitation exceeds the temperature curve the period is humid (filled blue/hatched), and where the temperature curve rises above precipitation the period is arid (filled red/dotted). A header carries station metadata and annual means, while frost indicators along the baseline mark cold months.
// anyplot.ai
// climograph-walter-lieth: Walter-Lieth Climate Diagram
// Library: echarts 5.5.1 | JavaScript 22.22.3
// Quality: 91/100 | Created: 2026-06-15

const t = window.ANYPLOT_TOKENS;
const isDark = window.ANYPLOT_THEME === 'dark';

// Barcelona, Spain — Mediterranean climate normal 1991–2020
const months = ['Jan', 'Feb', 'Mar', 'Apr', 'May', 'Jun', 'Jul', 'Aug', 'Sep', 'Oct', 'Nov', 'Dec'];
const temp   = [9.3, 10.2, 12.2, 14.4, 17.7, 21.4, 24.3, 24.5, 21.5, 17.3, 12.8, 9.7];
const precip = [46, 41, 47, 48, 52, 32, 20, 60, 79, 91, 62, 47];

// Walter-Lieth 1:2 axis convention: 10°C ↔ 20 mm (normal zone 0–100 mm)
// Above 100 mm the perhumid zone is compressed 1:10 (10°C ↔ 100 mm)
const PERHUMID_MM = 100;
const PERHUMID_Y  = PERHUMID_MM / 2; // 50 in temperature-axis units

// Transform precipitation to temperature-equivalent units for plotting
const precipNorm = precip.map(p =>
  p <= PERHUMID_MM ? p / 2 : PERHUMID_Y + (p - PERHUMID_MM) / 10
);

const annualTemp   = (temp.reduce((a, b) => a + b, 0) / 12).toFixed(1);
const annualPrecip = precip.reduce((a, b) => a + b, 0);

// Dynamic y-axis max: at least 50, extended if any perhumid months
const yMax = Math.max(50, ...precipNorm.map(p => Math.ceil(p / 10) * 10));

// Band fill data: humid where P_norm > T (blue), arid where T > P_norm (red)
const humidBase = temp.map((T, i) => Math.min(T, precipNorm[i]));
const humidFill = temp.map((T, i) => Math.max(0, precipNorm[i] - T));
const aridBase  = precipNorm.map((P, i) => Math.min(temp[i], P));
const aridFill  = temp.map((T, i) => Math.max(0, T - precipNorm[i]));

// Perhumid zone fill: solid blue for the compressed zone above 100 mm
const perhumidBase = precipNorm.map(p => Math.min(p, PERHUMID_Y));
const perhumidFill = precip.map((p, i) => p > PERHUMID_MM ? precipNorm[i] - PERHUMID_Y : 0);

// Theme-adaptive fill opacities — increase in dark mode to compensate for low contrast on #1A1A17
const HUMID_OPACITY = isDark ? 0.45 : 0.28;
const ARID_OPACITY  = isDark ? 0.55 : 0.28;

// Imprint palette — semantic exception: temperature = matte-red, precipitation = blue
const TEMP_COLOR   = '#AE3030'; // Imprint palette[4] matte-red — thermal/heat convention
const PRECIP_COLOR = '#4467A3'; // Imprint palette[2] blue — water/precipitation convention

// Frost indicator: months where mean temp < 0°C get a blue band in the -10 to 0 zone
// Barcelona has no frost months (min 9.3°C) — the mechanism is required by the spec
const frostAreas = months.reduce((acc, m, i) => {
  if (temp[i] < 0) {
    acc.push([
      { xAxis: m, yAxis: -10 },
      { xAxis: m, yAxis: 0 }
    ]);
  }
  return acc;
}, []);

const chart = echarts.init(document.getElementById('container'));

chart.setOption({
  animation: false,
  backgroundColor: 'transparent',

  title: {
    text: 'climograph-walter-lieth · javascript · echarts · anyplot.ai',
    left: 'center',
    top: 16,
    textStyle: { color: t.ink, fontSize: 22, fontWeight: 'bold' }
  },

  graphic: [
    {
      type: 'group',
      left: '8%',
      top: 66,
      children: [
        {
          type: 'text',
          style: { text: 'Barcelona', fontSize: 22, fontWeight: 'bold', fill: t.ink }
        },
        {
          type: 'text',
          top: 30,
          style: {
            text: `5 m a.s.l.  ·  ${annualTemp} °C  ·  ${annualPrecip} mm yr⁻¹`,
            fontSize: 15,
            fill: t.inkSoft
          }
        }
      ]
    }
  ],

  grid: { left: 95, right: 100, top: 135, bottom: 65 },

  xAxis: {
    type: 'category',
    data: months,
    boundaryGap: false,
    axisLabel: { color: t.inkSoft, fontSize: 14 },
    axisLine: { lineStyle: { color: t.inkSoft } },
    axisTick: { show: false },
    splitLine: { show: false }
  },

  yAxis: [
    {
      // Left axis: temperature scale (°C)
      type: 'value',
      name: 'Temperature (°C)',
      nameLocation: 'middle',
      nameGap: 60,
      nameTextStyle: { color: TEMP_COLOR, fontSize: 14 },
      position: 'left',
      min: -10, max: yMax, interval: 10,
      axisLabel: {
        color: TEMP_COLOR,
        fontSize: 13,
        formatter: v => v + '°'
      },
      axisLine: { show: true, lineStyle: { color: TEMP_COLOR } },
      axisTick: { lineStyle: { color: TEMP_COLOR } },
      splitLine: { lineStyle: { color: t.grid, type: 'solid' } }
    },
    {
      // Right axis: precipitation scale (mm), two-zone: normal 0–100 mm, compressed above 100 mm
      type: 'value',
      name: 'Precipitation (mm)',
      nameLocation: 'middle',
      nameGap: 68,
      nameTextStyle: { color: PRECIP_COLOR, fontSize: 14 },
      position: 'right',
      min: -10, max: yMax, interval: 10,
      axisLabel: {
        color: PRECIP_COLOR,
        fontSize: 13,
        formatter: v => {
          if (v < 0) return '';
          if (v <= PERHUMID_Y) return (v * 2) + ' mm';
          return (PERHUMID_MM + (v - PERHUMID_Y) * 10) + ' mm';
        }
      },
      axisLine: { show: true, lineStyle: { color: PRECIP_COLOR } },
      axisTick: { lineStyle: { color: PRECIP_COLOR } },
      splitLine: { show: false }
    }
  ],

  legend: {
    data: [
      { name: 'Temperature', icon: 'roundRect', itemStyle: { color: TEMP_COLOR } },
      { name: 'Precipitation', icon: 'roundRect', itemStyle: { color: PRECIP_COLOR } }
    ],
    top: 70,
    right: '8%',
    textStyle: { color: t.ink, fontSize: 14 }
  },

  tooltip: {
    trigger: 'axis',
    backgroundColor: t.elevatedBg,
    borderColor: t.grid,
    textStyle: { color: t.ink, fontSize: 13 },
    formatter: params => {
      const month  = params[0] ? params[0].axisValue : '';
      const tParam = params.find(p => p.seriesName === 'Temperature');
      const pParam = params.find(p => p.seriesName === 'Precipitation');
      let html = `<b>${month}</b><br/>`;
      if (tParam) html += `${tParam.marker} Temp: ${tParam.value} °C<br/>`;
      if (pParam) {
        const mmVal = pParam.value <= PERHUMID_Y
          ? (pParam.value * 2).toFixed(0)
          : (PERHUMID_MM + (pParam.value - PERHUMID_Y) * 10).toFixed(0);
        html += `${pParam.marker} Precip: ${mmVal} mm`;
      }
      return html;
    }
  },

  series: [
    // Humid fill baseline — transparent area from 0 up to min(T, P_norm)
    {
      name: '_humid_base',
      type: 'line',
      data: humidBase,
      yAxisIndex: 0,
      stack: 'humid',
      symbol: 'none',
      lineStyle: { width: 0 },
      areaStyle: { color: 'rgba(0,0,0,0)' },
      legendHoverLink: false,
      silent: true
    },
    // Humid fill — blue where precipitation exceeds temperature curve (humid period)
    {
      name: '_humid_fill',
      type: 'line',
      data: humidFill,
      yAxisIndex: 0,
      stack: 'humid',
      symbol: 'none',
      lineStyle: { width: 0 },
      areaStyle: { color: `rgba(68,103,163,${HUMID_OPACITY})` },
      legendHoverLink: false,
      silent: true
    },
    // Arid fill baseline — transparent area from 0 up to min(T, P_norm)
    {
      name: '_arid_base',
      type: 'line',
      data: aridBase,
      yAxisIndex: 0,
      stack: 'arid',
      symbol: 'none',
      lineStyle: { width: 0 },
      areaStyle: { color: 'rgba(0,0,0,0)' },
      legendHoverLink: false,
      silent: true
    },
    // Arid fill — red where temperature curve exceeds precipitation (arid/drought period)
    {
      name: '_arid_fill',
      type: 'line',
      data: aridFill,
      yAxisIndex: 0,
      stack: 'arid',
      symbol: 'none',
      lineStyle: { width: 0 },
      areaStyle: { color: `rgba(174,48,48,${ARID_OPACITY})` },
      legendHoverLink: false,
      silent: true
    },
    // Perhumid zone baseline — transparent up to 100 mm (PERHUMID_Y on temp scale)
    {
      name: '_perhumid_base',
      type: 'line',
      data: perhumidBase,
      yAxisIndex: 0,
      stack: 'perhumid',
      symbol: 'none',
      lineStyle: { width: 0 },
      areaStyle: { color: 'rgba(0,0,0,0)' },
      legendHoverLink: false,
      silent: true
    },
    // Perhumid zone fill — solid blue above 100 mm (compressed scale zone)
    {
      name: '_perhumid_fill',
      type: 'line',
      data: perhumidFill,
      yAxisIndex: 0,
      stack: 'perhumid',
      symbol: 'none',
      lineStyle: { width: 0 },
      areaStyle: { color: 'rgba(68,103,163,0.85)' },
      legendHoverLink: false,
      silent: true
    },
    // Temperature line (red, left axis) with frost indicator and 0°C reference line
    {
      name: 'Temperature',
      type: 'line',
      data: temp,
      yAxisIndex: 0,
      lineStyle: { color: TEMP_COLOR, width: 3 },
      itemStyle: { color: TEMP_COLOR },
      symbol: 'circle',
      symbolSize: 7,
      z: 10,
      markLine: {
        silent: true,
        symbol: ['none', 'none'],
        data: [{ yAxis: 0 }],
        lineStyle: { color: t.inkSoft, type: 'dashed', width: 1, opacity: 0.4 },
        label: { show: false }
      },
      // Frost indicator: solid blue band in -10 to 0 zone for months with mean temp < 0°C
      markArea: {
        silent: true,
        data: frostAreas,
        itemStyle: { color: 'rgba(68,103,163,0.6)', borderWidth: 0 },
        label: { show: false }
      }
    },
    // Precipitation line (blue, plotted as P_norm on temperature axis per Walter-Lieth convention)
    {
      name: 'Precipitation',
      type: 'line',
      data: precipNorm,
      yAxisIndex: 0,
      lineStyle: { color: PRECIP_COLOR, width: 3 },
      itemStyle: { color: PRECIP_COLOR },
      symbol: 'circle',
      symbolSize: 7,
      z: 10
    }
  ]
});
Runnable source as JSON, for any HTTP client: https://api.anyplot.ai/specs/climograph-walter-lieth/echarts/code. Any spec id and library id listed in llms-full.txt fit the same URL shape; every URL below is complete and callable.
{
  "spec_id": "climograph-walter-lieth",
  "language": "javascript",
  "library": "echarts",
  "page": "https://anyplot.ai/climograph-walter-lieth/javascript/echarts",
  "hub": "https://anyplot.ai/climograph-walter-lieth",
  "code_json": "https://api.anyplot.ai/specs/climograph-walter-lieth/echarts/code",
  "spec_json": "https://api.anyplot.ai/specs/climograph-walter-lieth",
  "render_light_png": "https://storage.googleapis.com/anyplot-images/plots/climograph-walter-lieth/javascript/echarts/plot-light.png",
  "render_dark_png": "https://storage.googleapis.com/anyplot-images/plots/climograph-walter-lieth/javascript/echarts/plot-dark.png",
  "interactive_light_html": "https://storage.googleapis.com/anyplot-images/plots/climograph-walter-lieth/javascript/echarts/plot-light.html",
  "interactive_dark_html": "https://storage.googleapis.com/anyplot-images/plots/climograph-walter-lieth/javascript/echarts/plot-dark.html",
  "quality_score": 91.0,
  "license": "MIT",
  "guide": "https://anyplot.ai/llms.txt"
}
Part of Walter-Lieth Climate Diagram on anyplot.ai.